
Sideways movement again fits the preferred hourly Elliott wave count.
We may now have some confidence about what should happen next.
Summary: A fourth wave triangle has most likely ended. The classic technical analysis equivalent to a triangle is a pennant, which is a very reliable continuation pattern. The breakout should be beginning now and should be down. The short term target is at 1,071. Fifth waves to follow fourth wave triangles are sometimes surprisingly short, which is why my target is so close. But if I’m wrong, then it may not be that short and my target may not be low enough.
To see weekly charts click here.
Changes to last analysis are bold.
MAIN ELLIOTT WAVE COUNT
Click chart to enlarge.
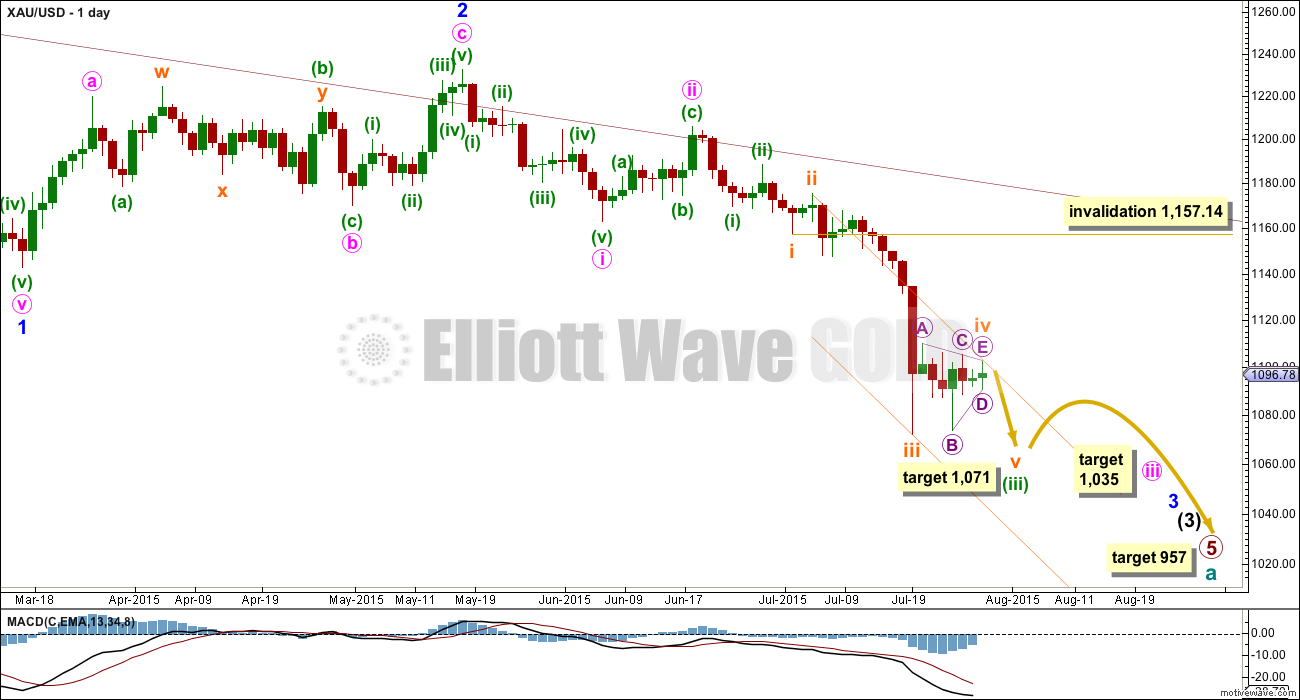
Cycle wave a is an incomplete impulse.
Within primary wave 5, the daily chart focuses on the middle of intermediate wave (3). Within intermediate wave (3), minor wave 3 now shows a slight increase in momentum beyond that seen for the end of minor wave 1 at the left of the chart. Third waves for Gold usually have clearly stronger momentum than its first waves, so I still expect to see a further increase in downwards momentum. The strongest downwards momentum may appear in a fifth wave somewhere within minor wave 3, or maybe the fifth wave to end minuette wave (iii) or minute wave iii, or that to end minor wave 3 itself.
Draw a base channel about minuette waves (i) and (ii) as shown (green trend lines). If the steeper orange channel is breached then look for the lower green trend line to provide resistance. Only if the upper green line is breached would I consider the wave count to be wrong.
Subminuette wave iii looks like it is over at the daily chart level. Subminuette wave iii has a typical curved look to it at the daily chart level and this wave count has the right look.
Subminuette wave iv may not move into subminuette wave i price territory above 1,157.14.
It is now very likely that subminuette wave iv has just completed as a regular contracting triangle. The structure is clear on the daily and hourly charts. Subminuette wave ii was a relatively deep 0.58 zigzag lasting two days, and subminuette wave iv exhibits perfect alternation as a shallow 0.29 triangle lasting seven days. Zigzags are normally quicker than triangles, so some disproportion would be expected.
Redraw the channel about minuette wave (iii) using Elliott’s second technique: draw the first trend line from the ends of subminuette waves ii to iv, then place a parallel copy on the end of subminuette wave iii. Because the fourth wave is a triangle the fifth wave may have a tendency to be relatively short. At 1,071 subminuette wave v would reach equality in length with subminuette wave i. It is very likely to make at least a slight new low below the end of subminuette wave iii at 1,072.09 to avoid a truncation and the target would see it just do this.
When minuette wave (iii) is a complete five wave structure then minuette wave (iv) should unfold sideways. It may be very shallow because minuette wave (ii) was relatively deep at 0.52. Minuette wave (ii) lasted three days and was an expanded flat. Minuette wave (iv) may exhibit alternation as another triangle or a zigzag most likely, and may last about five to eight days.
At 957 primary wave 5 would reach equality in length with primary wave 1.
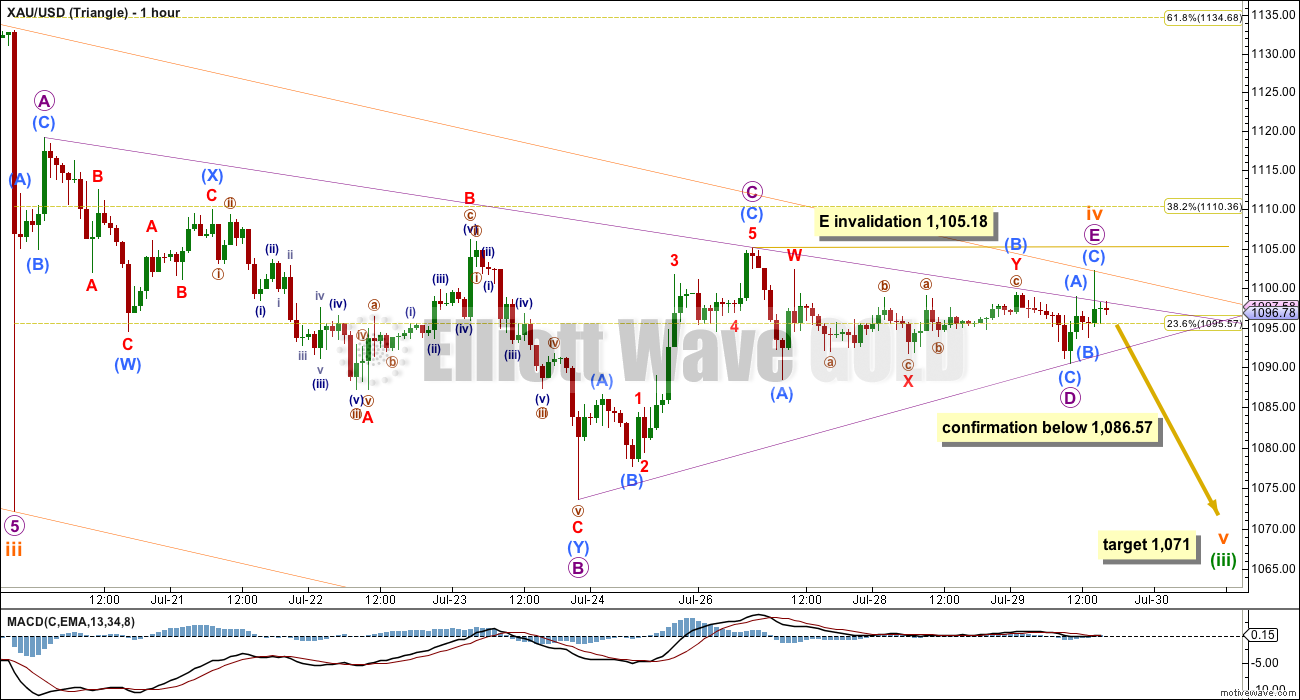
HOURLY CHART – TRIANGLE
Click chart to enlarge.
Micro wave D of the triangle did not itself unfold as a triangle but was a zigzag with a complicated B wave within it. This means that micro wave B may again be seen as a double zigzag which has a better fit.
The triangle for subminuette wave iv fits nicely within its trend lines. The lines will cross over in the next 24 hours, which may be when subminuette wave v ends. This cross over change sometimes works, so look out for it, but keep in mind that it does not always work. If it does not work here, then subminuette wave v may last longer than just one day.
Micro wave E to end the triangle overshoots the A-C trend line. E waves to end triangles most commonly undershoot the A-C trend line, but sometimes they overshoot as in this case. They do not normally end right at the trend line.
If micro wave E continues any higher, then it may not move beyond the end of micro wave C above 1,105.18. A new high above 1,105.18 is less likely today, but if it happens we may use the alternate below.
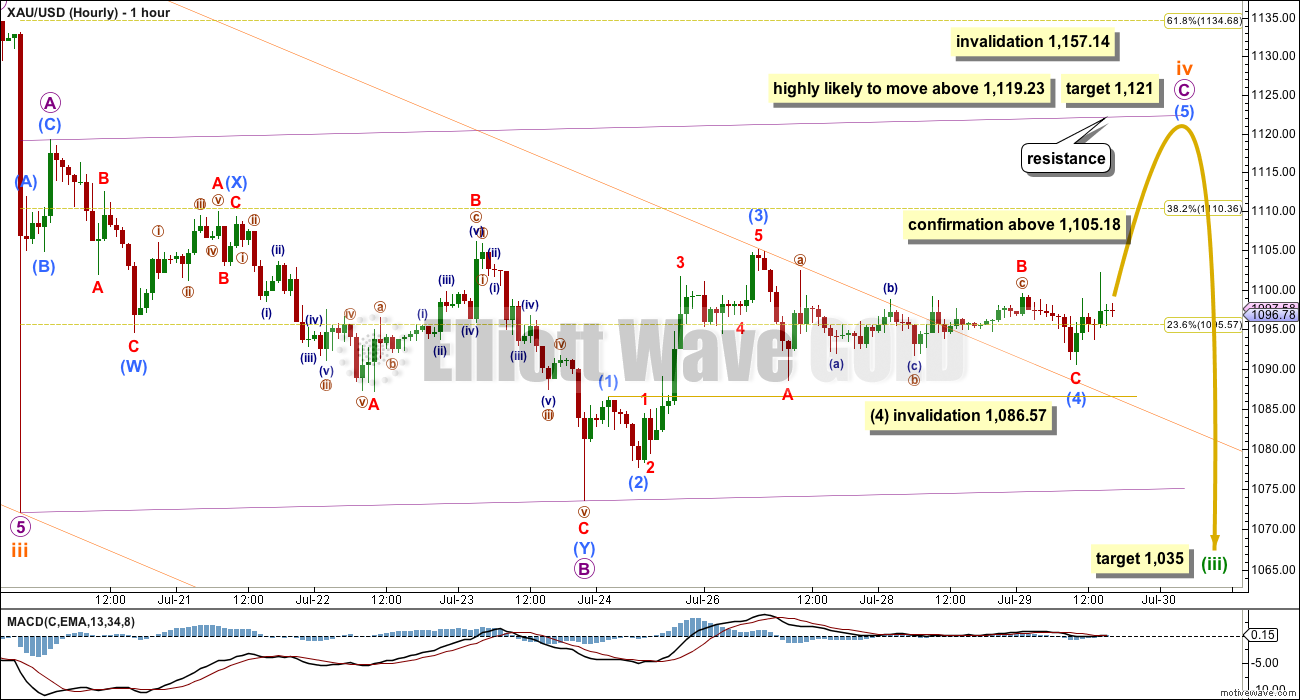
HOURLY CHART – FLAT
Click chart to enlarge.
It remains technically possible today that subminuette wave iv is not over and may complete as a regular flat correction. This idea today has a reduced probability and should only be used if it is confirmed with a new high above 1,105.18.
The flat subdivides 3-3-5. Micro wave C must be a five wave structure and should look reasonably like a five. Today, because of the gross disproportion between its second and fourth waves, micro wave C no longer looks like a potential five and looks strongly like a three. This substantially reduces the probability of this idea.
Submicro wave (4) no longer fits the rules for a contracting triangle. Because MACD is right at the zero line for this piece of movement, and because the first wave count sees a triangle ending there, these also reduce the probability of this idea. There was a triangle in that position, but this wave count cannot see it.
There is no longer alternation between submicro waves (2) and (4). Both are zigzags. This further reduces the probability of this wave count.
If this idea is confirmed with a new high above 1,105.18, then the target remains at 1,121 for micro wave C to reach equality in length with micro wave A.
Thereafter, submineutte wave v down should unfold and may be long, swift and strong. At 1,035 minuette wave (iii) would reach 4.236 the length of minuette wave (i).
TECHNICAL ANALYSIS
Click chart to enlarge.
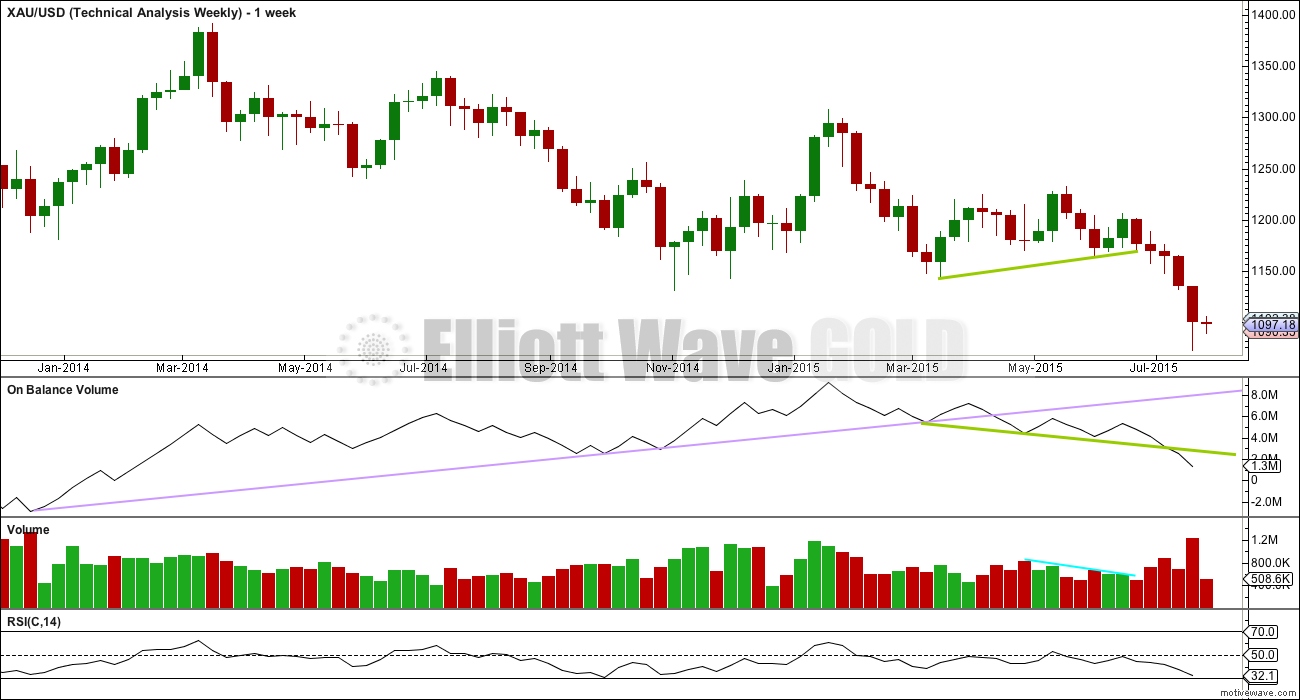
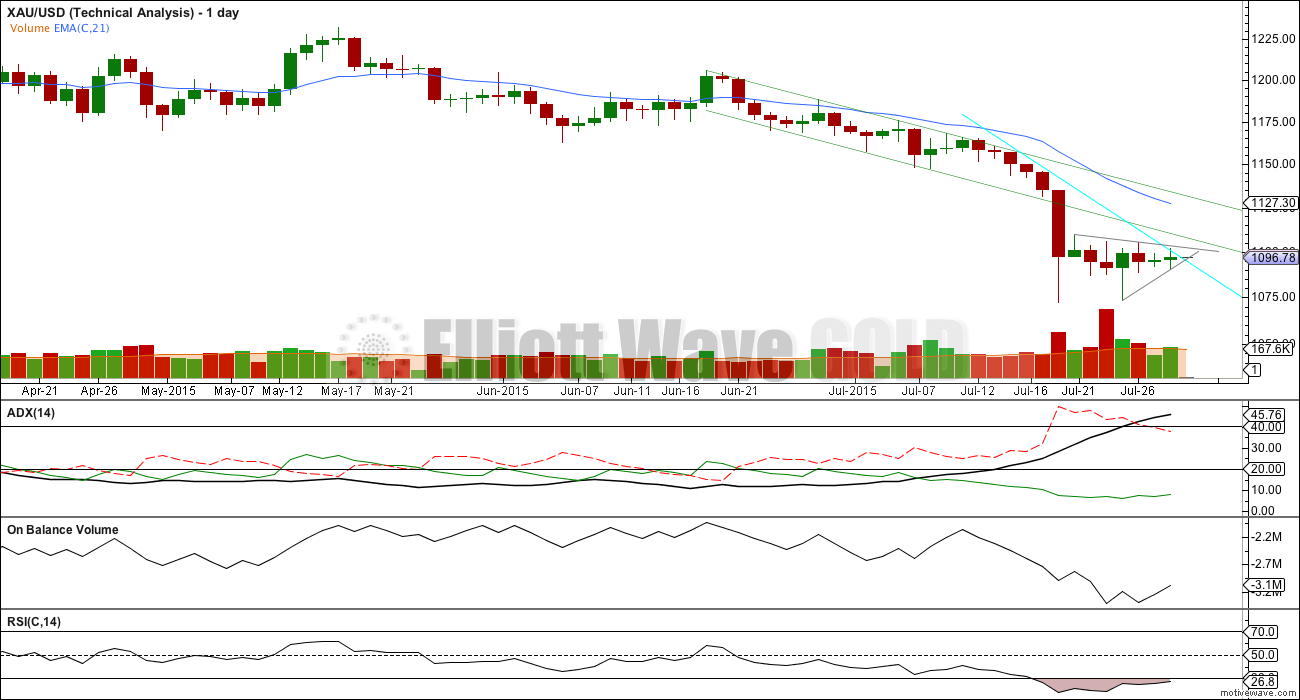
Weekly Chart: The lilac trend line on On Balance Volume has been breached, which is a longer term bearish indicator.
OBV is now breaking below the shorter green trend line, another bearish indicator.
As price falls volume is increasing and OBV is moving lower. This fall in price is supported by volume at the weekly chart level.
RSI is usually a fairly reliable indicator of lows. At the weekly chart level, RSI is still above 30 indicating there is room yet for Gold to move lower.
Click chart to enlarge.
Daily Chart: Yesterday’s volume is clearly declining and the trading range narrowing. This sideways movement looks like a fairly good pennant which is a reliable continuation pattern (pennants are smaller versions of triangles). 90% of pennants are characterised by a downtrend in volume, and they usually occur after a strong trend. Volume and the trend support this pattern. The breakout should be expected to be in the direction of the trend. Pennants are such reliable continuation structures that some traders base their trading strategy on them. At this stage, I would no longer expect a false breakout. The Elliott wave count for the triangle is supported by this classic technical analysis pattern and volume.
Today volume shows a slight increase for a very small green doji. This may signal the end of the correction. A classic technique would be to wait to see which of the pennant trend lines price breaks out of, with the expectation that down is more likely, before having confidence the trend has returned. Overall during the formation of the pennant, it was a down day which has stronger volume supporting the idea that a downwards breakout is more likely.
ADX continues to rise during the formation of this consolidation. Despite price drifting sideways the trend continues to strengthen and remains down.
A trend following strategy should be used. Trading with the trend is advised. A mean reverting system which allows trades against the trend should only be used by the most experienced professional traders, and for all others it is strongly advised to never trade against the trend.
The simplest system for a downwards trend like this is to use resistance lines: each time price touches resistance that represents an opportunity to enter in the direction of the trend. Trades may be held until price either reaches support, a target, or if the trade is held for one day if you are a day trader. Depending upon your trading style, your risk management, and management of the equity in your account, stops as always are essential: they may be money management stops, they may be just above lines of resistance (allow for small overshoots), or they may be Elliott wave invalidation points.
Corrections against the trend offer an opportunity to join the trend at a good price.
The aqua blue trend line may today be showing about where this correction finds resistance.
This approach outlined here is just one trend following method of many.
There is a little positive bullish divergence last week: the low for 23rd July did not move below the prior low of 17th July, but On Balance Volume did make a new low. OBV moved lower while price did not. This bullish divergence indicates a correction against the trend to unfold, which is what has been happening. This correction should resolve this divergence.
The last two days have completed two small doji. This indicates indecision, a balance between bulls and bears. This fits with the idea of a small fourth wave correction completing.
This analysis is published about 06:19 p.m. EST.
Richard
What platform do you have?
TOS – Think or Swim Platform – real time, amazing, unlimited indicators, even real time for GDX, DUST, NUGT, anything and can add compare with other indicators like /GC or $DXY. A dream platform. I have it on it’s own monitor all day long. And it is FREE.
I first heard about americanbulls.com from papudi on this site a few months ago. I use it to get a sense of which way the short term breeze is blowing for the miners. Americanbulls.com reads daily candlesticks and gives hypotheical trades based on that analysis. Unfortunately, we cannot match those trading results because they depend on intra-day time travel.
As of yesterday’s close, americanbulls.com was short-term bullish on many miners and short term negative on DUST.
Lara,
Is the lower target of 1,071 still in effect and soon like today or maybe delayed until tommorrow?
Or are we staying with a big truncation because July 24th gold fell too far too fast.
Is the 5 -8 day shallow bounce still upcoming or did that really speed up and happen today when gold bounced up to the 1,095 upper trend line.
How do we stop typing 1,171, when it is actually 1,071? It happening a lot today? LOL
We’re not going to reach it today.
That trick with the triangle trend lines crossing over has not worked this time.
I’m seeing subminuette wave v as an impulse, and within it micro waves 1 and now 2 are complete.
Use the upper edge of the orange channel for resistance along the way down, and also keep extending the triangle trend lines out and using them as resistance. The lower B-D trend line has just provided resistance for micro wave 2 which is why I’m expecting it’s now complete.
So right now I’m expecting a micro degree third wave to be unfolding downwards.
We may get into it’s fifth wave tomorrow and that may be swift and strong.
It looks like subminuette wave v may take a total Fibonacci three days (maybe?) to complete.
*Edit: I have just calculated a target for micro wave 3 at 1,064 which means the target for subminuette wave v would be too high. I’ll recalculate it for now at 1,035.
When micro waves 3 and 4 are complete I can add to the target calculation, maybe tomorrow, at that stage it may widen to a small zone or it may change.
Appreciated Lara –
Made some money today which feels unusual 🙂
Thanks everyone for your input today. Really helps to have intelligent/ profitable people sharing views and opinions.
Best wishes
That’s great Aiden. Make wise small trades and take profits and cut losses.
So if I’m right, we’ve just seen a deep second wave correction. A third wave has just begun.
Third waves are the Holy Grail of EW traders because they have the clearest strongest trend. For Gold it is the fifth wave within it’s third waves (the end of them) which is the absolute best, but you have to be nimble to catch the end of them.
If my wave count is right then the risk is at today’s high of 1,095. That’s how far against the trend this third wave can encompass.
Because the second wave correction today was deep I’ll expect the next fourth wave correction to be shallow. So from here to the final target (which for now is 1,035 but that may have to change tomorrow) it should be a fairly clear downwards trend.
Staying with the trend is the easiest way to profit. Keeping stops set, and not changing them if the market goes against you, is a really good idea. All the books I have read suggest to not risk any more than 2% of your equity on any one trade to avoid wiping out your account.
Good luck Aiden!
As to your other questions, no, I’ll not expect a truncation.
There’s a five down complete now but to see that as subminuette wave v over there it would be way to huge a truncation.
The shallow bounce for minuette wave (iv) is not probably another two days (maybe?) from starting.
For now I’m expecting downwards movement for another two days.
Everything has stopped moving!
Unsure whether to take DUST off table or hold overnight?
Myself if I make profits in a big move in an 3xETF one day I take profits off the table, while they are there as they soon vanish. Sometimes as soon as an hour like yesterday when DUST crashed.
Or perhaps Lara’s comments before the close will help you.
My entry was not great so profits are small.
Going to hold into the close and see what Lara says.
Appreciate the sound advice.
A
Avi Gilburt – Forget whether $100 silver is possible, how about $1000? July 30, 2015 11:01 a.m. ET
http://www.marketwatch.com/story/forget-whether-100-silver-is-possible-how-about-1000-2015-07-30
Lara,
Can you offer any further confirmation or correction in wave count?
you mentioned that the subminuett 5 wave might conclude at the apex of the 4th wave triangle within 24 hrs..
see my comment in reply to Richard above.
Just sold the rest of my DUST. Not sure if something is wrong with the count or gold.
Impatient and taking my profits now after only holding DUST for 3 market hours.
Will wait for Lara’s comments before buying.
Good luck everyone on gold reaching the target and your getting Maximum profits.
I concur, I also just took profits. The move down to 1071 should be swifter than this
Robert you had good timing as at 11:48 gold changed directions to up and DUST dropped 75 cents in the last 30 minutes.
We need a good wave count ASAP to keep profits and /or to make more.
Agreed, speaking of wave counts where is THAM!!
Just an idea – Minute 3 was over last week at the low. This is all minute 4, which might be a simple zig zag, with wave A being that move up late last week (potential 5 wave structure from 1176 to 1104), wave B all of the downwards movement since then until this morning at 1182, and today the unfolding of wave C, which if equal with A, would get up to around 1110, before going down again for minute wave 5 and end to minor wave 3. This idea would be invalidated if gold gold goes below 1188 anytime soon.
1076 not 1176, 1082 not 1182, 1088 not 1188.
I think this is happening a lot including to me. LOL
it seems everyone now has the 10 v. 11 issue. (It’s all your fault. lol. you started it!) JUST KIDDING
Pretty funny that we don’t even notice it until we reread it.
hahaha yup sorry
I’ve charted and published that idea here.
I chose to discard it because it doesn’t have the right look for it’s third wave at the daily chart level, and there were no Fibonacci ratios within the third wave. The wave count I am using resolves both of those problems.
So I’ll not publish it again. Yes, it’s technically possible. But if you can find a wave count which has ratios and the “right look” its way more likely that that is the correct wave count.
Hi Lara thank you for responding to this. I couldn’t see the idea charted on that page, but in any event I do defer to you on ratios and such as attempting to analyze by eye is no match for the detailed and rigorous analysis you do day in and day out. Thanks!
Oh yes, my bad, you’re right.
I’ve looked at the possibility that minuette (iii) could be over… and charted that.
I have also looked to see if minute iii could be over and it won’t fit. So I’m concluding it’s not done yet.
Lara:
“I wouldn’t bet on that. The last two fourth wave triangles surprised all of us with a very short fifth wave to follow. Let’s not be surprised again.
If price breaks above the upper edge of the redrawn channel that’s most likely it for this fifth wave.
But first, it has to make a new low below 1,072 to avoid a truncation.”
So according t this wave v is complete????? since gold breached lower trend line of triangle?
It appears to me that the Lower Trendline from the triangle has now been re-tested. (According to Lara only the upper trendline is cause for upset) Her 1071 target is short or close by as 5th waves after triangles are often truncated. (If her target is wrong it may be too close/not low enough)
That’s how I understand it.
No, that would be way to huge a truncation.
Only the first and second waves within our fifth wave down are complete.
It’s now ready to move into a third wave, and within that look out for a possibly swift strong fifth wave to end it.
Scroll down (to find) for Lara’s comment July 30, 2015 03.18am……
Thanks so much Syed.
Her comment was to me and even I was running around the site trying to figure out where all the fine details were. 🙂
Every one agree that flat wave count is invalidated??
How high this corrective will go? Any fib #?
Yes once invalidated it stays invalidated even if gold bounces back up above it.
Lara said, If price breaks above the upper edge of the redrawn channel that’s most likely it for this fifth wave. It looks above to me!
Where did you find that? The only statement I found was to use the channel after we go below 1172 (so we are sure there is no truncation).
In comment reply to dsprospering below. but you are right about avoiding truncation first
She points at upper channel on daily chart, and that is not clearly above that when gold hit 1095.55 high today.
It’s well within the channel. I’m referring to the orange channel on the daily chart and copied over to the hourly.
Once again wave has changed so it appears. I have not clue. Gold was to go down in wave v to 1071 instead it is higher.
Possible wavecounts:
We could be at the end of a deep micro4/start of micro 5. Invalidation if it goes any higher, unless subminuette 5 is an ending diagonal in which case invalidation is over 1102 (by pmbull.com).
We could be in a deep micro 2 (up) of subminuette 5 (down). Invalidation would be over 1102 (by pmbull.com).
Interesting: IMHO Gold price would need to be rejected from within 1093-98 range for a drop to take out 1082-81 holding with upside risk 1104-05 subject to a break above 1100-01… lets see… 🙂
Lara, could it be Micro wave 1 of V over, and Micro 2 getting resistance at maroon trend line seen on on hourly wave IV triangle?
If so then looking for micro 3 down??
Exactly.
is it 1-2 and 1-2 with overlap?
I sold half my DUST at $36.444 (bought 32.88 late Wednesday, took profits just in case as looked like gold would bounce up.
Looking to buy some more DUST back cheap for rest of the drop down today I hope.
Any wave count?
US Dollar is up today so puts down pressure on gold.
is it possible for the truncation to be higher then 1071???
if we went too low too fast on the previous breakdown???
hope not!!!
IMF have refused to support Greek bailout.
Hard to see a further $20 decline given this news.
News can be misleading because you do not know whether the market has already moved in anticipation of the news. More margin calls in China can move the market down independent of whatever happens in Greece.
Generally, Elliott Wave people do not give a lot of weight to news.
You’re right there. I give no weight to it at all.
According to Lara, we have to go below 1172.09 to avoid a truncation.
The fact that she said that implies that a truncation is possible, even if unlikely. So anyone who is short (or hoping to get long), needs to be alert for a truncation. That is why I am trying to find where Lara wrote her view on that.
Below 1072.09
Hi Fencepost – I have not been here long enough to know, sorry.
This move looks fairly strong, so I presume that implies a truncation?
It believe truncation may have been mentioned in the video last night.
Somewhere Lara wrote how we will know if there is a truncation. It has to do with a trendline break. Can anyone here point me to where she wrote that?
Daily trendline was mentioned in the video
It looks like at about 1195 AREA on the trend line now not exact as a guess.
I think gold just at 1095.51 at 10:30 am may be top of wave retrace?
Could gold continue down again quickly after this retrace?
Sorry trend line at about 1095 area, not possible to get exact number on daily chart.
TARGET 1071 or may not be low enough so maybe lower.
Where are we in the wave count at the mount?
Are we expecting 1170’s today?
Lara said in video her guess is 21 hours to the target (1171)
Remember it may go lower than 1171.
Thanks Richard – Just watched it again.
Would be great to see it sooner, my sell finger is twitchy!
Correction the target is not 1171 the target is 1071 or lower 1071 or lower.
We have to be alert for a truncation also.
I am thinking we are in submicro 5 (down) of micro 3 (down).
Hats off Lara, great job on analysis.
I must say it is difficult to trade Gold without a commodities account. Using the GLD ETF, all the action is happening in US cash market after hours. During US trading, Gold just flatlines. Frustrating but just an observation and probably obvious to the more experienced commodities / PM traders on this board.
I should get one of those. Do they allow 24 hour trading of Gold ETF’s like GDX, DUST, NUGT?
$USD may move down to the lower purple line of the triangle as gold moves up for Minuette 4.
Since point e of the triangle, we may have 1-2, 1-2, and we are now working on the first 4th wave.
I doubt that DUST or JDST will make new highs before gold turns back up for Minuette 4. This subminuette wave 5 down in gold is just too fast.
DUST may make a new high with RSI showing bearish divergence. It may not be too high above the previous but it may get to 40 at least.
Lara: Bravo!!!! Right on the mark. Flat wave count invalidated. Gold should see 1071 today. Congrats.
Best wave count!!!!
Todays report will have where counter trend rally will be so i can play NUGT for short time.
Thanks.
Lara said in Wed video the target may be met in 21 hours.
Dust peaked at $39.82 on July 24th when gold dropped to 5 year low of 1072.30.
It would be amazing if DUST reaches near $40.00 when gold is at 1071 area as Lara said the target may be lower than 1071.
Also, “But first, it has to make a new low below 1,072 to avoid a truncation.”
Hi Richard – Remember, when the markets opened Gold was 1115 rather than 1171 – I believe this is when DUST peaked.
Expecting a good trade in DUST today/ tomorrow.
Do you have a price target for JNUG?
July 24th
Gold opened 1089.50 DUST 37.94
Gold low 1072.30 DUST high 39.82
Gold High 1100.90 DUST low 32.20
Close Gold 1098.4 DUST 32.61
Richard
Sell DUST in the opening???? I may do that.
Gold was not at the low at market opening today so needs to go down and DUST needs to go up.
Gold just ‘invalidated’ the bullish wave count by dropping below 1,086.57 and provided confirmation to the bearish ‘triangle’ hourly wave count by dropping down to 1,086.19 at 2:20 am EST. I’m glad I bought DUST cheap before the close Wednesday. Target below is 1071 although Lara said the target may not be that short of a drop and her target may not be low enough. Gold already moved down to 1,084.43 at 2:22 am
Very very nice to see this downside happen…. delighted~! Lets see if a break below 1081 occurs – nothing really below that to hold gold price except way down to the lower band lol…. FABULOUS~!
This move is such good news. I might actually be able to get back in lower than I bought yesterday, we’ll see. Definitely lower than my sale Friday. Sure hope it turns out to be an extended 5th wave with low target.
I wouldn’t bet on that. The last two fourth wave triangles surprised all of us with a very short fifth wave to follow. Let’s not be surprised again.
If price breaks above the upper edge of the redrawn channel that’s most likely it for this fifth wave.
But first, it has to make a new low below 1,072 to avoid a truncation.
In TA of Price and volume the low made on the day of big drop with heavy volume gets tested. Many traders are waiting for the low to be testd.with low volume and close inside the trading range. That’s what the wave count is telling. It fits all.
Next is too test the top of that same big drop day at 1131.
May be gold will go there in wave iv.
Wait for your wave count once this wave is done. Thanks.
Gold dropped $10 since the close
Now at 1087.39 at 2:13 am EST.
Hopefully gold breaks below 1086.57 before the open then trades down slowly for hours after market open to pull down GDX and pump up DUST so I can sell DUST at high price and buy GDX and JNUG before gold retraces for 5 to 8 days in minuette wave (iv).
…. quite likely to test a break above 1101-02 for 1106…. upturn in MacdMA indicating a short term rally…. //// 1091-90 holding
Although I bot DUST and sold NUGT near close I agree with you that gold is very oversold and ready to rise tomorrow to test 1102-1105.
I will be surprised if gold drops below 1088.
Plus DUST has top HnS formation with a huge gap below near 28.
Good Morning Lara,
Oil seams to be correcting, any chance to see how high up this will be?
A shorter term chart would be highly appreciated.
Thank you very much for your excellent work.
Regards
Ursula
Sure, I’ll get to that later today and update the Oil analysis.
For now, I’ll say I would see this correction possibly as minuette (iv) within minute iii of minor 5. It should be over now, it can’t move into minuette (i) above 50.14.
It’s slightly breached the upper edge of the channel I have on the daily chart.
My only concern here is it’s coming on increasing volume. So if we see a new high above 50.14 then I’d expect intermediate (1) may even be over and Oil may be in a longer lasting second wave.
I’m sorry Ursula, I have not had the time to do Oil today.
I will get to it tomorrow, I promise!
I bought and sold DUST many times today. Also tried to catch the FOMC waves.
Wasn’t expecting such a wild day.
I lost $75 and ended up keeping some DUST at average cost $32.88.
Basically I averaged down by $2 a share.
Looking forward to Lara’s drop to $1,071 area and a champagne weekend.