
Last analysis expected upwards movement to continue, which it has, but the target at 1,141 was inadequate.
Price remains below the invalidation point. There still has been zero confirmation of an end to this upwards movement.
The wave count is changed.
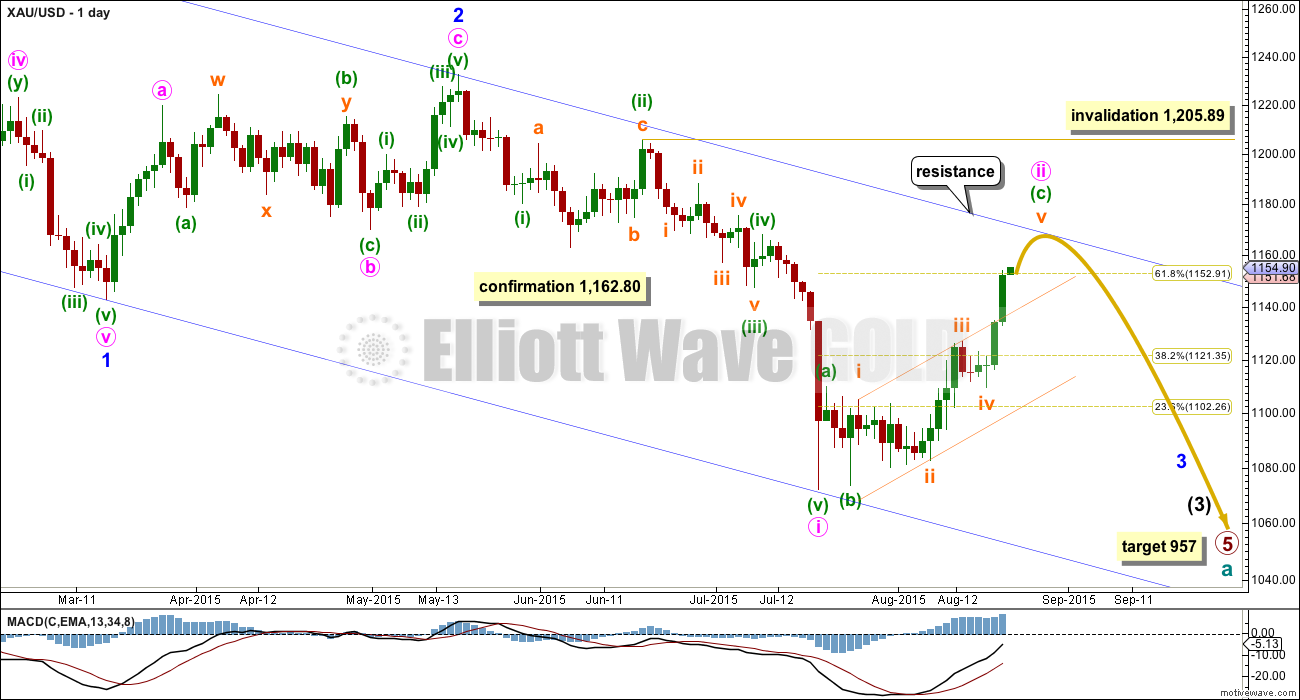
Summary: At the weekly chart level, primary wave 5 may not be seen as a complete structure as either an impulse or ending diagonal. The wave count still sees the longer term trend as down, and this upwards movement as a correction against the trend which may still be incomplete. The daily wave count is changed to see this upwards movement as minute wave ii not iv, and so the invalidation point is changed to 1,205.89. A target for it to end is at 1,164 – 1,168. At this stage, upwards movement may be expected to continue while price remains above the channel on the hourly chart. Points for confirmation are provided with analysis of the hourly chart below. Confirmation is essential before any confidence may be had that this upwards movement is over.
To see weekly charts and analysis click here.
Changes to last analysis are bold.
ELLIOTT WAVE COUNT
Click chart to enlarge.
Cycle wave a is an incomplete impulse.
Within primary wave 5, the daily chart focuses on the middle of intermediate wave (3). Within intermediate wave (3), minor wave 3 now shows a slight increase in momentum beyond that seen for the end of minor wave 1 at the left of the chart. Third waves for Gold usually have clearly stronger momentum than its first waves, so I still expect to see a further increase in downwards momentum. The strongest downwards movement is still ahead of us. That may now show up for minute wave iii, the middle of intermediate wave (3). Within minute wave iii, it will most likely be the fifth wave which exhibits the strongest momentum.
Today the wave count is changed. Yesterday’s main wave count is now an alternate. This upwards movement may be minute wave ii. Of all the ideas I have tried today, at this stage, this one has the best look and the best proportion. The blue channel is a base channel about minor waves 1 and 2. Minute wave ii, a lower degree second wave, should not breach the base channel drawn about a first and second wave one or more degrees higher.
Ratios within minute wave i are: minuette wave (iii) has no adequate Fibonacci ratio to minuette wave (i) and minuette wave (v) is just 0.97 longer than 1.618 the length of minuette wave (iii).
When minute wave iii arrives, then it should have the power to break below support at the lower edge of the base channel.
Minute wave ii may not move beyond the start of minute wave i above 1,205.89. A new high above 1,162.80 would invalidate the alternate (which was the main wave count up until yesterday) and provide some confirmation of this wave count.
Minute wave ii is a flat correction. Minuette wave (c) must be a five wave structure; it is unfolding as an impulse.
At 957 primary wave 5 would reach equality in length with primary wave 1.
Click chart to enlarge.
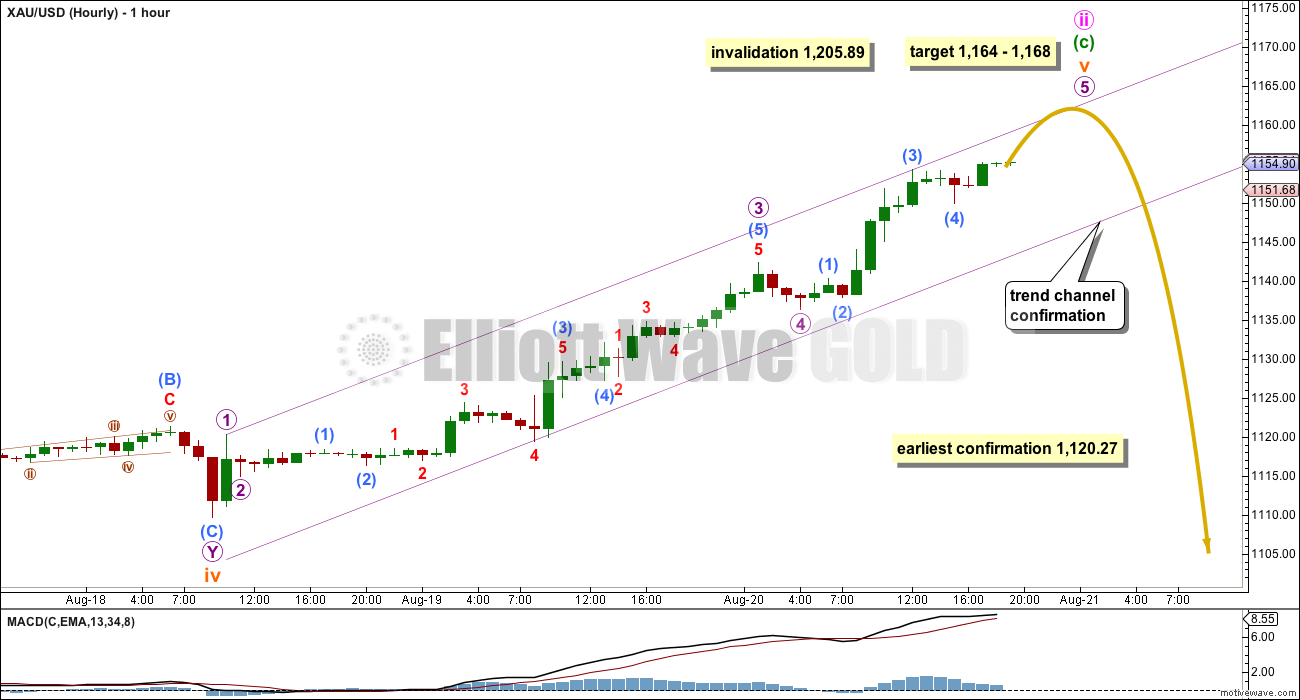
The structure and degree of labelling for the hourly chart remains exactly the same as yesterday. The difference is this upwards movement is seen as a second wave rather than a fourth wave correction, so the invalidation point is higher.
Within minuette wave (c), there is no Fibonacci ratio between subminuette waves i and iii, which makes it more likely that subminuette wave v will exhibit a Fibonacci ratio to either or i or iii. At 1,168 subminuette wave v would reach 1.618 the length of subminuette wave i. This target may now bring price up to touch the upper edge of the blue base channel on the daily chart.
Within subminuette wave v, micro wave 3 is just 0.46 short of 2.618 the length of micro wave 1. At 1,164 micro wave 5 would reach equality in length with micro wave 3. This gives a $4 target zone calculated at two wave degrees.
Confirmation that minute wave ii is over will come with the following. Depending upon your risk appetite, you may wish to wait for one or more of the below points to be met before you have confidence that the downwards trend has resumed. Picking a high is not advised; confirmation at some level is wise:
1. A breach of the best fit violet channel on this hourly chart by downwards (not sideways) movement.
2. A clear five wave structure down at the hourly chart level (no lower time frame here should be used).
3. A new low below 1,120.27. At that stage, downwards movement could not be a fourth wave correction within subminuette wave v, so subminuette wave v would have to be over.
4. A red daily candlestick with increased volume.
While there is zero confirmation of any trend change, it should be expected that price will continue to rise.
FIRST ALTERNATE ELLIOTT WAVE COUNT
Click chart to enlarge.
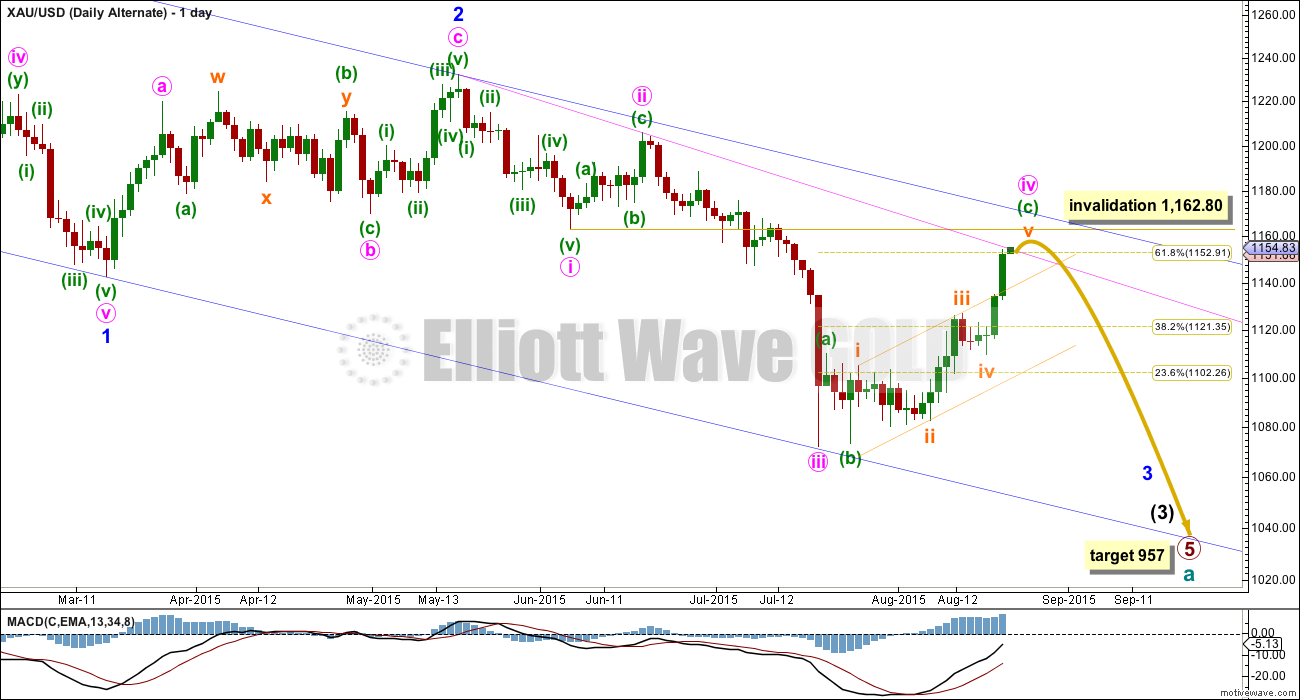
Up to yesterday this was the main wave count. It now looks wrong.
Minute wave ii was a deep 0.618 single zigzag. Minute wave iv is now also deep, close to the 0.618 Fibonacci ratio. There is no alternation in depth between these corrections, which reduces the probability of this wave count.
Minute wave ii lasted nine days. Minute wave iv is now in its 24th day. There is poor proportion between them further reducing the probability of this wave count.
Minute wave iv may not move into minute wave i price territory above 1,162.80.
The bigger picture for both wave counts remains the same.
SECOND ALTERNATE ELLIOTT WAVE COUNT
Click chart to enlarge.
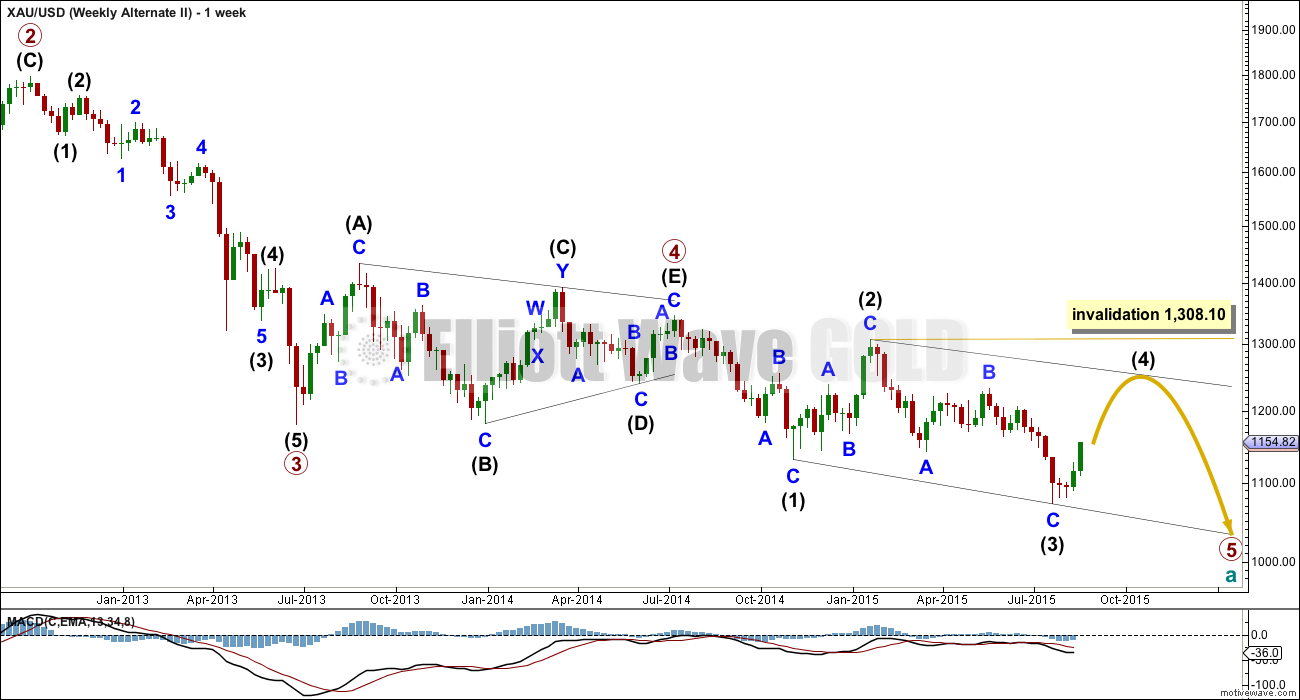
There are a couple of things at the weekly chart level to draw attention to, which I think should be base lines for any wave count for Gold.
Primary wave 2 was a deep 0.68 running flat lasting 52 weeks, three short of a Fibonacci 55. Although it is a rare running flat, the subdivisions are perfect and the truncation is small. It allows primary wave 1 to be an obvious impulse; seeing primary wave 1 as over anywhere else is highly problematic.
Primary wave 3 was 12.54 short of 1.618 the length of primary wave 1.
Primary wave 4 was a shallow 0.268 regular contracting triangle lasting 54 weeks, just one short of a Fibonacci 55. Within primary wave 4, the subdivisions are all perfect right down to the five minute chart level. There is perfect alternation between primary waves 2 and 4 and almost perfect proportion.
I do not want to consider a wave count which ignores these obvious structures and relationships.
This means that primary wave 5 begins at the end of the triangle. It is obvious that downwards movement from that point cannot be a complete five wave structure; it will fit neither as a complete impulse nor a diagonal.
The main wave count sees primary wave 5 subdividing as an impulse, the more likely structure. The other possibility is an ending diagonal. An ending diagonal requires all sub waves to be zigzags. This alternate looks at that possibility.
The problem is the zigzag of intermediate wave (2). That problem is outlined below.
Click chart to enlarge.
This problem also would exist for any idea which sees this upwards wave as a part of an ending diagonal for primary wave 5, whether it begins as I have it labelled on the weekly chart above or if it begins earlier (and you lose the triangle for primary wave 4).
An ending diagonal must see all the sub waves as zigzags. The fourth wave must overlap first wave price territory.
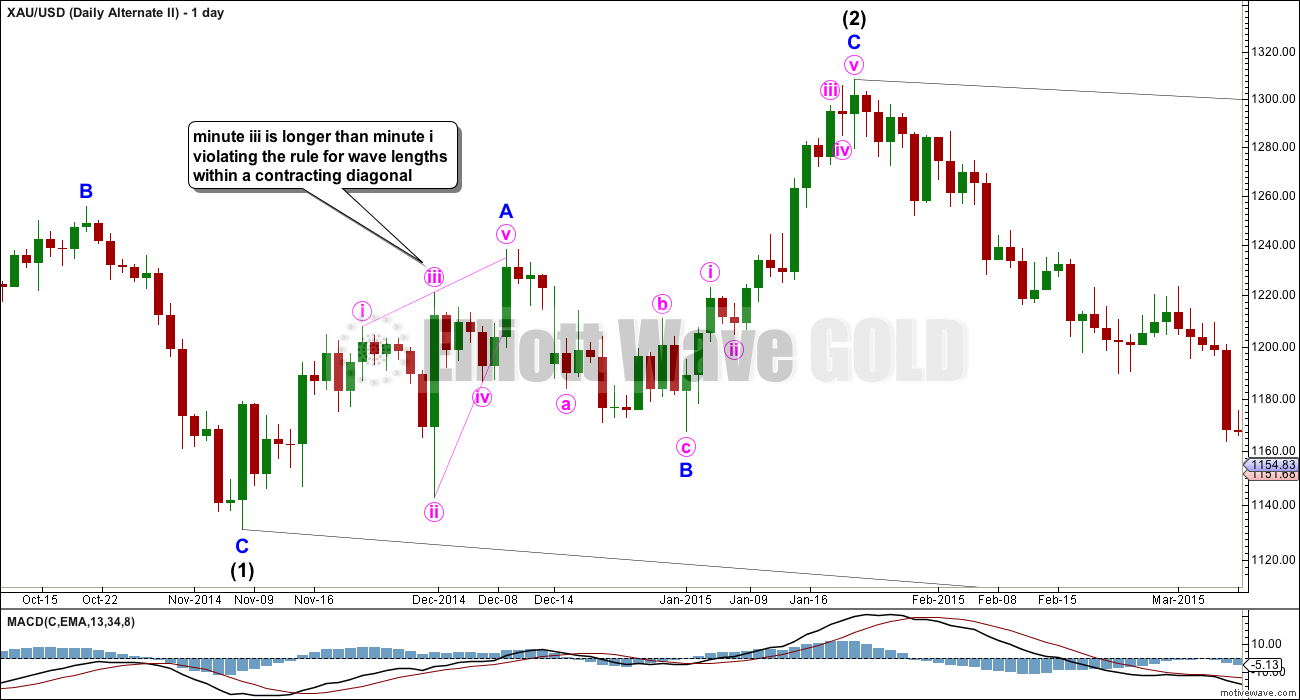
This upwards movement does have a cursory look as a three wave zigzag. The problem is within minor wave A.
Minor wave A will not fit as a completed impulse, because there is too much overlapping. Within the contracting diagonal, minute wave i is 76.86 in length and minute wave iii is 78.46 in length. The third wave is longer than the first violating the rule for a third wave within a contracting diagonal (the rule states it should be shorter). This is an invalid wave count.
I do not wish to rewrite the rules as given in Frost and Prechter; if so, that way I would expect leads to something that is not Elliott wave. If we start to do that, then we may as well give up the whole exercise.
Click chart to enlarge.
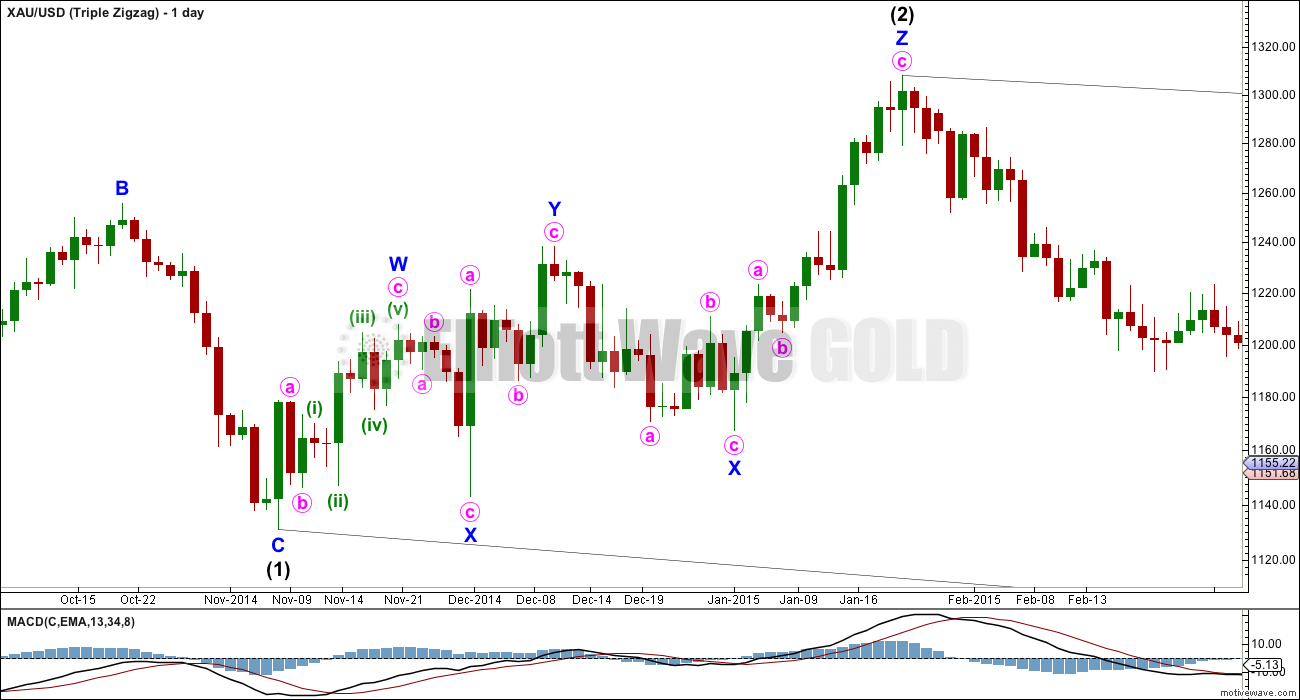
There is only one other possibility which could redeem this wave count. A double or triple zigzag may take the place of a single zigzag as per the rules in Frost and Prechter. If it is accepted that this can occur within a diagonal, then this upwards movement may be labelled as a triple zigzag, but they are very rare. In this instance, the second zigzag would not substantially move above the end of the first, and the second X wave is very deep overlapping back into the first zigzag.
This does not violate any rules, the subdivisions do fit, but it looks very wrong indeed. I have seen three very rare triple zigzags on Gold in the last several years, and they do not look like this. The purpose of repeated zigzags in a multiple is to deepen the correction when the first zigzag (and the second) does not move price deep enough. To achieve that purpose the X waves within multiple zigzags are shallow and the whole movement has a clear slope against the prevailing trend.
This possible triple zigzag does not fit the definition of how a triple zigzag should behave.
The main wave count sees this upwards wave as an ending expanding diagonal. The subdivisions are the same (all zigzags), but the look is right and it is a much more common structure. It must be accepted that any wave count with rare structures that don’t have the “right look” should not be considered over and above any wave count which has much more common structures and does have the right look.
TECHNICAL ANALYSIS
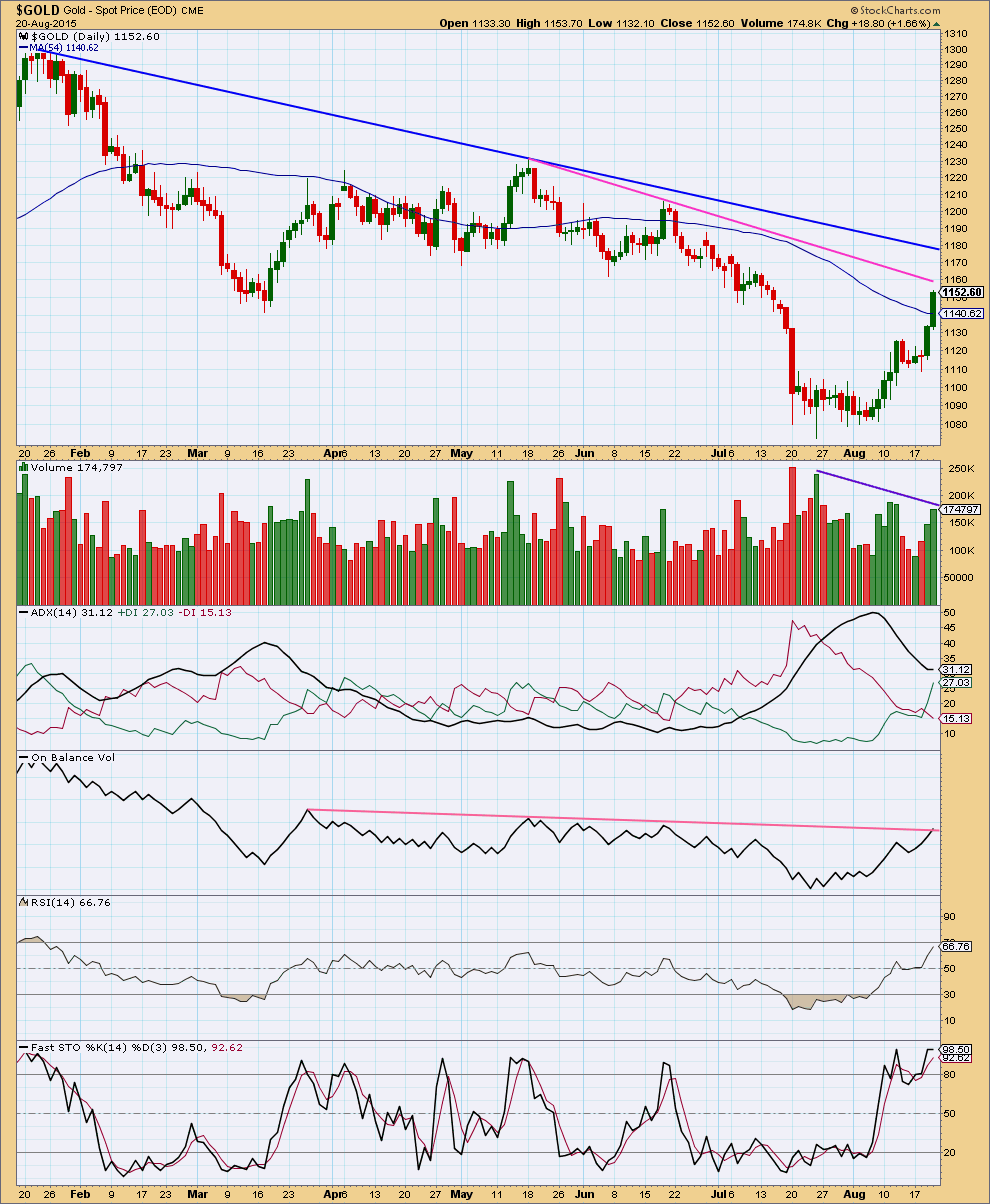
Click chart to enlarge. Chart courtesy of StockCharts.com.
Volume has increased again today, above the prior upwards day. This rise in price is supported by volume.
However, overall during this movement volume continues to decline (as shown by the sloping line on volume). This indicates that this movement is a consolidation and not a new trend.
ADX still does not indicate a new trend; it indicates the market is consolidating. However, ADX is a lagging indicator. Today it is flat, not declining. If the black ADX line turns up, then a new upwards trend would be indicated.
On Balance Volume has come up to touch its trend line. This may provide resistance.
RSI is getting closer to overbought but its not there yet. There is still some room for the price to move higher.
Fast Stochastics is overbought. But while price has made new highs, Stochastics is flat and not making new highs. There is a little bearish divergence there.
This analysis is published about 08:57 p.m. EST.
papudi,
It looks like I was way off on my prediction of the COT report. The COT report is supportive of Lara’s bullish scenario, especially the small specs dumping a lot of longs.
Gold price facing strong support at 1149 with feeble resistance at 1161-63…. With price remaining above the upper band, remains to be seen if it can make it to and past 20week moving average 1174-75; a break below 1156-51 is required…. I guess one will just have to wait and see how this pans out; a top cant be far off~!
Short term: the new wave count will expect a minor degree fourth wave should begin about here.
The wave count in this analysis is now an alternate. It expects a big middle of a third wave down to begin from here.
The price point to differentiate will be 1,119.23 (taken now from the hourly chart, more accurate than 1,110). The third wave should slice through this. But a fourth wave correction may not move below this point. It should be choppy and overlapping and take a few days to a couple of weeks.
I have a new wave count. I know this is going to upset many members, but I cannot hold onto being bullish or bearish as an ideology, I have to find the right wave count.
I have been concerned that volume is at least partially supporting this rise in price. It indicates a new upwards trend. ADX may confirm that today.
Short term we will still have corrections against the trend and they may offer opportunities to exit shorts.
I would also remind members again that trying to pick highs and lows is one route to wiping out your account. That way you will experience too many losses. That is why I provide confirmation price points and channels. For confirmation.
Waiting for confirmation is the safest route. Risk management is the difference between profit and loss.
This wave count is very bullish. It would be confirmed above 1,232.49. It would be invalidated below 1,110.01.
It resolves several problems:
1. The stock market has changed from bull to bear and will remain bearish for some time I expect. While stocks fall Gold may rise, at least for a while.
2. Volume supports this idea.
3. The proportions within the waves of primary A and primary B, particularly that time consuming intermediate (B) within primary B, now make so much more sense.
4. The breaches of the big maroon channel about cycle a make sense.
Lara, talk about a Blockbuster forecast to end the week. WOW!
I think some here today were mentioning this kind of possibility.
After kicking myself for not buying DUST today I am glad I didn’t as this forecast is a complete game changer.
I appreciate your honestly at all times even if it hurts sometimes.
Thank you for that.
I’m really looking forward to your full analysis.
The bigger picture at super cycle degree is still bearish.
There is a five down complete for cycle a, and now we have a big expanded flat for cycle b on this wave count.
When it’s done then cycle c down should be another big five down.
Short term price is finding resistance, there’s a long upper shadow on today’s candlestick, so short term I’d expect a small correction about here.
The blue channel will remain the same and the upper edge is today almost touched.
i hope you ll keep the main wave count
Yes of course, but it must be an alternate.
Regular technical analysis, particularly volume, looks too bullish at this stage for me to hold onto a bear wave count as a main wave count.
And I’ll use price points and trend lines to tell us which one is correct.
Price is the ultimate determinator.
Gold Optimism Growing As Main Street, Wall Street Majority See Higher Prices Next Week
By Neils Christensen Friday August 21, 2015 12:38
http://www.kitco.com/news/2015-08-21/Gold-Optimism-Growing-As-Main-Street-Wall-Street-Majority-See-Higher-Prices-Next-Week.html
Profit taking from miners today even as gold goes up with DUST going up as well same time a clear indication GDX peaked today.
US dollar down, gold up since yesterday close.
However still no confirmation that minute wave ii gold movement up has ended.
Not sure I follow you?
DUST/JDST have daily bullish engulfing candle.
Looks like miners and gold have different mind today. DUST going up relentlessly, while gold doesn’t budge? Really strange.
Don’t forget that Miners are STOCKS…..when the stock market moves big time PM stocks go with the tide…and when margin calls are made, the fringe holdings for most large porfolios, like PM stocks, are the first ones jettisoned.
Nice that we’re getting a doji today. That gives us a pause to think over the weekend. Volume is likely going to be lower today.
I do not like doji. Often times they appear at half way. Hope it turns out to be a reversal candle.
Its a 61.8 retracement in weekly chart where doji is forming…
Doji at resistance
StockCharts don’t give data for today until NY closes.
FXCM data shows another rise in volume. Five days in a row, green candlesticks and higher volume. That’s really bullish.
There are some fundamentals to lookout for
Chance of war between North and South Korea.
Dollar is selling on concerns that FED will not hike rate as expected in September.
Gold is acting as safe heaven demand..
Also stock market dropping pushed up gold.
Stock selloff accelerates on global growth fears.
http://www.marketwatch.com/story/stocks-eye-a-reprieve-despite-mortal-blow-from-chinese-data-2015-08-21
S&P Index suffers worst weekly selloff since May 2012.
Wonder how the safe haven factor of gold will play out over today and the weekend into next week.
Zero confirmation that gold uptrend is over.
DUST remains in question.
this right?
Your wave (5) does not go as far as your wave (3) which means you have a (low probability) truncation. It is difficult to see how we would have a 5-th wave truncation at the start of what we expect to be a powerful move.
The open question in my mind is whether we are still in a complex wave (4). I note it has not invaded wave (1) territory.
Thank you. Yes, maybe we complicate 4.
This is how I was counting as well, except that I stopped at 3. I agree that a truncation here is improbable.
Perhaps someone else sees a 5 down within your first 3 down. However, I don’t like that idea because it is not clear on an hourly chart.
Perhaps there was a 3 down for a 4th wave correction. From there this may be the middle of an ending expanding diagonal for the final 5th wave up. Waves 1 and 2 of 5 would be complete. 2 was a typical deep correction and 3 is underway. This may bring gold to a peak at or near the 200 day moving average. This is just a guess.
Thank you. I’ll wait for the kit.
200 day moving average for gold is 1,186.83
http://stockcharts.com/h-sc/ui?s=%24gold
That could spook DUST buyers.
Where’s a clear down trend when you need one? LOL
Could be series of 1-2 starting in a third wave (but we will not know for a while). Agree with the others that truncated 5 looks odd.
that’s how i have it at the moment. It’s either that or this is a fourth wave correction with more downwards movement to come before a new local high. Not sure which is more probable. Miner action supports high is in, dollar chart not so much yet.
The fifth wave is truncated and the fourth wave may also be seen as a five, not a three.
Which means this movement may be a small correction against an upwards trend.
Price is still within that channel on the hourly chart. We still have zero confirmation this upwards movement is over.
Since I am in a small DUST position my research finds only “short” stories today…
Here’s one…
GDX high W3 down starts on May 14 @ 21.25.
GDX low W3 down ends on Aug 5 @ 13.01.
38.2 retrace is at 16.16Today’s high for GDX was………………………..TADDUMM!!!! …..16.16…
and looking like a reversal engulfing candle day…
…and 38.2% is most commonly found in…W4.
Here’s another story….
Average combined daily Dollar volume of trading for GDX, GDXJ, ABX, NEM and GG is around….$1.75b per day..and that’s just maybe 1/3 of all mining share volume.
While this is not up to AAPL’s levels it’s got it’s own critical mass…
The average daily trading Dollar volume for GLD is $600m..
The question then becomes…what is driving what?
Is $600m telling $1.75b (or maybe $5b) what to do…or does the PM stock market drive bullion price?
Anyway,,,things that make you go hmmmm….
For me a new GDX top above 16.16 is my exit for DUST…
A new low Monday in GDX below 15.32 and I ‘ll probably add more DUST.
Happy trading to all…
and to Lara….thanks for all your excellent work…
it’s probably a good weekend to try some other waves and hang ten.
http://www.surf-forecast.com/countries/New-Zealand/breaks
Ted sounds like a good game plan you have with set buy and sell targets.
Thanks Richard…
the game plan is more driven by money management.
The price points are convenient.
The price point exit (stop loss) is roughly where I would risk more than 2 % of capital on that first trade.
However, if it goes into profits I move the stop to breakeven on Monday.
Next step is to add another DUST position and set a new 2% risk stop loss…etc etc..
A most excellent strategy!
That way even when (not if, when) I’m wrong you’ll live to trade another day.
Thanks Lara…have a great morning and a good weekend.
Tham thinks 1149.38 may be first 5 down for subminuette wave i of minute 3.
I think retrace .618 gives 1161.13 possible target.
Did breach happen yet?
A breach of the best fit violet channel on this hourly chart by downwards, not sideways movement.
Confirmation that minute wave ii up is over will come with one or more of the following. 1. A breach of the best fit violet channel on this hourly chart by downwards, not sideways movement. 2. A clear five wave structure down at the hourly chart level (no lower time frame here should be used).
Looks like a 3 to me on the hourly chart.
Yes it does look like a 3 wave on hourly. Darn was wanting a 5 wave on the hourly chart as Lara’s 1st confirmation minute wave ii up is over.
1-2 1-2 is not out of the question
Not sure what it is? A hotel? A trip?
Stock market is dropping which send gold up and oil is dropping which sends gold down. Mixed signals
11:32a
Friday stock selloff accelerates on global growth fears
11:31a
Dec. gold gains $3.80, or 0.3%, to $1,157/oz on Comex
11:16a
Oct. oil down $1, or 2.4%, at $40.32/bbl on Nymex
11:16a
Nymex oil loses more ground, falls toward session lows
The dollar has been falling like a rock for 3 days now, because of the lowered expectation of a September rate hike. This is what has fueled gold’s surge.
Some thoughts/comments:
Subscribers to this site have been through a similar scenario where the expected outcome did not occur, but the general trend was correct. A good example was when gold went to 1307 in January and subsequently collapsed. The idea was that gold should stay below a line that Lara had drawn. When that was surpassed, many all of a sudden turned bullish. The general down trend was absolutely correct – gold just went higher than (we) expected before dropping again. Nonetheless, the move to 1307 brought about the introduction of a new bull wave count. I honestly always skipped over that part of the analysis – no offense Lara. 🙂 Here we are again repeating history.
Long term bear markets do not end abruptly. Instead they completely exhaust any last hopes that a bull could have and then they take a while to recover.
As for the current short term correction, it makes sense that it would go this high (and may even go slightly higher) because the mood was so overly bearish with hordes of traders convinced that gold is going straight to 1000 right now. While I do believe that gold will go to <1000 – for one, because many want it to happen – it won't be a straight and quick line. We're in the zone of the final $200 or so of this gold bear and it is going to be volatile and last longer than most realize.
Gold is in a multiyear bear market that is far from over and Lara is doing a wonderful job of navigating us through it. Don't get sidetracked with any bullish thoughts. Gold hasn't even reached its 200 day moving average! Wake up and take advantage of these higher prices.
Thanks Matt, well thought out as always. It’s hard to take the emotion out of trading
A while back I suspected that bullish talk would occur with the first significant bounce after gold gets in to the 1000s. Sure enough that is what is occurring here. It came sooner than I thought. I estimated that it would come around September, which is historically a strong month for gold. I also figured that this September could be extra turbulent because it is the month of the most consequential FOMC meeting in the last decade.
and I’m still going to hold onto my wave count as presented today, but as an alternate.
The new wave count expects Gold to go up to $1,400, but primary C only needs to move above 1,308.10 to avoid a truncation. Once it’s done that it may end.
I’d expect primary C to last about 34 weeks in total. So far it’s had 4 weeks, so another 30 to go.
If we get a new high above 1,232.49 I’ll have to discard any short term bear wave count.
Gold is just inches away from its first 5 down…..
Matt- nice thought above.
Can elaborate more on wave 5 down???
So far it is a 3 on my screen. Tham observed a 5 – see below.
perhaps it’s 1-2 1-2 so far
From 1168 high gold just retraced 55%.
1168-1148=20
1159=1148=11
11/20= 55%
If you take 1168.40 as the end of Minute 2, then the drop to 1149.38 is the first wave down. At the moment it is to early to tell which degree it is, but probably it is subminuette 1 of Minute 3.
It doesn’t look like a 5 to me. So far, it is a 3.
I should add that we may have a discrepancy in price again. That 5th wave is truncated on my screen.
DUST already up $2.60 since day low
PMbull is not connecting!!!!!
http://www.pmbull.com just worked on my desktop now at 9:57 am
Thanks It came back. I am lost w/o PMB
Lara, could the first alternate still be in play but as an ending diagonal?
I was considering that too. Anytime a 4th wave moves into 1st wave territory, this is my first instinct.
My issue here is that this diagonal would be occurring within a 3rd wave. I am not certain, but I believe that diagonals only show up in 1st and 5th waves.
no because this is a third wave which may only be an impulse
Just to give everyone a heads up, this will be the very bullish count Lara will be posting this weekend. This is from Daneric who is not very accurate, but has been running with this count for awhile. More than one EW analyst I follow has been running with this count for awhile. This sees gold going to $1425+. It looks like Intermediate i of Primary C topped at $1168 several hrs ago. Intermediate ii now underway.
Lara when you posted your main count, it did not have the right look to me. Waves ii & iv looked out of proportion so this count does correct that problem.
Daneric’s count is exactly what I thought of after reading Lara’s comment below. The thing is, I have presented that count on one or two previous dates and Lara has been pretty adamant that it is invalid. Will be interesting to see her “new” bullish count and if it is the same as Danerics.
You can see my last post of this chart and Lara’s comment here:
http://elliottwavegold.com/2015/07/gold-elliott-wave-technical-analysis-8th-july-2015/
Their degree of labeling will not match, but the point is the same in that we are in a large degree C wave.
Where is wave c target to end???
Could you mention the EW analysts that you follow?
I had suggested last week (the 13th I think) something very similar. Basically that cycle a was over and that we were in a huge expanded flat now. It was rejected I think because of the movement out of the big triangle that could not be seen as a five. I have to go back and double check that but I think that was Lara’s main concern with it
Sorry, it was the 12th
http://elliottwavegold.com/2015/08/gold-elliott-wave-technical-analysis-12th-august-2015/#more-15282
However, and i could be wrong about this, Lara’s historical charts seem to have the movement down from the triangle as a 5 in the bullish alternative, so even though that was the discussion there, the problem is that the movement out of the end of what would be cycle wave a, the first A wave, can reasonably only be seen as a 5. The same issue she discussed today, and the first wave of an expanding flat needs to be a 3. So i think it all comes down to that movement. But looking forward to seeing what she has for a bullish alternative
It was, but I failed to consider that primary 5 ended higher and this downwards movement has been a B wave within a flat correction.
I see that now, yes. Well that was a tough one to call. It does indeed make sense though. I still expect downwards movement early next week and if so, I won’t press it too far as it would be a corrective move, and will assume trend is up for now.
I don’t believe that the end of a multiyear bear market would be followed by an expanded flat. IMO this is a stretch.
It’s still part of a bear market. It’s the big cycle wave b within a larger zigzag down.
When cycle b is over then cycle c down should unfold. And that should take price down to new lows below 1,000.
Not quite, but close.
Major Cycle low predicted for late 2016.
http://www.gold-eagle.com/article/gold-price-forecast-gold-won’t-bottom-until-next-year-2016
If gold continues to down and closes down gold will put in some kind of powerful reversal candle with low volume. It will be sweet (for shorts like me) if closes below yesterday’s high.
A reversal candle: gravestone doji, dark cloud, inverted hammer etc.
Gold is already down $15.36 from 1168.40 high.
We may trend channel confirmation today.
1. A (FULL HOUR) breach of the best fit violet channel on this hourly chart by downwards (not sideways) movement.
Cant say what the best fit channel is, but I would look for a break below $1147 to target 50dma and possibly lower!
We got Hourly Reversal
We got 4h Reversal bearish Engulfing candle
We are getting gravestone doji in Daily. Reversal at the top.
Unless weekly closing is not above 1168 we can get lows..
Breaking below 1150 opens 1140.
and trend support at the moment is at 1110
If gold heads back below 1149 over the next few hours, we will have a confirmed 5 wave structure down and the bear is alive and well. If this is to happen, and we didn’t just see a simple 3 wave correction, it should likely materialize today.
I’ve got my dust position at 19.75 avg. picked up my last smal lot at $19 this morning.
Can you pin point where the price ls currently on the channel. Gold is 1149?
Lara has these channels lines extended to the right which helps us locate the price.
I think channel support is about at 1152.
Following bearish engulfing rule.. The price normally moves back half normally to the enfulfing candle. so the Reversal will be in play unless price moves above 1168.
so expecting a move back to 1161-1162 and then break down again..
Lets see what happen then
If this Reversal stays then I am sure first target will be 1135 area.. and below that 1105 area.. will be second target..
Thanks. I can not wait to see the COT report today.
Expecting huge increase in commercial shorts. I am looking at the shorts only.
Sir MTI you are talking my language- Candlesticks reversals.
I only work with candle sticks technical analysis.
with macd and bollinger band indicators
same as i expected..
i expect a move to 1161, and then i said it will break down. So far that’s what is happening.
For some reason, intuition maybe, I still don’t think this is the right count.
Lara, what are the chances that this upward correction is actually INTERMEDIATE 4, rather than MINUTE 2? Upon on this main count, will gold still end up bottoming in mid 900s? Don’t look too reasonable that the bottom hasn´t changed considering this change in the main count. Time will tell I guess.
The only way this move up could be Intermediate 4 would be the “second alternate” shown above since we are already in Intermediate 1 territory.
And Lara already ruled out the Second alternate wave count.
I have been concerned too. Mostly it’s volume.
I am working on a new wave count. It’s very bullish. It resolves a few problems.
It would be confirmed above 1,205.89. The target would be 1,400. I’ll be ready to present that tomorrow.
It would see cycle b already underway and in primary C up.
To the downside it would be invalidated below 1,110.01.
I’m looking forward to seeing this, but I thought this was already ruled out?
Hi Lara,
Surely the start of Minute 1 in the main count is around 12430/40 not 1205?
nick, your right. Minute wave i starts at 1,232.49 not 1,205.
Lara had that on her July 16th and below analysis.
1,232.49 would be the invalidation point for minute wave ii?
Yes, you’re right!
My mistake.
Oil prices under pressure in Asia after weak Chinese manufacturing data
Aug 21, 2015 1:08 a.m. ET
http://www.marketwatch.com/story/oil-prices-under-pressure-in-asia-after-weak-chinese-manufacturing-data-2015-08-21?mod=MW_story_latest_news
Gold tends to follow oil, so oil down, gold down.
lets hope,… I hate it when they change the wave count from short to long or vice versa
In case anyone is watching, GDX OPEX sweet spot is about $15, and GLD is about $110 for tomorrow.
Matt,
How about July 23rd, 2013….looks similar to where we are right now.
Or maybe 3rd week of August 2011.
Hello everybody, today is as good as any for me to jump in here. This has been my primary since half way through intermediate 2 except today I changed intermediate 2 from an expanded flat to that ugly zig zag. That makes it legal but I still like the flat
1185.44 is a first target for intermediate 4 to end and 1213.46 is the next
Data is scraped from http://www.investing.com/commodities/gold-historical-data
Hi Edward, welcome.
A couple of things about your wave count I notice:
1. A leading diagonal may not have a truncated fifth wave, that violates a rule.
2. Yes, all waves within an ending diagonal must be zigzags, no other three will do, so that second wave you have labelled as a flat violates the rule.
So we’re back to seeing a second wave zigzag within your ending diagonal as I’ve outlined in this analysis. And as you can see, that’s a problem. The subdivisions don’t fit and meet the rules for a single zigzag and if it’s a triple it looks wrong.
Hi Lara, thanks for the critique. I am aware that I deviate from the rules sometimes, usually because of suspect data. But I wonder sometimes what the probability is that every rule has been found. Anyway checking back just now, that truncated fifth has disappeared, five exceeds it’s three by a few dollars today, duh. It seems that data stability has been a problem for a while. I always thought it was an accounting error anyway.
I posted it after seeing your new weekly count this morning thinking you might want to play with it some. o7
The rules in Frost and Prechter do have to be always met, every single time.
Otherwise what you’re doing isn’t Elliott wave.
I am not prepared to rewrite the rules in Frost and Prechter. And they are black and white.
Lara, what about a triangle? Use the intermediate 1 that I like and also my favoured minor A but put minor B ending Jan 2 at the start of the minor C wave rally, which is the kind of impulse you’d expect after a triangle. Motivewave lets me put a reasonable running triangle in there for the minor B, at least its not as ugly, right up to the point where the E wave drops below the C wave. Maybe a different data set would show something nicer.
Gold price has quite eloquently tagged past 100dma… For me the line in the sand for keeping it short is as long as 200dma ($1187-86) is not taken out… Looks like this time around, with small downside corrections on the way up, Gold price will not stop there…. What a crying shame, hope Gold price rise does get curtailed earlier and we do get to see the much awaited downturn…. Just when will this top~!! Grrr…. This has been quite a fabulous turnaround by Gold price from low 1080’s…. Good luck folks.
Looks like alternate is officially invalidated.
WOW Gold already up as high as 1,168. Maybe the correction will start tomorrow?
If the main count is correct, I think the current movement puts us in minuscule 4 so far, with minuscule 5 to go, so maybe a reversal overnight.
We shall see. S&P just turned up, dollar at support, Euro at resistance….this could be everything reversing or everything breaking out.
Lara, March 2013 I began looking for a way to make money trading in gold.
June 2013 I found your gold analysis and I read a silver analysis of yours that happened just as you said it would. That really surprised me as all the other gold and silver forecasters were just vague or incorrect or not accurate enough to trade with.
I have been a daily subscriber since then and would not trade in gold without your service. I even signed up with EWI Elliott Wave International for 18 months for a second opinion about gold during the same time I signed up with you and I ended up cancelling with them as they were not detailed or accurate enough to trade with.
When I found the best (you) I wasn’t satisfied with the rest. I am thankful for your service everyday even on the days when it doesn’t happen as you forecast because you are the best at getting the gold forecast back on track. I also know that gold is such a wild and unpredictable precious metal that only a very select few in the world do well in forecasting gold.
Thank you very much Richard.
Lara, what do you think was missing that could be put into place that might catch an alternate like this in the future? It seems like one possibility could be in considering moving up or moving down a degree or two. Any other thoughts?
As I think back over the past couple of months considering this new count that was missed, maybe it was when the analysis was getting into pico and nano counts that were lasting days instead of minutes.
As I look to your chart, which I realize is broad, Minuette and Subminuette waves seem to actually be lasting days, and micro are lasting hours. I am wondering if the anticipation of strong moves might be contributing to a false sense of speed of those moves. For myself, I have adjusted my time duration expectation of the counts of each of the degrees which is what has kept me watching the move up through today in this c wave (the table on the upper left has this degree targeted for hours when in this instance it actually lasted many days).
Maybe there are no good answers yet, but I wanted to ask the question to see what considerations there may be. You have set the bar very high with your EW expertise that is second to none, so you are likely already thinking about this.
Great video tonight. Have a great weekend everyone.
I’d like to add that I am not criticizing. I can tell that you are committed to excellence and I will be here for a long time to come, so in a way we experienced all of this as a community, and maybe we can use what we learned about what we missed to notice something in the future.
I agree, when I get down to pico and nano something is off and I need to take more time to find an alternate.
When the triangle for the fourth wave was invalidated that was when I needed to look for a better alternate.
How could I have spotted this one before it showed itself? I don’t really have a good answer to that. Hindsight is 20/20 and once you have it it’s hard to recall what it was like before you got it.
If that makes any sense.
But I also have to point out that the FXCM volume data really put me off back on 23rd July. For over a week it was a down day which had strongest volume… and then the data changed and it was an upwards day which had strongest volume.
I rely on volume data heavily. When data changes like that it changes the outlook substantially. It’s impossible to do good analysis with unreliable data.
I noticed StockCharts data today changed after the close; before there was a huge spike (someone else noticed this) and now it’s gone.
I can only hope that StockCharts data is reliable. I’ll be watching it closely. They’re heavily used by professionals so I expect with close scrutiny they’re staying honest.
That’s right, the volume data was throwing us off….
Well it looks like we should be just about have this wave done if it is the right count.
Heading to bed. Good night!
Lara, thanks for the time you invested in the new wave counts today. While today was likely a frustrating day for all, we now have options to consider until the situation becomes clearer. It is always amazing to see how you are able to rework and make sense of the movement when most (or all) are stumped. You are the best EW analyst and that’s why we are all here!
Lara I could not have said it better. Excellent work. It is amazing how you resolve the ever changing price movement and come up with new wave counts.
I am glad to be here.
Thank you very much guys for your sticking power.
And yeah, it was a huge day!
Dreamer thanks for the amazing 6 month gold chart you posted at 7 pm on yesterday’s Lara analysis Aug 19th. I wanted to mention it because many may not have seen it and it is very helpful understanding gold highs and lows.
You’re welcome.