
Last analysis expected a red candlestick for Friday, which is what happened.
Both bull and bear Elliott wave counts remain valid.
Summary: The bear wave count now expects a third wave down is developing. The bull wave count expects a B wave down. A new low below 1,098.85 would invalidate the bull and confirm the bear. If upwards movement continues, a new high above 1,170.19 would invalidate the bear and confirm the bull. Upwards movement should continue to find strong resistance about the upper blue trend line.
Changes to last analysis are bold.
To see the bigger picture on weekly charts click here.
BEAR ELLIOTT WAVE COUNT
Click chart to enlarge.
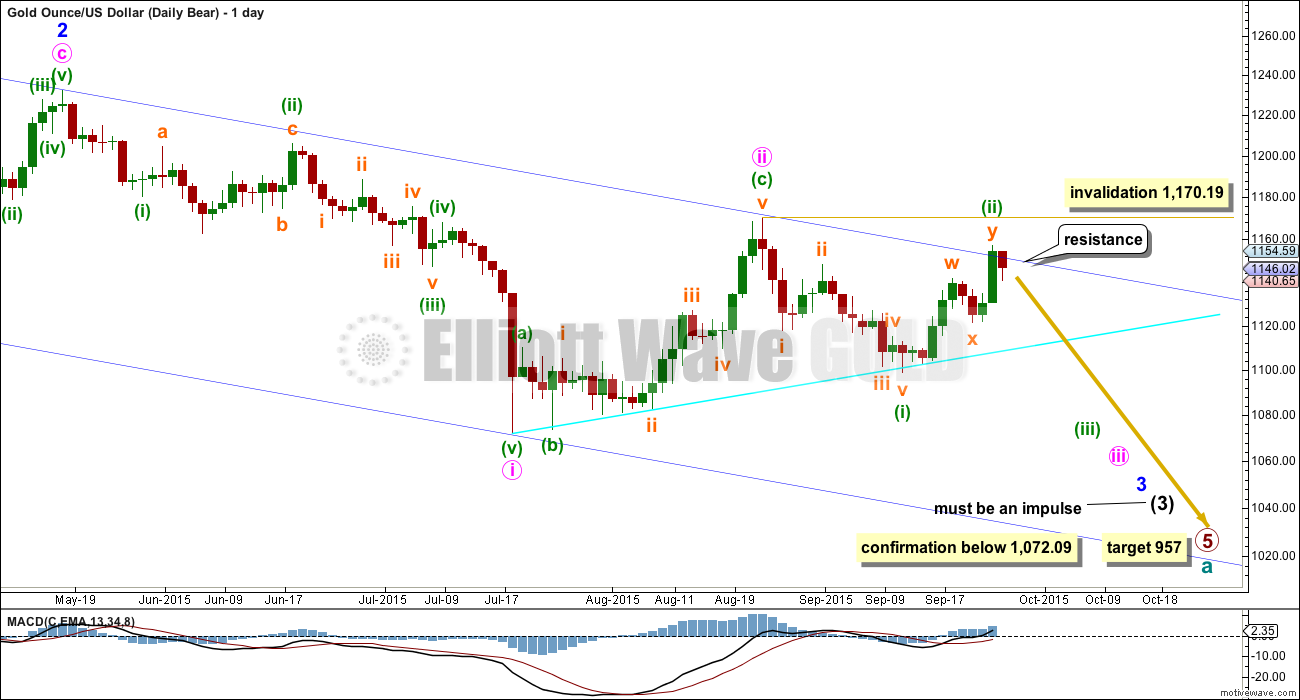
Gold has been in a bear market since September 2011. There has not yet been confirmation of a change from bear to bull, and so at this stage any bull wave count would be trying to pick a low which is not advised. Price remains below the 200 day moving average and below the blue trend line (copied over from the weekly chart). The bear market should be expected to be intact until we have technical confirmation of a big trend change.
This wave count now sees a series of four overlapping first and second waves: intermediate waves (1) and (2), minor waves 1 and 2, minute waves i and ii, and now minuette waves (i) and (ii). Minute wave iii should show a strong increase in downwards momentum beyond that seen for minute wave i. If price moves higher, then it should find very strong resistance at the blue trend line. If that line is breached, then a bear wave count should be discarded.
The blue channel is drawn in the same way on both wave counts. The upper edge will be critical. Here the blue channel is a base channel drawn about minor waves 1 and 2. A lower degree second wave correction should not breach a base channel drawn about a first and second wave one or more degrees higher. If this blue line is breached by one full daily candlestick above it and not touching it, then this wave count will substantially reduce in probability.
Minuette wave (ii) may not move beyond the start of minuette wave (i) above 1,170.19. A breach of that price point should see this wave count discarded as it would also now necessitate a clear breach of the blue channel and the maroon channel from the weekly chart.
Downwards movement from 1,170.19 will subdivide as a complete five wave impulse on the hourly chart, but on the daily chart it does not have a clear five wave look. Subminuette wave iii has disproportionate second and fourth waves within it giving this movement a three wave look on the daily chart.
At the end of this week, there is another problem for the bear wave count on the daily chart. Minuette wave (ii) will subdivide as a double zigzag, but it has a five wave look on the daily chart, not a three. Both the wave down labelled minuette wave (i) and the wave up labelled minuette wave (ii) have a better fit and look for the bull wave count than the bear at the daily chart level.
Gold has the most textbook looking structures and waves of all the markets I have analysed over the years, probably due to the high volume of this global market. And so I am quite concerned at the end of this week with the look of minuette waves (i) and (ii). Sometimes Gold has movements which don’t look perfect on the daily chart, but this is uncommon.
Sometimes Gold’s impulse waves start out slowly. There is a good example on this daily chart for minute wave i. When the fifth wave approaches that is when momentum sharply increases, and it often ends on a price shock with a volume spike. This is an even more common tendency for Gold’s third wave impulses. The strongest downwards movement is ahead, and it should be expected to arrive when subminuette wave v within minuette wave (iii) begins.
Full and final confirmation of this wave count would come with a new low below 1,072.09.
If primary wave 5 reaches equality with primary wave 1, then it would end at 957. With three big overlapping first and second waves, now this target may not be low enough.

Click chart to enlarge.
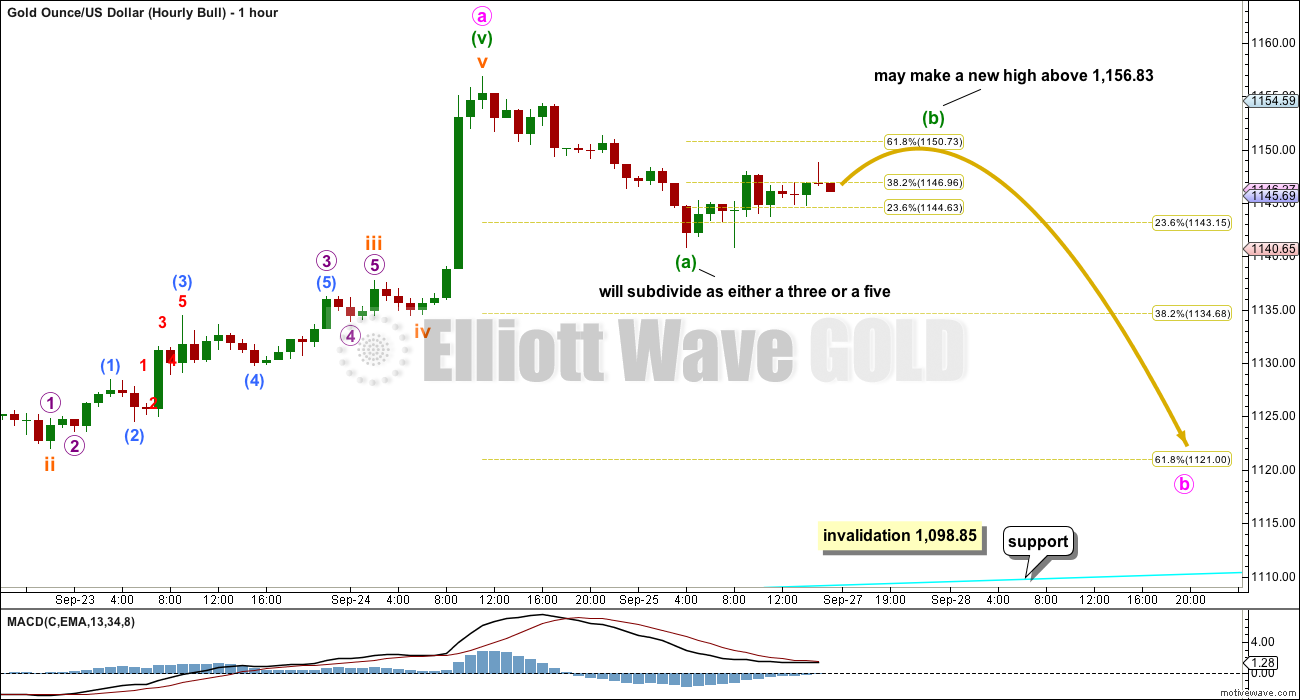
The downwards movement from the end of minuette wave (ii) has breached the best fit channel drawn about subminuette wave y. The breach is enough to provide some confirmation that prior upwards movement is over and the next wave down is underway.
On the five minute chart, micro wave 1 will subdivide as an impulse or a zigzag. This may be the first wave of a leading diagonal for subminuette wave i or an impulse for subminuette wave i. For both possibilities, micro wave 2 may not move beyond the start of micro wave 1 above 1,156.83.
Micro wave 2 will subdivide as a double combination. The structure may be complete and may be finding resistance about the upper blue trend line copied over from the daily chart.
This bear wave count expects it is most likely we shall see a red candlestick for Monday, and downwards momentum should show some increase.
At 1,041 minuette wave (iii) would reach 1.618 the length of minuette wave (i). This target is still several days away, maybe a couple of weeks.
BULL ELLIOTT WAVE COUNT
Click chart to enlarge.
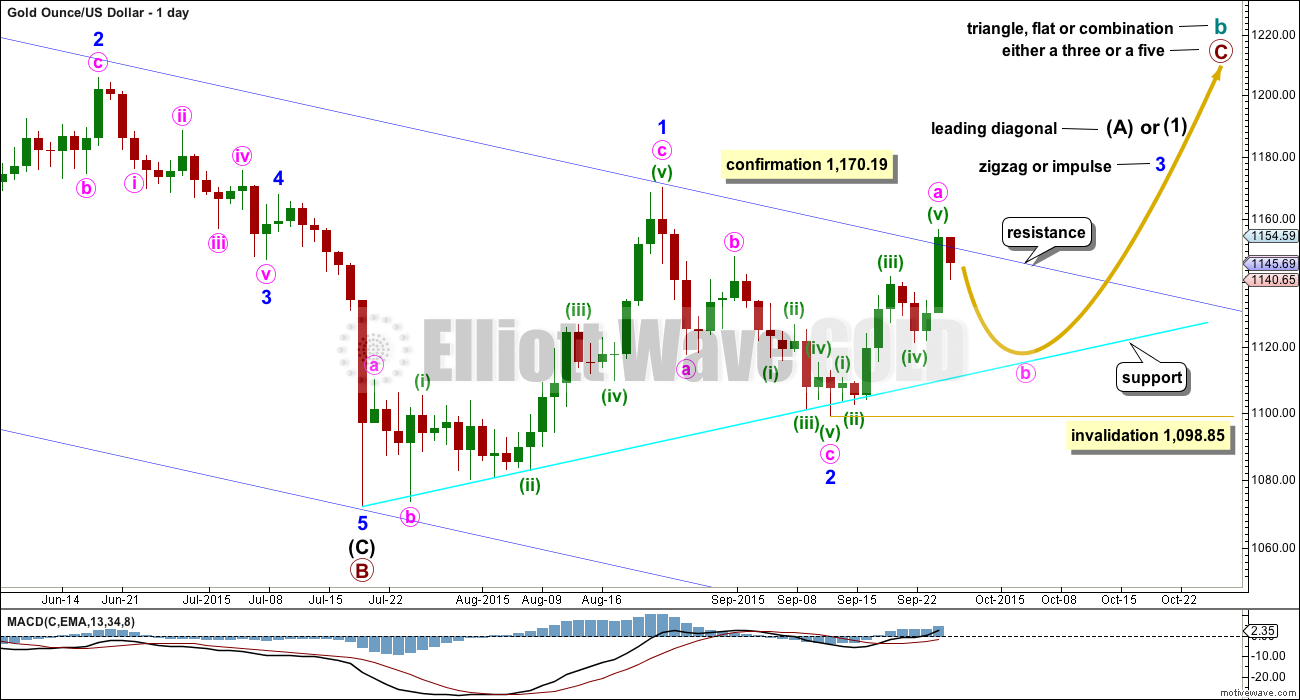
The bull wave count sees cycle wave a complete and cycle wave b underway as either an expanded flat, running triangle or combination. This daily chart works for all three ideas at the weekly chart level.
For all three ideas, a five up should unfold at the daily chart level for a movement at primary degree. This is so far incomplete. With the first wave up being a complete zigzag the only structure left now for intermediate wave (1) or (A) would be a leading diagonal. While leading diagonals are not rare they are not very common either. This reduces the probability of this bull wave count.
A leading diagonal requires the second and fourth waves to subdivide as zigzags. The first, third and fifth waves are most commonly zigzags, the but sometimes may appear to be impulses. So far minor wave 1 fits well as a zigzag.
To the upside, a new high above 1,170.19 would invalidate the bear wave count and provide strong confirmation for this bull wave count.
Upwards movement is finding resistance at the upper edge of the blue channel and may continue to do so. Use that trend line for resistance, and if it is breached, then expect a throwback to find support there.
I added a bright aqua blue trend line to this chart. Price has found support there and is bouncing up.
Minor wave 2 can now be seen as a complete zigzag. It is 0.73 the depth of minor wave 1, nicely within the normal range of between 0.66 to 0.81 for a second wave within a diagonal.
Third waves within leading diagonals are most commonly zigzags, but sometimes they may be impulses. Minor wave 3 should show some increase in upwards momentum beyond that seen for minor wave 1. Minor wave 3 must move above the end of minor wave 1 above 1,170.19. That would provide price confirmation of the bull wave count and invalidation of the bear.
There now looks like a five up on the daily chart within minor wave 3. This may be minute wave a within a zigzag, or it may also be minute wave i within an impulse. The five up may be seen as complete at this stage, so a three down would be expected for this bull wave count. Minute wave b may not move beyond the start of minute wave a below 1,098.85. Minute wave b may find support at the lower bright aqua blue trend line, if it gets down that low.
Click chart to enlarge.
Downwards movement for Friday may be minuette wave (a) within minute wave b.
Minute wave b may subdivide as one of 23 possible structures. It is still not possible to tell which one it will be, and so for this bull wave count it is not possible to say what pathway minute wave b will take with any confidence whatsoever.
If minute wave b unfolds as a flat, combination or triangle, then it may be choppy and overlapping.
Minute wave b may be a swift sharp zigzag which could be over with one more down day on Monday. That is less likely though.
B waves are the hardest of all Elliott wave structures to analyse. Low degree B waves do not offer good trading opportunities because price becomes congested and whipsaws from resistance to support and back while they unfold.
On the five minute chart, minuette wave (a) will subdivide as either a five wave impulse (with quick shallow fourth waves after an extended fifth wave within it) or a zigzag. This means that all 23 possible options remain open for minute wave b.
If minute wave b is a combination, expanded flat or running triangle, then within it minuette wave (b) may move beyond the start of minuette wave (a) at 1,156.83. There is no upper invalidation point for this wave count for that reason.
I would expect minute wave b to be a clear three wave structure, for it to have a typical look on the daily chart. So I would expect minuette wave (b) to show up as a green candlestick or doji for Monday’s session.
TECHNICAL ANALYSIS
Click chart to enlarge. Chart courtesy of StockCharts.com.
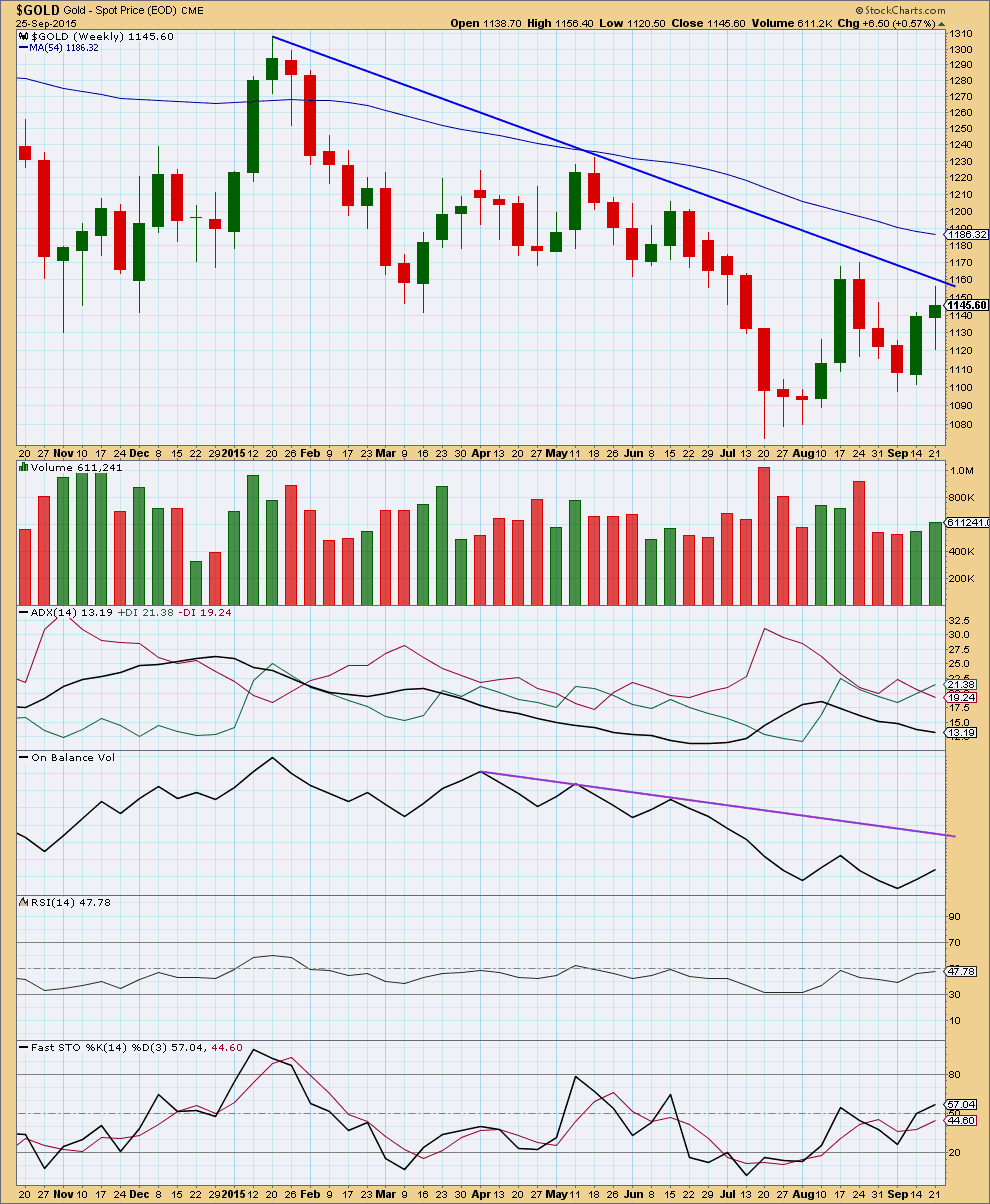
Weekly: Price has again found strong resistance at the downwards sloping blue trend line. The strength of this line is reinforced each time it is tested.
ADX indicates Gold has been in a consolidation phase during the last seven weeks. A downwards week which has strongest volume during this time indicates that a downwards breakout may be more likely. This favours the bear wave count.
At the weekly chart level, ADX still indicates Gold remains within a consolidation phase. The market is range bound.
Both RSI and Stochastics are neither oversold nor overbought. There is room for the market to either rise or fall.
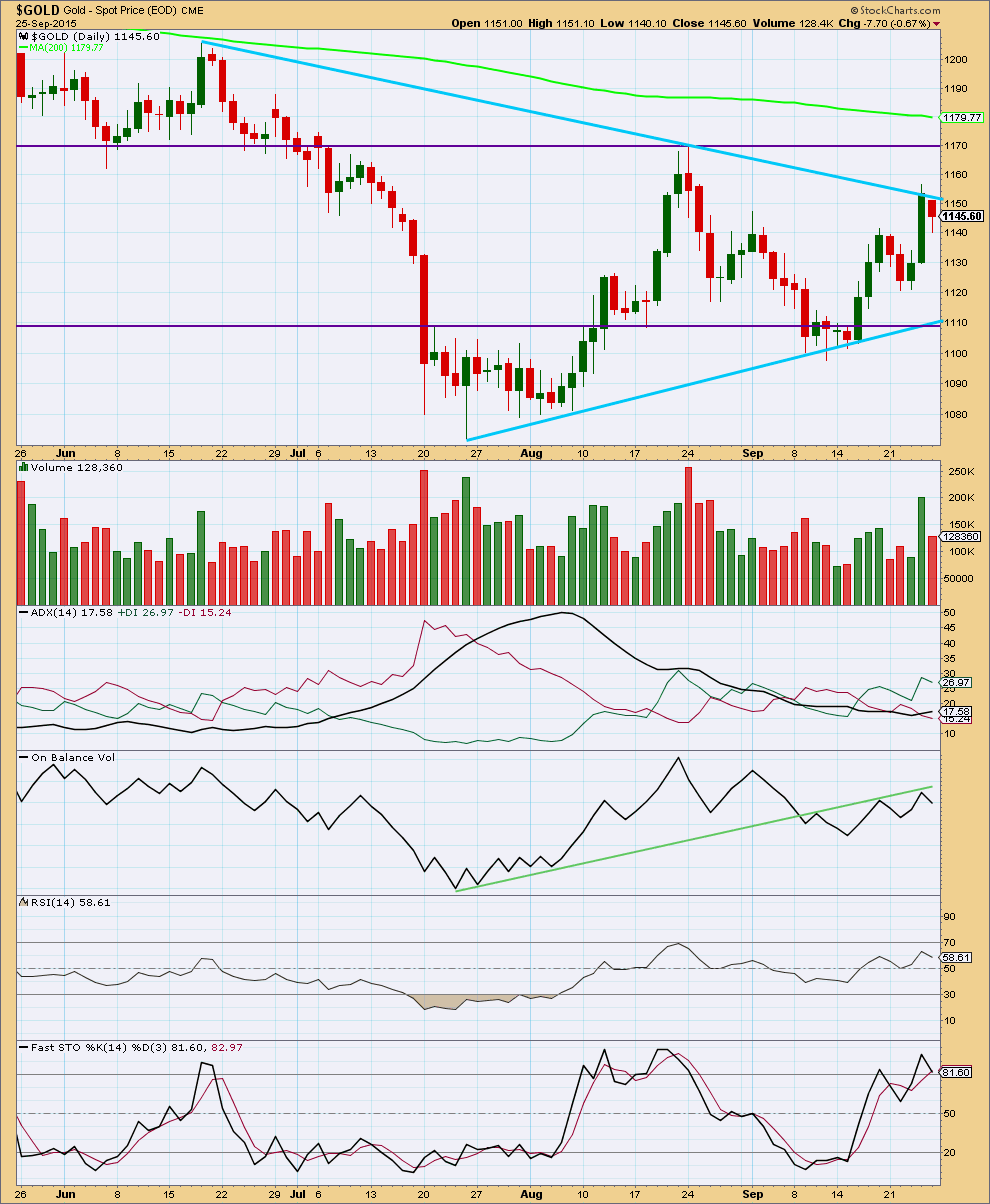
Click chart to enlarge. Chart courtesy of StockCharts.com.
Daily: Friday’s downwards day comes on volume which is higher than the last four days, bar one: the volume spike for the end of the prior wave. This is slightly bearish, so there was some support for the fall in price.
Gold does tend to have volume spikes at the end of its waves. This looks like what happened for Thursday.
ADX has been indicating for 35 days now that the market is range bound and not trending. The black ADX line is consistently moving lower. During this consolidation, it is a downwards day which has strongest volume and a downwards week which has strongest volume. Volume indicates that a downwards breakout is more likely than upwards.
At the end of this week, the black ADX line is starting to point up indicating the market may be beginning to trend again. However, ADX is below 20, so this is a weak indication. If the market is beginning to trend, it should be an upwards trend because the green +DX line is above the red -DX line. At this time, because volume contradicts ADX, I would rather wait until ADX is above 20 before relying on a new trend being indicated.
Price is being squeezed between the two blue sloping lines of resistance and support. The breakout comes closer as the consolidation matures and those lines converge. The market will begin to trend again, of that we may be sure.
A range bound system is outlined here using lines on price for resistance and support in conjunction with Stochastics to indicate overbought / oversold. Price reached resistance on Thursday and Stochastics reached overbought. This approach now expects a downwards swing to continue until price reaches support and Stochastics reaches oversold. During range bound markets, price does not move from resistance to support in straight lines but most often moves in a choppy and overlapping manner. Price may also overshoot resistance and support before one swing ends and the next begins. This is why trading a range bound market is very risky and best left to the most experienced traders. Stops and good money management are essential to ensure that losses are minimized because of whipsaws during a range bound market.
RSI at the daily chart level is neither overbought or oversold. There is room for the market to rise or fall.
Overall, at this stage, volume analysis indicates the bear wave count may be more likely than the bull.
This analysis is published about 07:12 p.m. EST.
Today’s analysis will see a 5-3-5 now complete down for bull and bear. And the two counts will again diverge.
The bull will see this as a minute wave b complete, somewhat likely. Although this could be just wave A of a triangle or wave A of a time consuming flat for minute b.
The bear will see it as 1-2-3. Wave 4 may not move into wave 1 price territory above 1,140.86. Short term a new high above that point would favour the bull over the bear.
If tomorrow continues downwards movement that shall favour the bear over the bull.
What happens this week may give us clarity. And I hope it does!
Technical Trading: The Key To Success: Know Your Market Environment
Monday September 28, 2015 11:10
http://www.kitco.com/news/2015-09-28/Technical-Trading-The-Key-To-Success-Know-Your-Market-Environment.html
I would say the drop to 1128.12 has completed Minute B for the bull count. It is also micro 3 of subminuette 1 of the bear count.
Price rose to 1136.97 and is now dropping again. This drop is critical. If it can drop BELOW 1128.12 (for bear micro 5), then the bear count has the greater probability. If it cannot drop below 1128.12, then I’m afraid that the bull rules.
Comments are most welcome.
I agree wholeheartedly. However, this 4th wave (bear) may still go on for a few hours and should not go higher than 1136.97.
Interestingly, if micro 5 is equal in length to micro 1, it may end around 1121.
Any wave counts?
Did we just get a 5 wave down to 1128.12 at 8:50 am?
Bull was a few days down to 1121 so may be a big retrace up in either bull or bear before 1121?
Looks like micro 2 (bear) or Minuette b (bull) morphed into a triple combination with a triangle at the end. Even with the sharp move down to 1,136, gold is not ready to show it’s hand. I think we move down to the bottom aqua blue trend line around 1,120 in a 5 wave structure, then the next bounce will hopefully help clarify the direction. An eventual break of the converging trend lines should start the next big move.
COT Data and Gold forecast:
This chart is very clear for short term action of gold whenever Commercial shorts position changes : Comments are marked ullish/bearish when shorts shrunks/increase by significant amount.
Gold just dropped $10 from 2 to 3 am down to $1,136.18 at 2:57 am.
Looks like bearish hourly chart is playing out with downward momentum showing some increase. Looks like Lara’s red candlestick for Monday may likely happen.
Bull count may also drop to 1121 at 0.618 retrace, so there is no confirmation. Both are equally likely at this point in time.
I thought Bull count had to start going up to 1151 to 1156.83 or above not fast down. Yes none are invalidated yet.
It went up to 1148.76 then decided to drop.
IMHO Gold price is bottomy for the week, short term bullish looking to rally / short term up move to occur… Taken from various High / Lows, Gold price has not yet been able to effectively break below 50% retrace ranging between 1135-1121 and has more or less been putting in higher lows since the 1098-97 low… Currently bottomy at 1143-40 with a break below here unlikely to reach 1135-33… Advantage bulls, to go long on the drops until topping is confirmed…. //// Personally with upside risk 1162-1180, I would like to see Gold price break below 1050, doesn’t seem to be shaping up just yet, dang maybe the blood moon will change something lol…. 🙂
I believe you more this week. Gold is holding up too well right now. It is acting more like there will be one last burst up.
The blood moon was rather uneventful in the sky above Los Angeles.
Hi Matt: Some things change with time lol… Now that Gold price has made a low of 1131-30 and if can be contained under 1139 with 100dma (1147-49) on the outside, then would expect price to test a break below 20dma (1126)…. Lets see…. //// A break of August H 1169 / L 1080 range is still required (inside month)….
Gold daily HnS and bullish channel. Friday N was backtested the BO.
Veru critical week ahead for gold???
Matt
Revised gold chart.
Matt
Gold daily without the EW method. The resistance line is above.
Thanks, Papudi. I appreciate it.
Matt
Attached is daily gold from 2011 top showing lara’s bear EW counts and the trend line as per EW method.
Forgetting about EW, for just one moment, where does the line extend if you contain the entire downward movement? You are connecting the bottom of primary 1 and 3, which is correct by EW standards but throws of the grade that I am talking about. If you wouldn’t mind, please remove the lower parallel bar and change the angle of the upper line to contain all movement over the last few years. Thanks.
You can leave a lower parallel bar, which rests on the bottom of primary 3 only (not primary 1), as long as you change the angle of the upper line to sit on the Jan 2015 high.
Just to play devil’s advocate (to my own thinking), could someone here, who is also curious, please check where the resistance trendline is right now if connecting the end of primary 2 and the end of intermediate 2 of primary 5 (Jan 2015 high). The reason I chose these two points is because they contain this entire bear market in gold.
I realize that I am straying from this EW analysis, but it has kind of always bothered me that there was a spillover allowed on the weekly chart (break of the maroon channel). Forgetting for a moment that this spillover was ruled the first sign of the bear being incorrect, it seems that gold could move as high as the extended trendline that I mention above and a downtrend would still be intact.
In theory, this may seem like I am just raising the bar. However, remember that gold made a new multiyear low in July. This means that the downtrend is very much alive. A simple trendline in a downtrend should connect the 2 upper points which contain the entire movement down. Once that line has been broken to the upside, the downtrend would officially be over. So my question here is where exactly is that line today?
I am seeing two different numbers, depending on which chart I’m using. One shows that gold is at that trendline now and the other shows a figure closer to 1200. What do the rest of you see?
Thanks.
Actually that higher figure would actually be slightly lower than 1200 by the time that the market gets there, should this actually occur, and time wise may take 2 weeks.
This is an alternate idea that I am considering if gold does not break down now. In fact, if gold gets anywhere near the invalidation point on today’s hourly bear, it most certainly will rise another $30-40. IF that happened, I will be backing up the truck to load up on short positions like never before!
If a trend line is drawn from primary 2 to intermediate (2) it has not been subsequently touched.
The first breach should have indicated a trend change. As you note, price made a subsequent low. Price is the ultimate determinator.
Sometimes those channels just don’t work perfectly.
I attach my chart with your trend line drawn in bright aqua blue.
EW channels, as I have learned from you, are drawn connecting the ends of waves 1 and 3 with a copy on 2. Alternatively, depending on the circumstances, the ends of 2 and 4 can be used as well.
In this instance, because primary 4 ends as a triangle, there is no opportunity to do that. This means that we have to keep the channel that we have. Just doesn’t look as clean when there are overshoots.
Thanks, Lara.
It’s not often that you see an attempt at an EW count for over two centuries, so I thought I would post this. Not sure about the credibility of the author. He thinks the ultimate low for the correction may not be until 2020, which does seem possible. No short term details though. http://goldtadise.com/?p=351923
Lara, any thoughts?
Dreamer,
Did you checkout Lara’ gran super cycle Elliott Wave analysis?????
http://elliottwavegold.com/2015/05/gold-elliott-wave-technical-analysis-grand-supercycle-8th-may-2015/
Let us know what is the difference between the two???
Rambus site is open to public now.
Here’s Lara’s (bottom) chart and the other for easy comparison. Some similarity and plenty of differences. They do agree that we are currently in a very large 4th wave correction that will likely take years more to complete. Although the other analysis goes back further, I’m sure Lara’s is more accurate.
I would really have to look at historic data back to the 1600’s to have an opinion on that count.
The only thing I can say is both this count and mine agree that the current correction is incomplete, and only within wave A.
There is a good chance from candlestick chart pattern the red candle on Friday indicates gold will go higher. A large green candle and small red candle with low volume. The low volume should have taken out the high from the previous day. This red candle is half way point.??? May be.
Like Lara wrote it is a very critical price point here for gold to decide between turn to bull or continue the bear trend????
Commercial short positions increased by 18,353.