
Downwards movement to a slight new low still fits the Elliott wave count.
Summary: On balance, I would expect one or maybe two more days of sideways movement. A green candlestick or doji for Thursday’s session is expected. There is a slim outside possibility that the correction is over already. A new low below 1,075.31 would provide confirmation of this idea.
To see weekly charts click here.
New updates to this analysis are in bold.
BEAR ELLIOTT WAVE COUNT
Click chart to enlarge.
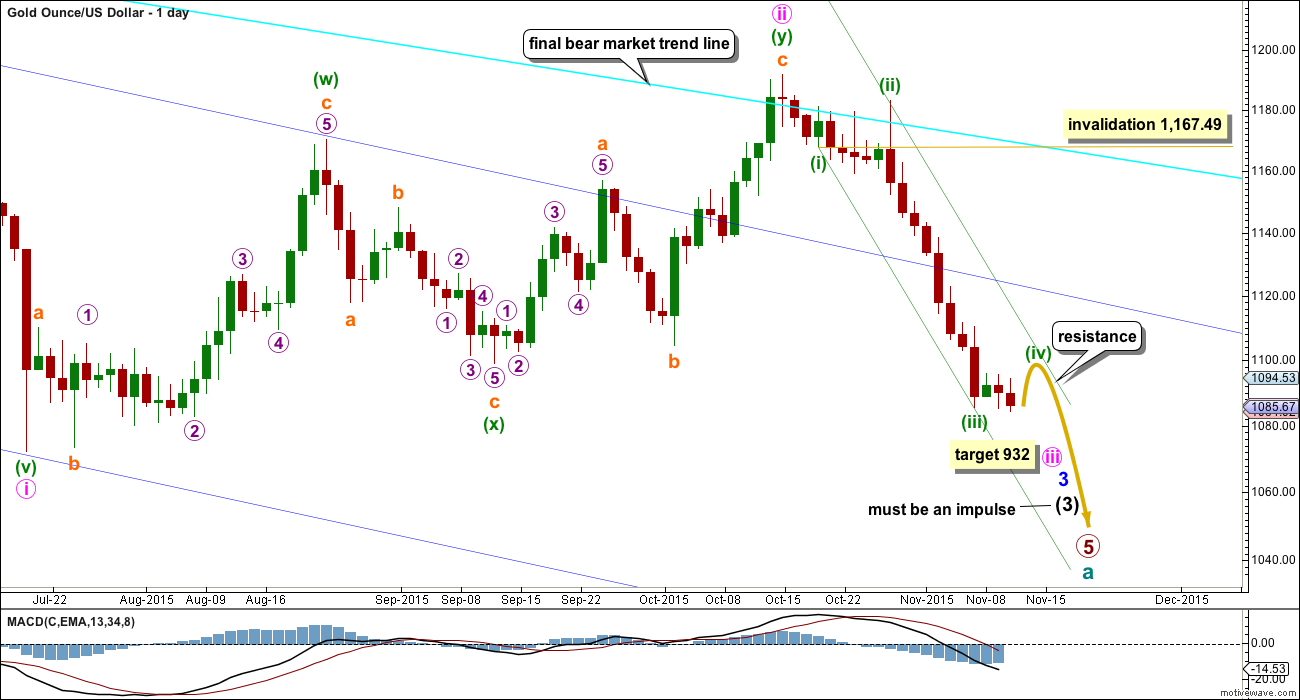
Gold has been in a bear market since September 2011. There has not yet been confirmation of a change from bear to bull. Price remains below the 200 day moving average and below the final bear market trend line (copied over from the weekly chart). The bear market should be expected to be intact until we have technical confirmation of a big trend change. At this stage, all bull wave counts have been invalidated. This is the only wave count left.
The final line of resistance (bright aqua blue line copied over from weekly charts) is only overshot and not so far properly breached. While this line is not breached the bear wave count will remain possible. Simple is best, and the simplest method to confirm a trend change is a trend line.
Minute wave ii is a complete double zigzag and deep at 0.75 the length of minute wave i. It has breached the dark blue base channel drawn about minor waves 1 and 2, one degree higher. When a lower degree second wave correction does this it reduces the probability of the wave count but does not invalidate it. Base channels most often work to show where following corrections find support or resistance, but not always.
At 932 minute wave iii would reach 1.618 the length of minute wave i.
Gold often exhibits swift strong fifth waves, particularly its fifth waves within its third waves. When price moves towards subminuette wave v of minuette wave (iii) it may be explosive. For this wave count look out for surprises to be to the downside.
At 1,080 minuette wave (iii) would reach 4.236 the length of minuette wave (i).
Draw a channel about this downwards movement using Elliott’s first technique: draw the first trend line from the end of minuette wave (i) to the last low which may be minuette wave (iii), then place a parallel copy on the high of minuette wave (ii). Minuette wave (iv) may find resistance at the upper edge of the channel.
Minuette wave (iv) may not move into minuette wave (i) price territory above 1,167.49.
Today I will present three hourly charts in order of probability.
FIRST HOURLY CHART
Click chart to enlarge.
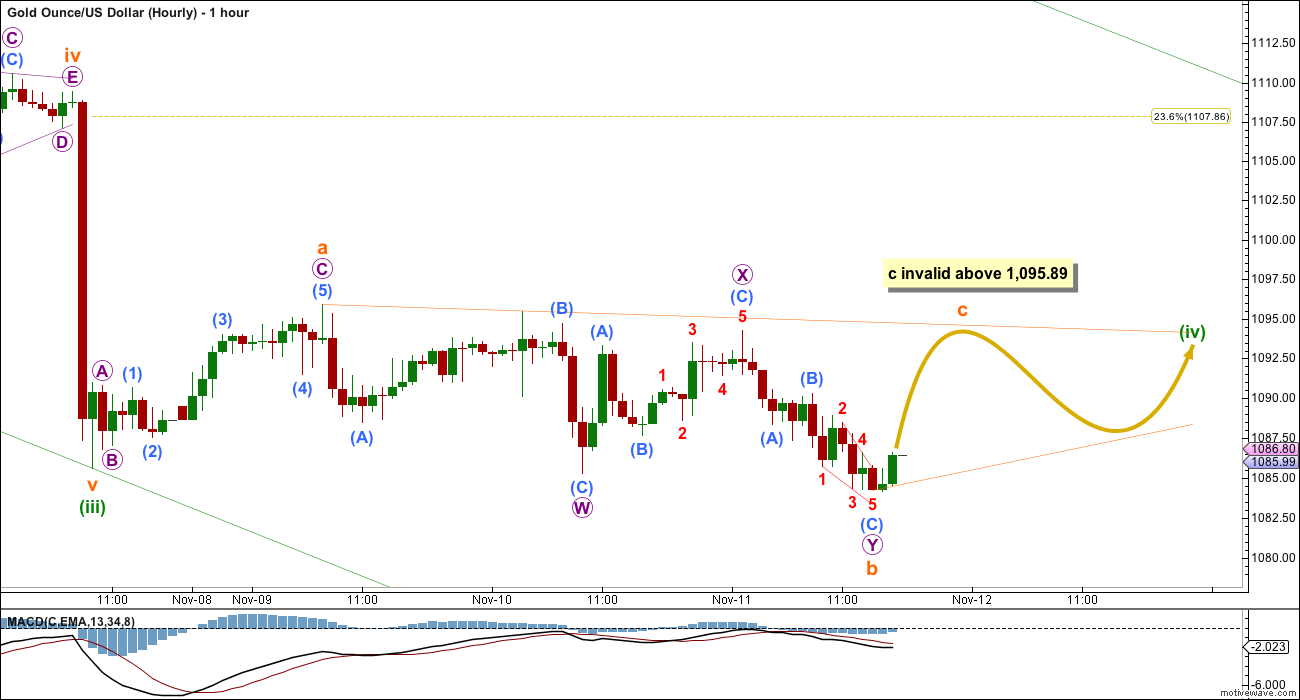
This first hourly chart is preferred because the subdivisions have the best fit at this stage.
Minuette wave (iv) may be an incomplete running contracting triangle. Subminuette wave b subdivides well as a double zigzag and is 1.14 the length of subminuette wave a.
Within subminuette wave b, this wave count has the best fit for micro wave X as a zigzag and micro wave Y also as a zigzag with an ending contracting diagonal for submicro wave (C).
Subminuette wave c may not move beyond the end of subminuette wave a above 1,095.89. This invalidation point is black and white. If it is breached, then the second hourly wave count below should be used.
Subminuette wave d may not move beyond the end of subminuette wave b when subminuette wave c is done. This invalidation point is not black and white. Subminuette wave d may end about the same level as subminuette wave b for a barrier triangle and in practice this means it may end slightly below subminuette wave b as long as the b-d trend line remains essentially flat. This is the only Elliott wave rule which has any grey area.
Finally, subminuette wave e may not move beyond the end of subminuette wave c.
The whole structure should move sideways in an ever decreasing range, taking up time. The purpose of triangles is to test our patience. They do it well. If the triangle is time consuming enough, it may find resistance at the upper edge of the channel copied over from the daily chart.
So far minuette wave (iv) has lasted three days. If it continues for two more, it may end in a total Fibonacci five days.
SECOND HOURLY CHART
Click chart to enlarge.
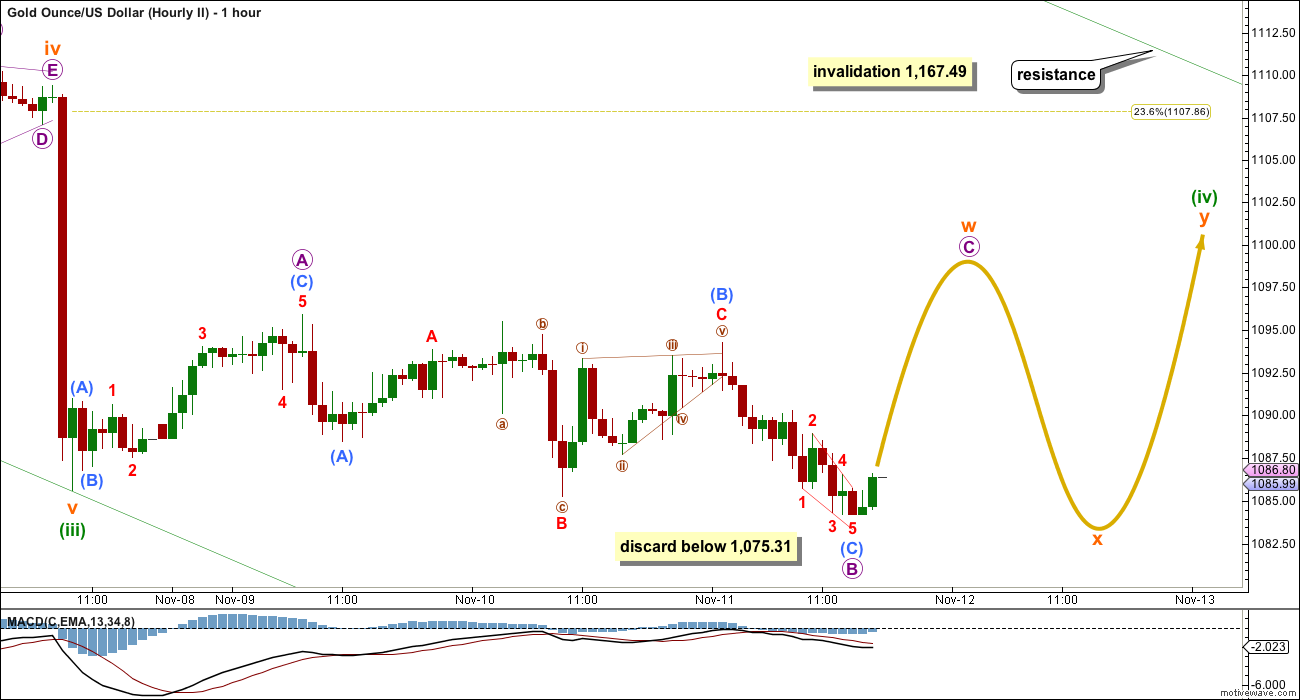
Minuette wave (iv) may be continuing as a combination. The first structure in the double may be an incomplete expanded flat for subminuette wave w. When that is complete the double should be joined by a three in the opposite direction for subminuette wave x, which may again make a new low below the price extreme of subminuette wave w.
A second corrective structure for subminuette wave y would most likely be a zigzag.
This is unlikely to be the whole of minuette wave (iv) although this wave count sees an expanded flat unfolding. Minuette wave (ii) was an expanded flat, so the least likely structure for minuette wave (iv) would be the same, an expanded flat. A combination would provide some structural alternation.
If micro wave B continues lower, then at 1,075.31 it would reach twice the length of micro wave A. There is no maximum limit for a B wave within a flat, but there is an Elliott wave convention which states that when B is longer than twice the length of A the probability of an expanded flat unfolding is so low that the idea should be discarded.
If price moves below 1,075.31, particularly if it does so on an increase in downwards momentum and an increase in volume, then the third wave count below should be used.
THIRD HOURLY CHART

Click chart to enlarge.
It is technically possible that minuette wave (iv) is over at this stage. But this wave count does not have a good fit in terms of recent subdivisions.
If minuette wave (iv) is complete, then it may have been a double combination: zigzag – X – flat.
Within subminuette wave y, micro wave C is seen here as an ending contracting diagonal. This does not have as good a fit as seeing this movement as a zigzag. The lower diagonal trend line is overshot twice and this was not where price found support.
If minuette wave (v) is over, then a five down should be seen. Micro wave 1 may be a leading contracting diagonal, but again this movement so far fits best as a zigzag.
Micro wave 2 may not move beyond the start of micro wave 1 above 1,094.27.
This wave count should be used if price makes a new low below 1,075.31. Because a strong fifth wave down is approaching, which should show a strong increase in downwards momentum, we should still expect any surprises to be to the downside. This is the biggest reason for publishing this wave count today. The strong downwards pull of minuette wave (v) may force minuette wave (iv) to be more brief and shallow than it may otherwise be.
TECHNICAL ANALYSIS
Click chart to enlarge. Chart courtesy of StockCharts.com.
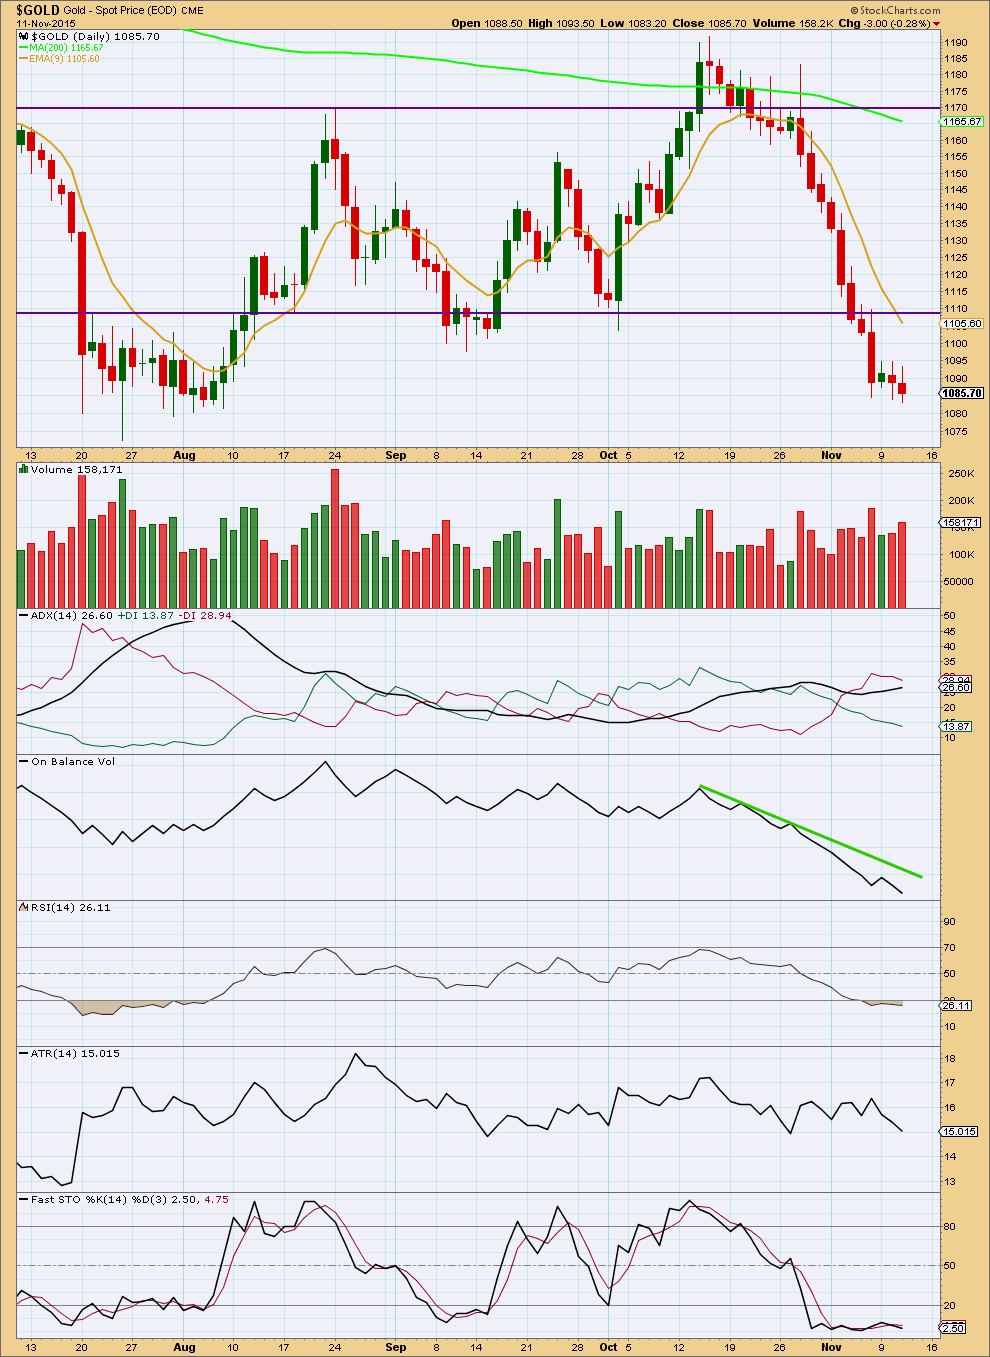
Daily: Today’s downwards day comes with some increase in volume, but volume is still lower than the last strong downwards day. There is some support for the fall in price, which is expected if the trend is down and supports the trend.
ADX still indicates a downwards trend. Today ATR disagrees indicating that price is currently most likely consolidating. At this stage, both these indicators support the Elliott wave count. ADX is a lagging indicator and indicates the overall trend is down, while ATR declining indicates a small consolidation within the downwards trend is currently unfolding.
There is a very slight bullish divergence today with Stochastics and price. Stochastics moved slightly higher while price made a slight new low. This also supports the first two hourly charts which expect some upwards movement short term from here.
On Balance Volume agrees with price as it too has made a new low.
RSI remains oversold; some upwards movement from here may resolve this.
Oscillators may remain extreme for some time while price is trending. They should be used for divergence and trend lines during a trending market such as Gold is in now.
This analysis is published about 06:34 p.m. EST.
Is Gold Now Headed Towards $1,000 Level? – Jim Wyckoff Nov 12, 2015
http://www.kitco.com/news/video/show/Technically-Speaking/1111/2015-11-12/Is-Gold-Now-Headed-Towards-$1000-Level—Jim-Wyckoff
I cannot see a wave count which sees minuette (iv) incomplete today.
The new low is too low to be part of a continuation of that correction, it looks wrong.
I expect minuette (v) has begun. Hourly count #3 will be favoured. The target is 932 for now, I’ll be looking to see if I can add to that at a second degree after I’ve finished with 5 minute charts this morning.
This fifth wave down should exhibit an increase in momentum beyond that seen so far. Expect any surprises to be to the downside. Use trend lines to indicate where corrections may find resistance along the way down. Draw a mid line in the channel that I have on the daily and hourly charts (from minuette (i) to (iii), copy on (ii) ). Price seems to be finding resistance there.
If I’m right and a really strong fifth wave down is in its early stages then price should not break above the channel. A break above the mid line would be an early warning something is wrong. While price remains below that line expect the trend is down, expect momentum to increase. If price breaks below the lower edge of that channel look out for explosive movement downwards.
If price breaks above the channel then it is likely the start of a second wave correction; I’d move everything within minute iii down one degree. A larger correction could take several days to unfold. But only if price breaks ABOVE the channel.
IMHO: Gold price will likely stall overnight between 1074-1085-86 before further decent for 1066-1056 with Gold price likely stalling at 1066-65 on a drop below 1073-72….
Orange wave iv may be flat.
Wave A from 1074 to 1089. Wave B may retrace 90% of A . That brings gold to 1075.
Wave C up may be 1.618 of wave A?????
Gold could got to 1094 to complete wave iv.
Am I correct?????
1094 is no longer valid I believe and wave iv completed at 1089.53 at 10:58 pm Wednesday.
Expecting to see Gold price break below 1073 for 1066 and lower….
Gold just bounced .618 to 1086 and above. Wave iv is done????
see hourly 3 chart…wave 4 was done yesterday.
Sorry I am asking about orange wave iv.
Their is no such thing on Lara’s charts Wednesday.
Please recheck and clarify the question.
Minuette wave (iv) is complete
Hourly III is the confirmed wave as gold already below 1,075.31.
Up to 1091 (but not above 1,094.27) – then down (confirmed below 1,075.31) would have an increase in downwards momentum and an increase in volume.
So now only one hourly wave count left.
Yes
Where will the wave iv bounce to?????
At 9:00 AM we are within one dollar of the July 24/15 low in GOLD at 1078.60 on my data feed. This is normally a place for bulls to take a stand and …..OOOOPPPSS….just broke through….next support comes from March 2008 peak at 1014.60…could be a Wile E. Coyote moment…
Gold at 1082. It appears wave ii is in play. What is the extent of wave x?
It should stop here some where????
Any comment.
The future of mining: the ocean floor
http://www.cnbc.com/2015/11/11/worlds-first-deep-sea-mining-company-reveals-new-gear.html
Gold and the miners both moved up from the gold low at 1:07 pm but 30 minutes later gold started dropping to a another new low but the miners kept moving up to close at the day high. Miners may have given a first indicator that a correction is very, very close that Thursday is likely to be an up day for gold and miners.
It seems out of balance for gold to drop $108 then expect at most a $20 correction then gold drops even more down in minuette wave (v) to $932 to end minute wave iii. That would be a huge drop of about another $160 after a correction to about 1090.
Could the pulling power of the middle of a 3rd of a 3rd of a 3rd bear wave be that strong?
From 1191.64 October 15th gold dropped to 1083.20 today’s low and the most bullish of the 3 hourly counts has gold correcting up $19 to 1,102.
Gold has dropped 16 of the last 21 days and some have mentioned that is a very rare occurrence and may indicate a final gold bottom may be near. Some even think that gold just has to get below the July 20th low of $1072.01, which is only about $13 lower than today’s close.
Thursday, Nov 12 Calendar
8:30am – jobless #’s
9:15am – Fed Bullard speaks
9:50am – Consumer Confidence
10:15am – Feb Evans speaks
10:30am – NatGas stockpiles
11:00am – Crude inventories
12:15pm – Fed Dudley speaks…
My prediction…..volatility….and a nap in the afternoon.
Lara,
Do you have any rough guess at all as to when these 3 big waves might end?
Intermediate wave (3)
Intermediate wave (4)
Intermediate wave (5) to end Primary wave 5, the Gold bear market bottom.
Thank you for any rough estimates.
So far these primary degree waves are exhibiting durations either at or very close to Fibonacci numbers (in weeks duration): 1 =3 , 2 = 53 (2 short of 55), 3 = 37 (3 more than 34), 4 = 54 (1 less than 55).
So far 5 is 70 weeks in duration. The next Fibonacci number in the sequence for primary 5 is 89, so cycle wave a may end in a further 19 weeks give or take up to three either side of this expectation.
Within primary 5: intermediate (1) = 13, (2) = 15 (2 more than 13). So far (3) has lasted 42. The next number in the sequence is 55. Intermediate (3) may end in another 13 weeks.
Intermediate (4) maybe another 5 weeks, intermediate (5) one to four weeks.
If the corrections to start primary 5 are so time consuming then I expect it may have a very swift surprising end, and the fourth waves may be quick and shallow.
At the bottom everyone will be bearish. A bull wave count may invite derision at that stage. If it does, we’ll be on the right track 🙂
Nice knowing you guys, trade safe
o7
Same to you Edward.
Appreciated your input. Take care.