
A green candlestick or doji was expected for Thursday’s session but did not happen.
The third hourly wave count was confirmed with a new low below 1,075.31.
Summary: A new low below 1,074.27 would indicate a strong fifth wave down is underway. The target is at 937 – 932. A new high above 1,094.27 would indicate a multi day correction has arrived, with the most likely target at 1,118.
To see weekly charts click here.
New updates to this analysis are in bold.
MAIN ELLIOTT WAVE COUNT
Click chart to enlarge.
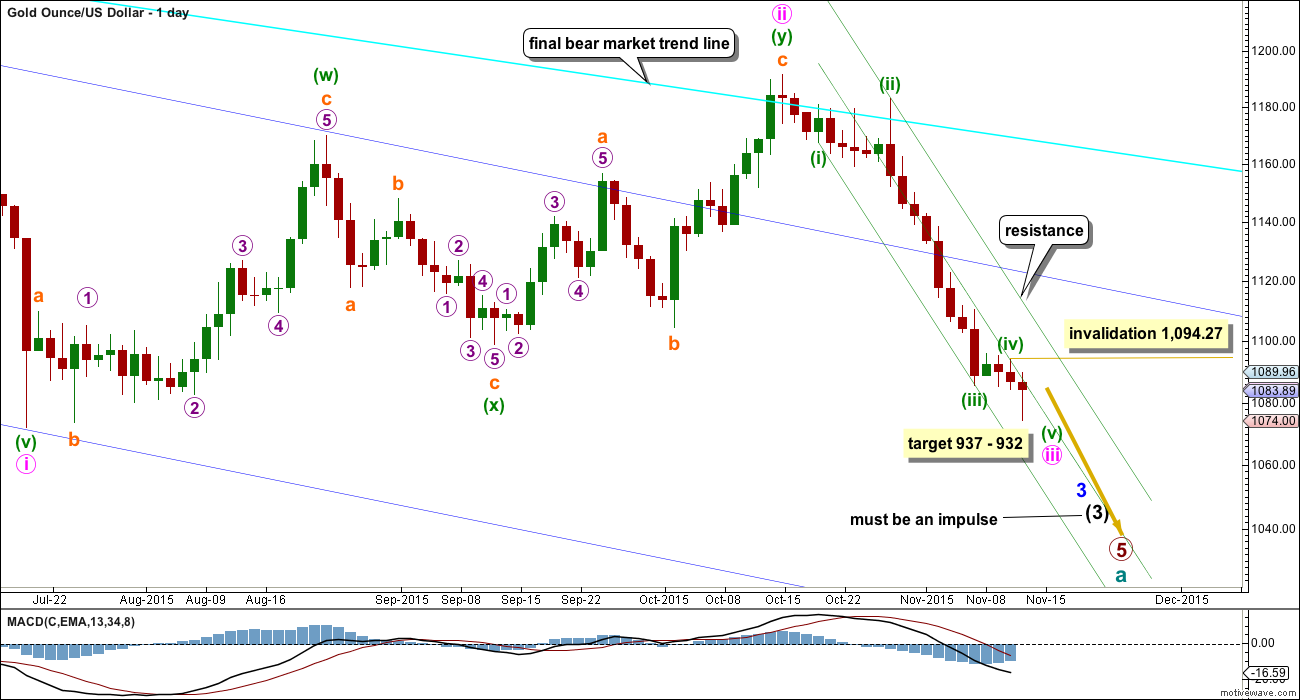
Gold has been in a bear market since September 2011. There has been no confirmation of a change from bear to bull. Price remains below the 200 day moving average and below the final bear market trend line (copied over from the weekly chart). The bear market should be expected to be intact until we have technical confirmation of a big trend change. At this stage, all bull wave counts have been invalidated.
The final line of resistance (bright aqua blue line copied over from weekly charts) is only overshot and not so far properly breached. While this line is not breached the bear wave count will remain possible. Simple is best, and the simplest method to confirm a trend change is a trend line.
Minute wave ii is a complete double zigzag and deep at 0.75 the length of minute wave i. It has breached the dark blue base channel drawn about minor waves 1 and 2, one degree higher. When a lower degree second wave correction does this it reduces the probability of the wave count but does not invalidate it. Base channels most often work to show where following corrections find support or resistance, but not always.
At 932 minute wave iii would reach 1.618 the length of minute wave i. If minuette wave (v) has begun as per the main hourly wave count below, then at 937 minuette wave (v) would reach 1.618 the length of minuette wave (iii). It is expected that minuette wave (v) will be a long strong extension. Minute wave iii should show an increase in downwards momentum beyond that seen for minute wave i.
Gold often exhibits swift strong fifth waves, particularly its fifth waves within its third waves. Minuette wave (v) may be explosive. For this wave count look out for surprises to be to the downside.
Draw a channel about this downwards movement using Elliott’s first technique: draw the first trend line from the end of minuette wave (i) to minuette wave (iii), then place a parallel copy on the high of minuette wave (ii). At the moment price is finding resistance about the mid line of this channel.
No second wave correction may move beyond its start above 1,094.27 within minuette wave (v).
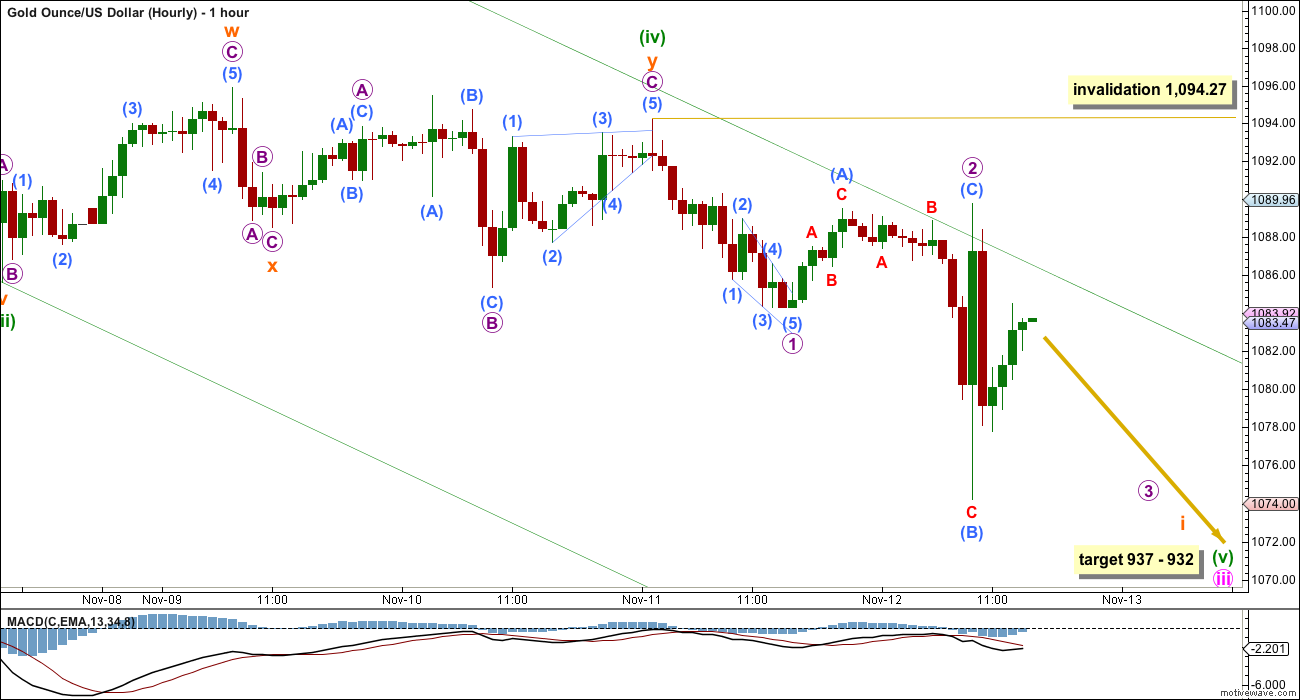
Click chart to enlarge.
Minuette wave (ii) was a deep expanded flat correction. Minuette wave (iv) exhibits alternation as a very shallow combination. Minuette wave (ii) lasted six days and minuette wave (iv) lasted three days. They both show up at the daily chart level giving the wave count the right look.
The first wave down will fit as a leading contracting diagonal within minuette wave (v). This may have been followed by a relatively deep 0.55 expanded flat correction.
Within micro wave 2, submicro wave (B) is unusually deep and 2.87 times the length of submicro wave (A). This is much longer than the maximum common length of 1.38. There is no rule stating the maximum length of a B wave within a flat and I have seen flats which very long B waves unfold before, but this is unusual. For this reason mostly, the alternate below must be considered to have a reasonable probability.
If micro wave 2 is not over and continues further as a double flat or combination, then it may not move beyond the start of micro wave 1 above 1,094.27.
A new high above 1,094.27 would invalidate this main wave count and confirm the alternate below.
ALTERNATE ELLIOTT WAVE COUNT
Click chart to enlarge.
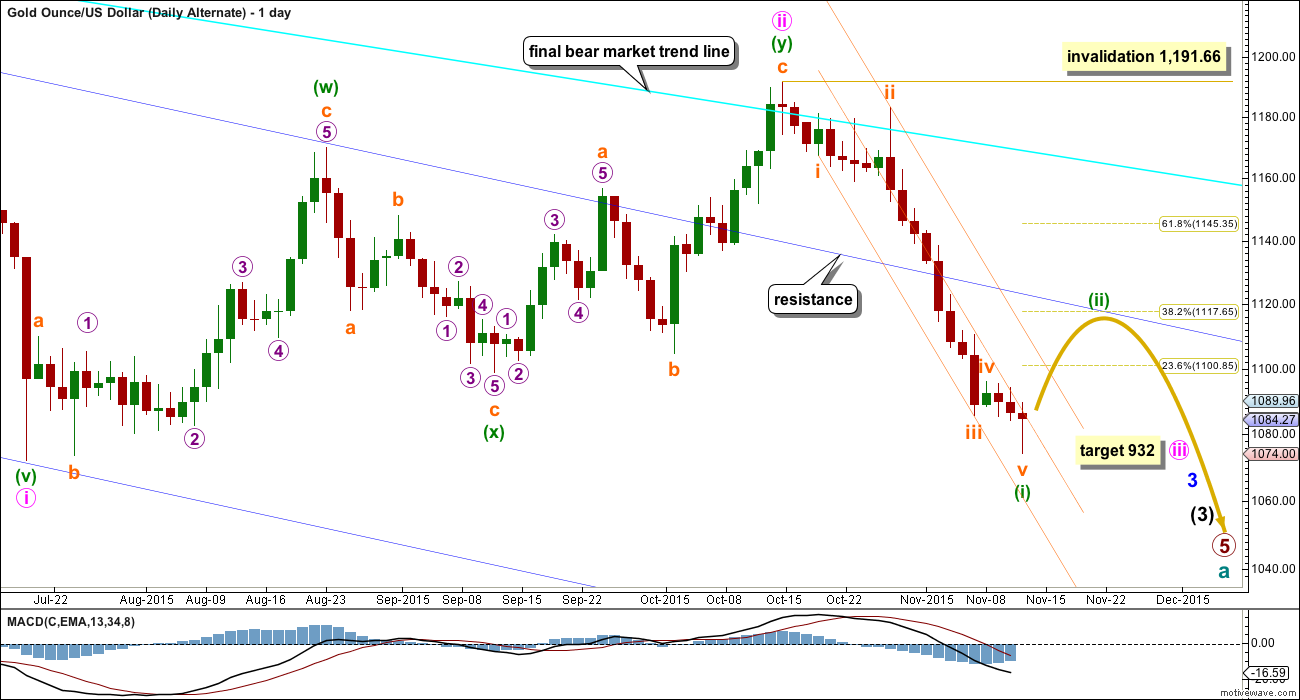
Everything is identical up to the high labelled minute wave ii for this alternate wave count.
Thereafter, within the recent downwards movement, everything is moved down one degree to see another first wave complete. All subdivisions within recent downwards movement are the same up to the low labelled subminuette wave iii. Thereafter, it is seen a little differently on the hourly chart.
If minuette wave (i) within minute wave iii has just ended, then minuette wave (ii) should show up on the daily chart and may last a total Fibonacci five or eight days. It may be longer lasting, but at this early stage a quicker end should be expected. The middle of a big third wave is still approaching which may force corrections to be more brief and shallow than otherwise.
Minuette wave (ii) should first breach the orange channel containing minuette wave (i). If it ends at resistance at the dark blue line, it may reach only up to the 0.382 Fibonacci ratio of minuette wave (i) at 1,118. Final resistance would be at the final bear market trend line.
This may resolve RSI being oversold.
Click chart to enlarge.
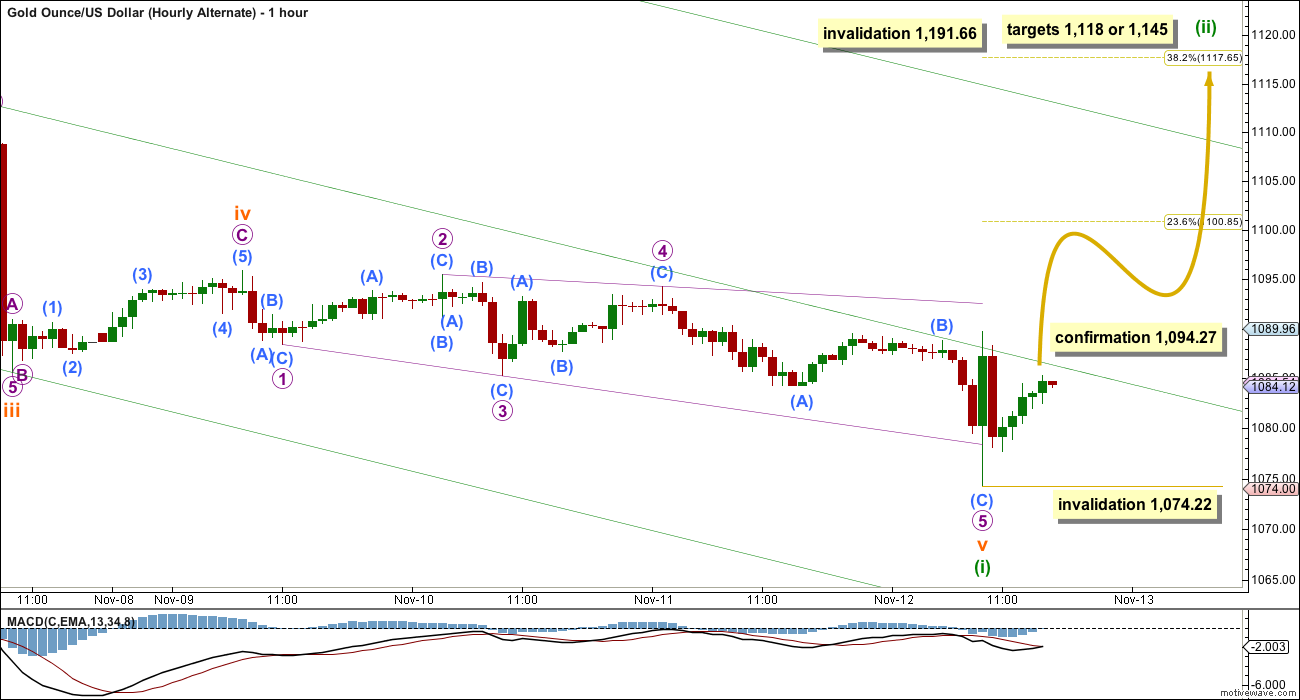
All subdivisions up to the low labelled here subminuette wave iii are identical for both hourly wave counts. Thereafter, the hourly wave counts differ.
What if the fourth wave was a quick shallow zigzag? Subminuette wave (iv) may have been over in one day exhibiting perfect alternation with the deep expanded flat of subminuette wave ii.
If the fourth wave is over there, then following downwards movement fits well as an ending expanding diagonal. All the sub waves subdivide perfectly as zigzags (as they must for an ending diagonal) and this part of the wave count has a better fit than the main wave count. The 1-3 trend line is overshot; sometimes fifth waves of diagonals do that. Micro wave 2 is 0.94 of micro wave 1 and micro wave 4 is 0.88 of micro wave 3. Both are deeper than the common depth of 0.66 – 0.81, but deeper is better than more shallow. All the rules for this structure are met.
The problem of the unusual depth for a B wave within an expanded flat that the main wave count has is resolved.
Micro wave 4 fits better as a zigzag than it does as an ending diagonal. This part of the wave count has a better fit for this alternate.
Minuette wave (ii) may unfold as any corrective structure except a triangle. If it unfolds as an expanded flat or combination, then it may include a new low below its start at 1,074.22. However, the first movement up for a multi day correction should be a five wave structure. Within the five wave structure no second wave correction may move below the start of its first wave below 1,074.22. For the next 24 hours this invalidation point will remain. Thereafter, the invalidation point may be removed.
Minuette wave (ii) may not move beyond the start of minuette wave (i) above 1,191.66.
TECHNICAL ANALYSIS
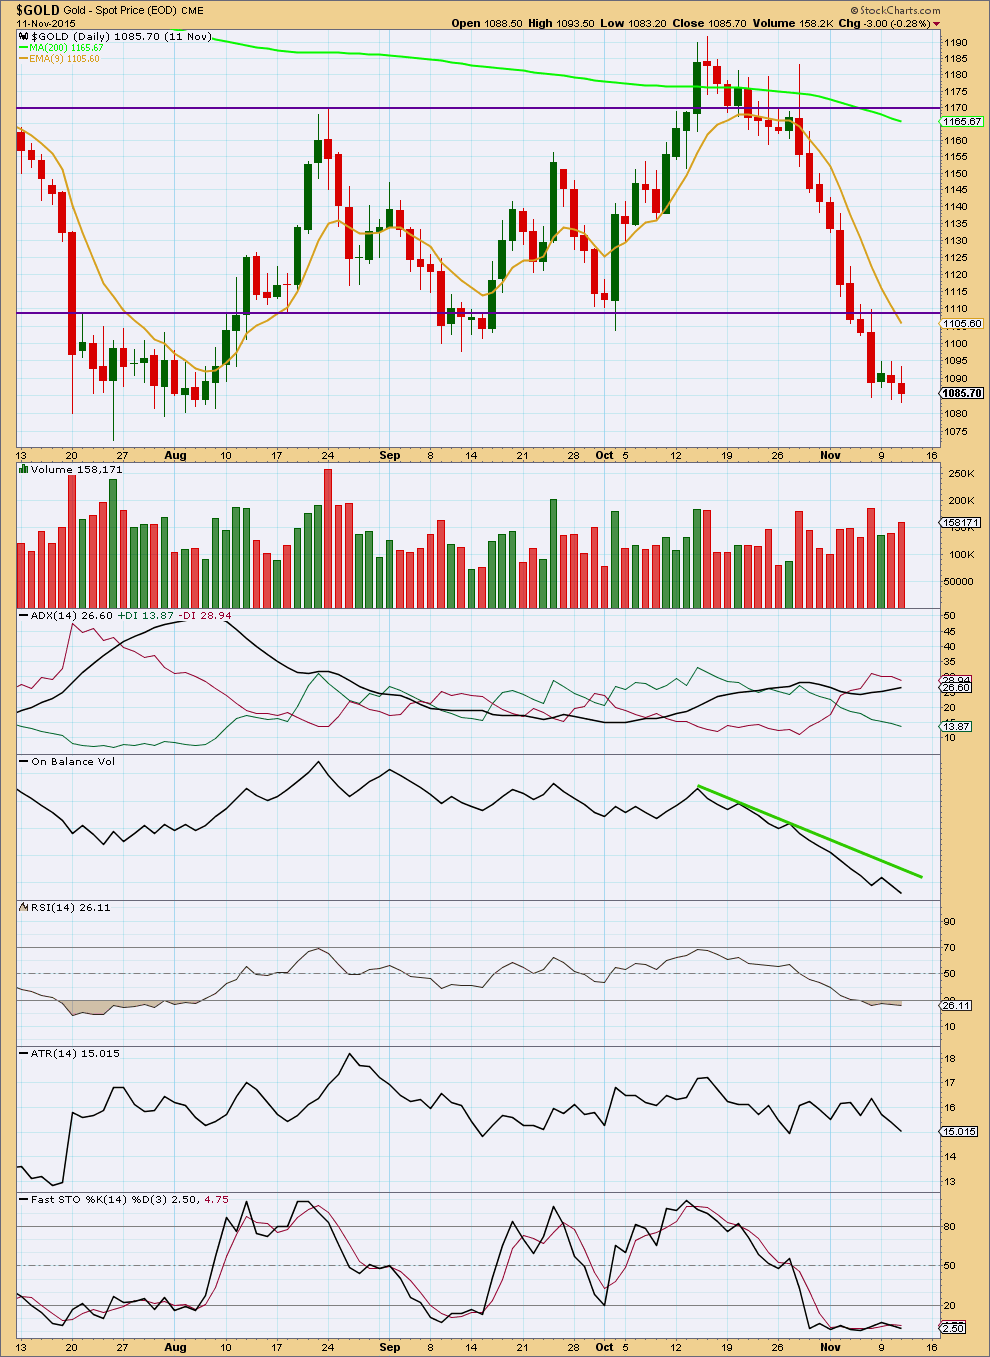
Click chart to enlarge. Chart courtesy of StockCharts.com.
Note: This analysis is prepared before NY close. It may be updated after 6:30 p.m. EST when StockCharts data is finalised, if volume data at that stage differs substantially from what’s presented here.
Daily: Again, a downwards day shows an increase in volume. The fall in price is supported by volume.
ADX still indicates a downwards trend. Today ATR disagrees indicating that price is currently most likely consolidating. ADX is a lagging indicator and indicates the overall trend is down, while ATR declining indicates a small consolidation within the downwards trend is currently unfolding. This would support the alternate hourly Elliott wave count.
On Balance Volume agrees with price as it too has made a new low. The last two major lows in price diverge from OBV; while OBV has made a strong new low price has not. This divergence indicates weakness in price and is bullish. This may indicate the alternate hourly wave count is correct.
RSI remains oversold; some upwards movement from here may resolve this.
Oscillators may remain extreme for some time while price is trending. They should be used for divergence and trend lines during a trending market such as Gold is in now.
This analysis is published about 05:11 p.m. EST.
I’m going to work on the beach today 🙂
Before I get down there, and while I’m waiting for StockCharts to finalise data for Friday, charts are prepared.
I’m changing the main hourly wave count a bit. Problems identified with yesterday’s main hourly chart are resolved. The invalidation / confirmation point moves slightly higher, and this is most important. It’s now 1,095.89.
Will finish up analysis and publish shortly. Have a fantastic weekend everybody!
Inside day narrow range with Gold price having stalled and found support at 1080-1079… A close above pivot will probably be bullish but still dont think Gold price retrace will be able to take out 1091 for higher before commence down again…With a low range close will likely initially see downside continuation…. Lets see how this pans out.
Lara, just want to say thanks for the great video you did. It explained just enough and is good timing also. Really enjoyed it.
I’m in the camp of the alternate as well as a few others here– from before you even had an alternate (lol) just because miners seem to be holding their lows when xau is ticking down.
Sure is nice to have only one or two charts to consider.
Cheers!
It’s fantastic to have just the bear wave count and not have to worry about all the alternate possibilities for a big cycle wave b.
That will come later.
Hi Lara : On hourly wave count iii chart you have micro wave 2 noted. If possible can you move the yellow arrow line from ending micro 2 and a projected target for the bounce based on fib??
Thanks.
I think I know what you’re talking about… does today’s hourly alternate chart do what you’re asking?
Yes. Have a good time at the beach. You certainly deserve it.
$USD May backtest the breakout around 98. This may be short term bullish gold.
From Chart perspective these series of down sloping candles tails are forming bearish flag. One more day or so gold will go down like Lara reports.
With the current short term oversold condition, I prefer the alternate count. I just don’t see how gold could plunge another 100+ points when RSI has been in the 20s for days. Gold hasn’t even had a dead cat bounce.
Fortunately, gold is less than 10 points away from invalidation in either direction. So the wait should not be long.
From my observations, gold’s second waves within severe downtrends tend to finish between 43% – 57%. So, if a correction should ensue, it may well get into the 1130s.
All of that said, going long right now is playing with fire. Be careful.
I did not see the video until after I posted the comment above, so I guess you could view it as a vote of confidence in the alternate count.
The long lower tail/wick on today’s candle is another possible indicator that a correction may be coming. Also, the fact that gold only broke a few dollars below the July low, instead of plunging like a waterfall, is strange. The dollar is still holding below it’s high and is even selling off a little now. All of this indicates a correction of some sort.
Yes I agree, that candlestick does look quite bullish.
The alternate count would provide us with a very lucrative trade in the following weeks ahead. I would however have to take a loss in the short term but will more than make up for it later on.
Another vote for the alternate!
HI Lara,
Thanks for doing an extra video today…
but sad to say…mine won’t play…
the little white dot goes round and round
but video portion is not to be found..
I’m trying to get it uploaded to the Yootubes and they have issues 🙁
Have put it on our own server host, it should work now.
It’s working now on YouTube so I’ve put that code there.