
More downwards movement was expected.
Only one wave count is left now.
Summary: Only the bear wave count is left. One by one all bull wave counts have been invalidated. Gold has been in a bear market since September 2011 and there is no technical confirmation of a change from bear to bull. Expect surprises to be to the downside as the middle of a big third wave may be approaching. Short term a new high above 1,122.95 and / or a green daily candlestick on either of Gold or Silver will indicate a correction against the trend has arrived. The upcoming correction may last about three days and possibly longer. The trend is down.
To see weekly charts click here.
New updates to this analysis are in bold.
BEAR ELLIOTT WAVE COUNT
Click chart to enlarge.
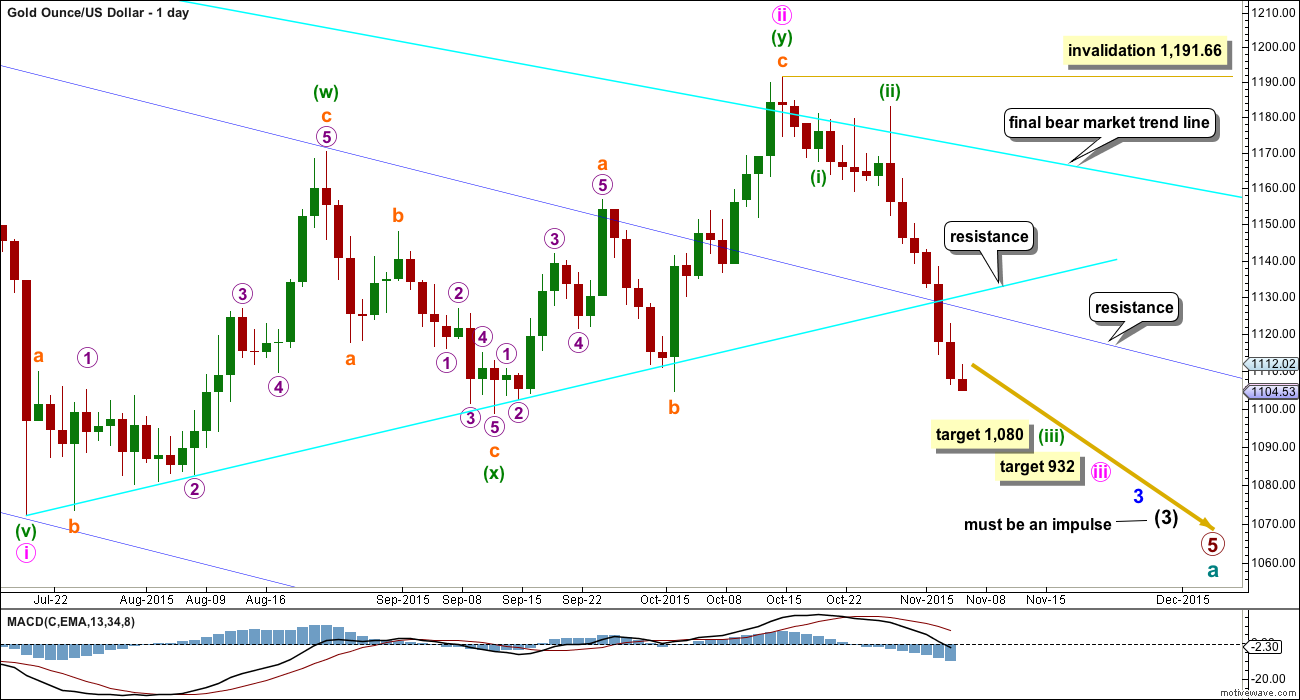
Gold has been in a bear market since September 2011. There has not yet been confirmation of a change from bear to bull, and so at this stage any bull wave count would be trying to pick a low which is not advised. Price remains below the 200 day moving average and below the final bear market trend line (copied over from the weekly chart). The bear market should be expected to be intact until we have technical confirmation of a big trend change.
The final line of resistance (bright aqua blue line copied over from weekly charts) is only overshot and not so far properly breached. While this line is not breached the bear wave count will remain possible. Simple is best, and the simplest method to confirm a trend change is a trend line.
Minute wave ii is a complete double zigzag and deep at 0.75 the length of minute wave i. It has breached the dark blue base channel drawn about minor waves 1 and 2, one degree higher. When a lower degree second wave correction does this it reduces the probability of the wave count but does not invalidate it. Base channels most often work to show where following corrections find support or resistance, but not always.
At 932 minute wave iii would reach 1.618 the length of minute wave i.
A new high above 1,191.66 would necessarily come with a clear breach of the bear market trend line, and so at that stage a bear wave count should be discarded. Within minute wave iii, no second wave correction may move beyond its start above 1,191.66.
Gold often exhibits swift strong fifth waves, particularly its fifth waves within its third waves. When price moves towards subminuette wave v of minuette wave (iii) it may be explosive. For this wave count look out for surprises to be to the downside.
At 1,080 minuette wave (iii) would reach 4.236 the length of minuette wave (i).
Again, I have the same two hourly charts that look at downwards movement differently. Today the second hourly chart actually has a better fit with the most recent movement in terms of subdivisions. But we should assume the trend remains the same until proven otherwise. Assume the trend is down until a correction is confirmed with either a new high above 1,122.95 or a green daily candlestick on Gold or Silver.
FIRST HOURLY CHART
Click chart to enlarge.
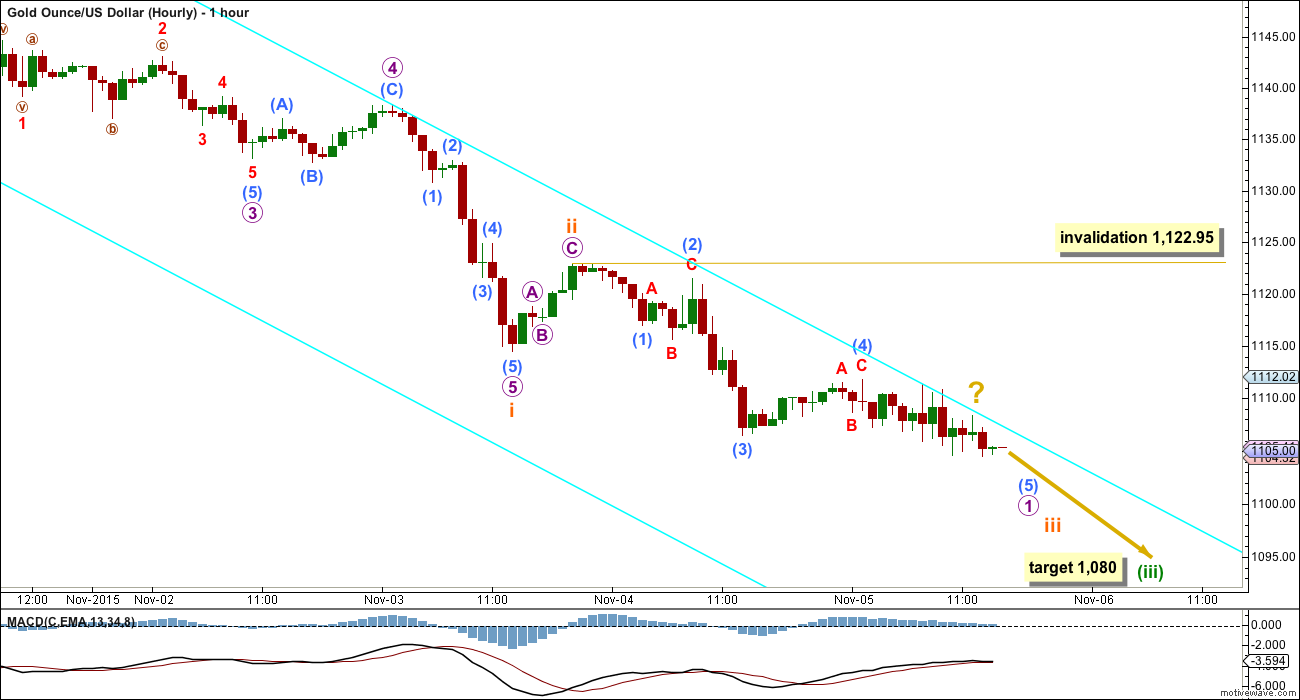
It is still possible that only subminuette waves i and ii are now complete within minuette wave (iii). Subminuette wave ii may have been remarkably quick and shallow. Sometimes this happens when the middle of a big third wave is approaching; the strong downwards pull can force corrections to be more brief and shallow than normal.
Ratios within subminuette wave i are: micro wave 3 is 0.97 short of equality in length with micro wave 1, and micro wave 5 has no Fibonacci ratio to either of micro waves 1 or 4. There is good alternation between the shallow zigzag of micro wave 2 and the more shallow flat correction of micro wave 4. Micro wave 3 is stronger than micro wave 1, and micro wave 5 is strongest. This looks like a typical impulse for gold.
Subminuette wave ii may have been over very quickly as a very shallow 0.09 correction of subminuette wave i. Although sometimes corrections approaching the middle of a third wave can be brief and shallow, this part of the wave count does not look right. This is why I am considering the second idea below.
If subminuette wave ii is complete, then within subminuette wave iii no second wave correction may move beyond its start above 1,122.95.
The downwards movement from the end of submicro wave (4) will not subdivide as either a complete impulse or ending diagonal. It may be an incomplete ending diagonal, but the many overlapping movements within it look more corrective. This piece of movement fits the second hourly chart better today.
SECOND HOURLY CHART
Click chart to enlarge.
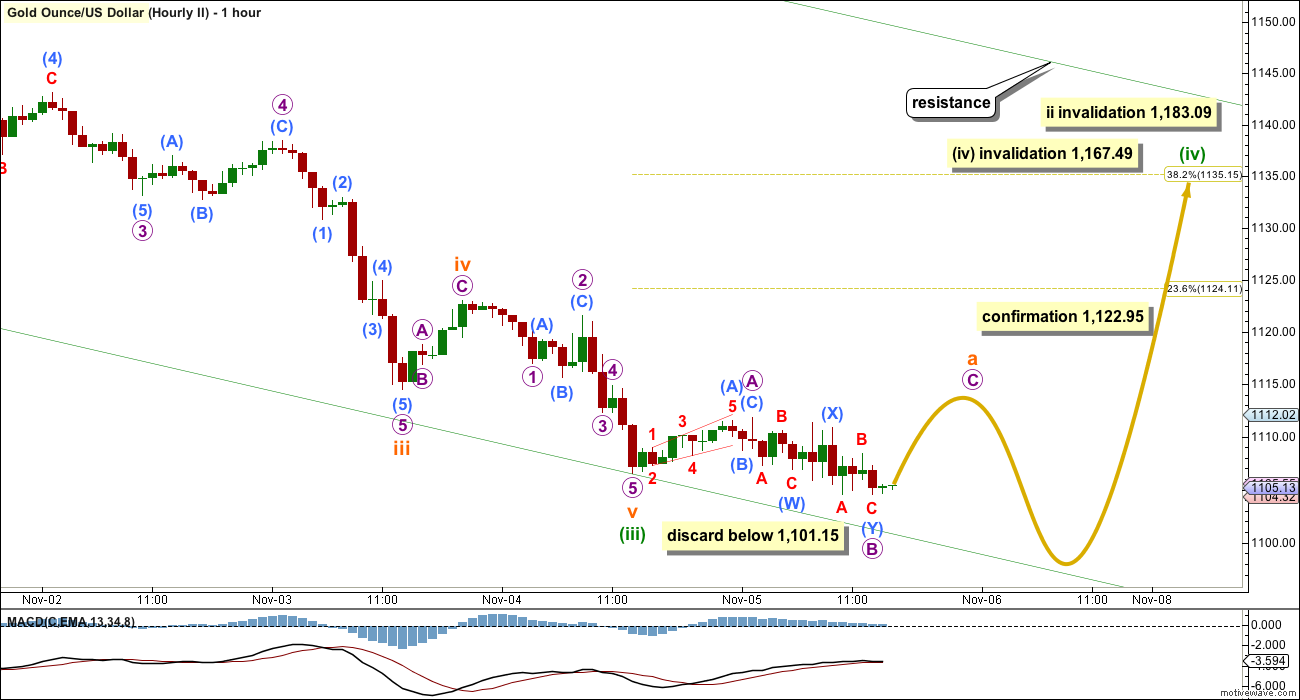
This idea expects the the five wave impulse downwards ended at Wednesday’s low and a bounce up from there may begin.
The degree of labelling within this impulse may also be moved up one degree (from labelling on the first hourly wave count), because minuette wave (iii) may have just ended. This idea would expect minuette wave (v) to be a strong extension.
The degree of labelling may also be moved back down one degree. The five wave impulse may have been only subminuette wave i.
Ratios within minuette wave (iii) are: subminuette wave iii is 1.3 short of 1.618 the length of subminuette wave i, and subminuette wave v has no Fibonacci ratio to either of subminuette waves i or iii. There is little alternation between subminuette waves ii and iv: subminuette wave ii is a shallow 0.34 zigzag with a long A wave and short C wave and subminuette wave iv is a more shallow 0.13 zigzag with a short A wave and a long C wave.
Although there is not perfect alternation between subminuette waves ii and iv (the biggest problem with this wave count), seeing the correction labelled subminuette wave iv as a fourth wave and not a second wave (as the first wave count does) makes more sense.
At this stage, a new high above 1,122.95 would provide some confidence that downwards movement is likely over for now and a bounce upwards has begun.
The 0.382 or 0.618 Fibonacci ratios would be likely targets for the bounce to end.
Minuette wave (iv) (or subminuette wave ii, if the degree of labelling is moved back down one degree) may be unfolding as a flat correction. Within a flat, the A wave must be a three and the B wave must retrace a minimum 90% of the A wave. So far subminuette wave a may be an incomplete flat correction, a three wave structure.
Micro wave A subdivides as a zigzag within subminuette wave a. Micro wave B fits reasonably well as a double zigzag. Micro wave B so far is 1.37 the length of micro wave A, within the normal range of 1 to 1.38 times the length of A for a B wave within a flat correction. If micro wave B continues lower, then when it reaches twice the length of A at 1,101.15 the idea of a flat correction should be discarded. While there is no rule stating the maximum length of a B wave within a flat, there is an Elliott wave convention which states the probability of a flat unfolding is extremely low when B is more than twice the length of A.
If this is a fourth wave correction for minuette wave (iv), then it may yet morph into a running triangle.
This correction may be a flat as labelled. It may also be a double flat or double combination. This is possible if it is either minuette wave (iv) or subminuette wave ii. If this wave count is correct, then as more structure unfolds the labelling may well change. It is impossible to tell which of the multiple structural possibilities may unfold for this correction at this early stage.
Minuette wave (iv) may not move into minuette wave (i) price territory above 1,167.49. It should find resistance at the upper edge of the channel which is drawn here using Elliott’s first technique.
If this correction is subminuette wave ii, then it may not move beyond the start of subminuette wave i above 1,183.09.
TECHNICAL ANALYSIS
Click chart to enlarge. Chart courtesy of StockCharts.com.
Now that StockCharts data is finalised, this regular technical analysis section was updated at 7:02 p.m. EST after NY has closed.
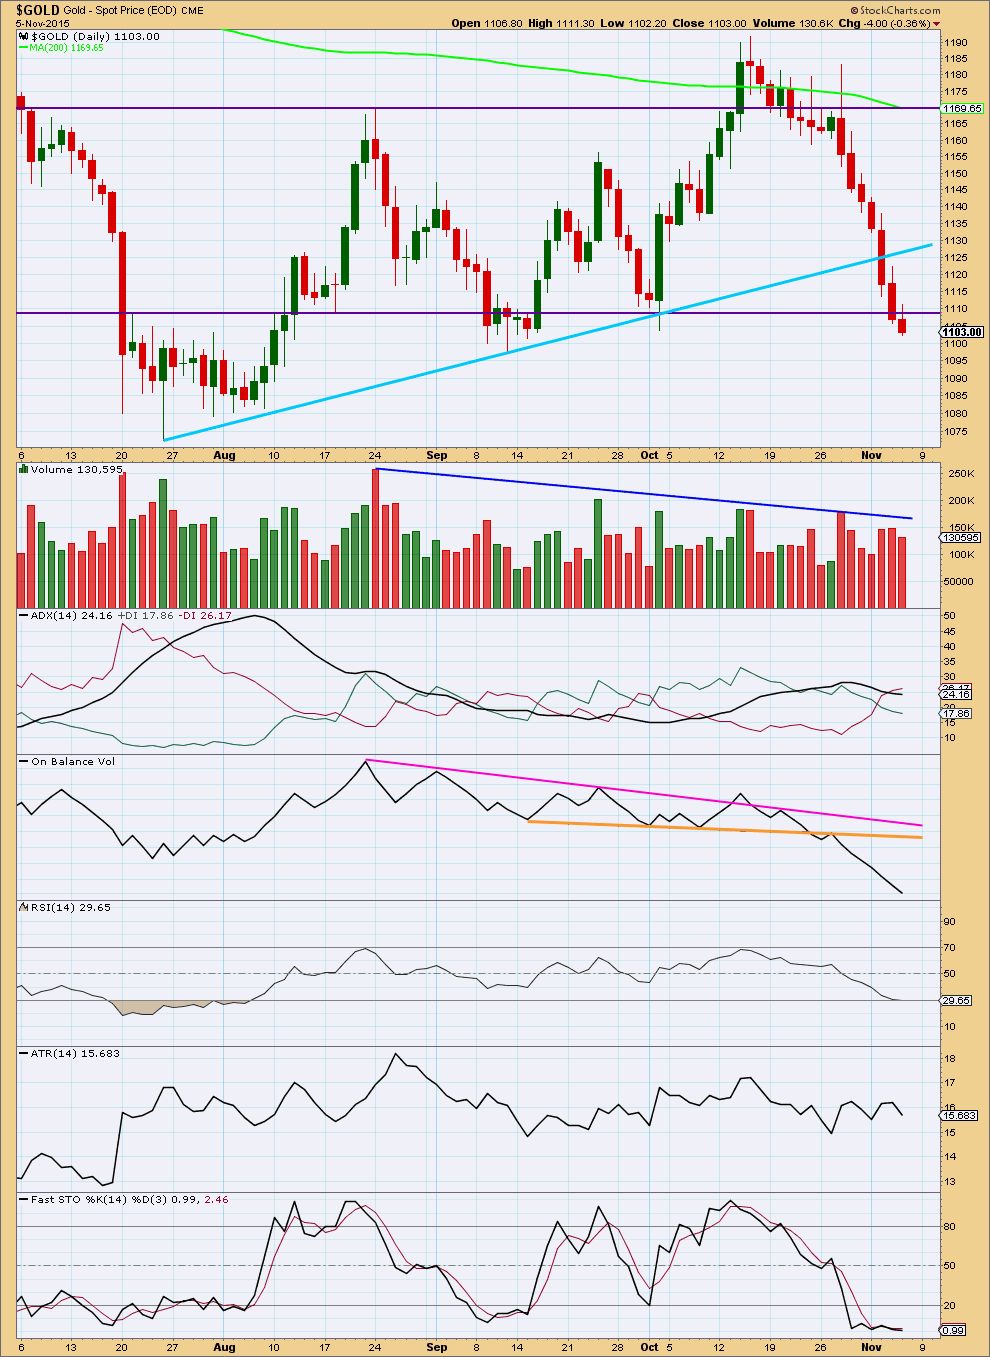
Daily: Downwards movement comes on a small decrease in volume today. The market has been falling now for seven days, mostly of its own weight, and may well continue to do so. Volume is not required for price to keep falling.
The last big downwards move from Gold began on declining volume. It was not until over halfway through that volume picked up. That could happen again.
Price closed below the lower horizontal trend line two days in a row now. This line has been overshot before, and so a full daily candlestick below that line is required for a clear breakout (today’s candlestick still has its upper shadow above the line). If that happens on a downwards day with an increase in volume, then a downwards breakout would be clearer. While more confidence in a downwards breakout may be had if volume spikes when price breaks below the trend line, this is not necessary.
It was a downwards day which had strongest volume during the consolidation. This indicates a downwards breakout is more likely than upwards. This does not always work, but it works more often than not. It is a useful indicator.
ADX is flat today. If the black ADX line turns upwards from here a new downwards trend would finally be indicated. ADX does tend to be a lagging indicator.
Average True Range is mostly flat. This is more typical of price during a consolidation than a trend.
A downwards breakout has not yet been clearly indicated because ADX and ATR do not clearly indicate a downwards trend as yet, and because price has not properly broken below the lower horizontal trend line. It looks likely price may break out downwards, but it may bounce up from support about here first.
Stochastics now more clearly diverges with price; Stochastics is flat and oversold while price has made new lows for the last three days. An upwards bounce may begin about here to resolve this divergence.
On Balance Volume is a leading indicator. Here it is very bearish. This supports the bear wave count nicely.
This analysis is published about 03:50 p.m. EST.
Updated COT analysis. Worked like a charm so far. Based on this move, I expect a lower low in our futures.
I’m staying in cash this weekend as still a toss up which way it could go over the weekend. The volume for GDX and GLD are both average, no spike.
“If today’s volume shows a spike and RSI reaches oversold on the daily chart I’d expect a green candlestick for Monday, a multi day bounce to begin from here
This one expects a multi day bounce to begin Monday for a fourth wave.
Chart: 1003 – 1000 – 1022
Still, expect surprises to be to the downside. This bear may now be quite close to a fifth wave to end a third wave. They can be explosive.”
The subdivisions within the middle of the third wave fit, and so it is possible that the sharp spike down during Friday was the fifth wave to end minuette (iii) a bit short of its target. Minuette (iii) would be 4.89 short of 4.236 X minuette (i).
This would probably be my favoured wave count, but I want to see RSI and volume data for Friday first before making a final decision on that.
This one expects a multi day bounce to begin Monday for a fourth wave.
It also expects minuette (v) to be a strong extension downwards. That may force minuette (iv) to be more brief and shallow than otherwise.
Still, expect surprises to be to the downside. This bear may now be quite close to a fifth wave to end a third wave. They can be explosive.
Second hourly chart
I have two hourly wave counts so far, will post charts here for you all. That means I can wait for StockCharts data to be finalised before I do the end of week analysis, but you can have an early look at how its going before NY closes.
Corrections so far are brief and shallow and so wave count #1 may actually be more likely; it sees a fourth wave correction for minuette (iv) yet to arrive.
Wave count #2 follows on from the same yesterday. It sees minuette (iv) over, and as a very shallow running contracting triangle.
The key today is that triangle. It fits the subdivisions. If you don’t see a triangle there then the B wave down within it must be seen as a five wave structure and it just doesn’t fit well at all. So my conclusion is there was a shallow triangle there which means a fifth wave down is either unfolding or complete now.
Gold’s fifth waves often do come to quick conclusions on volume spikes, with strong momentum. That may be what we have seen today. If today’s volume shows a spike and RSI reaches oversold on the daily chart I’d expect a green candlestick for Monday, a multi day bounce to begin from here.
I am working on one more wave count to see minuette (iii) complete. It’s not done yet. Will publish when I’ve finished work on that.
Have a fabulous weekend everyone! The sun is shining here in NZ and the dolphins are out to play. I’m going to play with them 🙂
I have posted way too often today, but here’s one more comment:
it seems to me like gold has been forming a very small triangle since today’s big drop, with A-B-C already complete. What this tells me is that gold may make a final new low (1180?) during Monday’s trading session. The triangle, if that is what it is, is tiny. In other words, the coming 5th wave may only be a few minimal dollars long.
Not possible to post “too often”. Your contributions are welcome by all here.
Thx
Retail Investors Changing Gold Tune Post-Jobs
Friday November 06, 2015 12:38
http://www.kitco.com/news/2015-11-06/Retail-Investors-Changing-Gold-Tune-Post-Jobs.html
Just did a quick analysis on Gdx and it appears that we have a complete 5 wave structure finished today. If true… Wave 2 (618retrace) would bring us back to $15.65 (very near or at upper trend line). If I get a chance to clean up my chart and have a better look I’ll post it over weekend; right now it looks like a smorgasbord
Thanks John. Always appreciate your thoughts.
Coming To The Defense Of Martin Armstrong Regarding Gold
by Avi Gilburt November 4, 2015
http://www.gold-eagle.com/article/coming-defense-martin-armstrong-regarding-gold
Anyone here have latest gold update from the mysterious Martin Armstrong?
If one looks up hour chart from Oct 28 to date gold has been in waterfall downward spiral.
With today’s big fallagain like on FOMC day it appears it will continue down.
IMHO: If Gold price continues to coast below 1089 then opens up downside risk 1081-1080 with price likely to stall at 1077-76….. Just a little confused with daily RSI well below 30 and wondering how much longer it will stay there or can stay there before a price rise is seen…. Hard to see Gold price rise back up to 1110 now…..
Doubt you will get much of a bounce that job report was smashing
No matter how you look at it, gold is short term oversold.
The more I think about it, the more I believe gold will correct higher than most anticipate. Moreover, it could be a slow grind over a couple weeks time. Traders need to be super patient right now.
We may have seen a case of sell the rumor, buy the fact.
Well I agree with it being oversold. The histogram on a daily macd must be screaming right now. I could see short covering and longs piling on… So if it happens I think it will be a quick shot, can’t imagine anyone wanting to hold long while a December rate hike is now in the making. Otherwise we go sideways to December?
The reasons you give are maybe why gold may grind higher, not lower. Just making an educated guess, gold could move sideways/ up through the end of the month. Remember that the U.S. has a number of holidays, like next Weds, the 11th, and Thanksgiving. Trading desks will slow down almost completely during the last week of the month.
As for major upcoming pivot points…..
the minutes from the last FOMC meeting will be released on Nov 18th. Then there is the next jobs report on Dec 4th, followed by the granddaddy moment of truth on Dec 16th. There may be other days of significance between now and the end of the year, but these are some doozies.
So true… Fundamental news is a catalyst and sometimes similar news can have totally different results. Gold has been subject to fundamental influence since this rate fiasco began and I despise constant surprise. One of the biggest reasons why I trade gold over any other commodity is that it experiences the least fundamental impact (until now). Oil for example is affected by fundamentals every Friday when the baker Hughes rig count data comes out and the list goes on…
Richard: High of minuette (iv) may be the next shorting opportunity?
Invalidation for min iv is 1122.95.
Gold may just travel to aqua trend line only.
Bur it is prudent to wait for Friday report.
Now just left with 1 wave count the bear as discarded bear hourly II and Lara to tell us next correction up before 1080 or perhaps latest at target about 1080 area (iii). Gold may of had a correction at 1103.01 3:55 pm low for micro 1, correction up to morning high of 1110.54 at 1:34 am for micro 2.
Today’s low of 1085.55 at 9:22 am may of been the end of subminuette i and start of subminuette ii? Now next move or correction? Minuette (iv) may be the next shorting opportunity?
Any comments or wave counts?
High of minuette (iv) may be the next shorting opportunity?
One man’s perspective. Gold has seemed to move in 19 week cycles for lows which has shown peaks in DUST for the same time frame. By my calculations we are about 4 weeks from a bottom, which very well could be a long term bottom. My point is this could also be a tremendous long term buying area.
Lara has time frame of 89 week from pm wave 4 to cycle wave a completion.
It may match your bottom cycle.
Michael yes tremendous shorting opportunity. Lara should clarify a lot about corrections and great time to buy for a short in tonight’s analysis and video especially since gold now finally is only left with 1 wave count for the first time in 3 weeks since October 15th and weekends may not be the best time to hold 3x ETFs.
The cycle that you are referring to is well documented, but averages 21 weeks. That means anything from 18-27 weeks is the same. You’re on the right track with this idea. I would just stretch it out a little longer. I, too, have plotted this and came up with a December (excluding the first week) to January low. It’s an unexact science, but a helpful guide. This does not mean that gold’s final low happens during this time frame.
I was in a full short position and got out based on this possible correction… Terrible luck. This is the Second time this has happened. First time it was in oil.. We expected a correction, yet oil continued to move lower and lower. To prevent this disaster in the future, we can’t anticipate big corrections in a third wave.
Hope I didn’t contribute to this with any bottom calling.
I’ve learned the hard way that the biggest gains come to those who wait. It takes mega patience to wait for those opportune moments to enter a position and perhaps even more to stick with a position and let it ride.
I’m still guilty of taking profits too early. While I got in near the top, and am still in, I did take some money off the table when gold was in the 1130s.
No no not at all.. I was fully loaded in a short position and there was about half hour left in trade when I saw Lara’s chart update about a correction and got out. It really happened that fast. It’s my fault, I should’ve known better. I don’t blame the idea because It looked correct, but I find when gold, oil, or whatever stock is in a third wave… Counting waves goes out the window. No hard feelings… Just hope we make note and correct our strategy for future moves. Hope you are right about a second chance
Looks like second hourly wave count is eliminated.
Wave count hourly ii is discarded below 1101.
Gold rose to 1110 in the morning now at 1085 and drifting down to 1080 target.
Do we need a new one?
Since gold broke lower first, before any kind of upward retracement, it now becomes more likely that the next move up will be the last opportunity to add to shorts before gold breaks below the July low.
Hi Matt
Based on Lara’s wave count now what will be the target for corrective wave iv up?
Does gold still have to drop to 1080?
Thanks.
Since the price is so close to 1180 now, I do not believe that there would be a 4th wave and then a small 5th that stops right at 1080. Rather, whatever correction comes will be the last one prior to gold moving below the July low.
Whether we should still expect a 4th wave now is not clear to me. The reason is that gold has had a number of these long, sharp moves that look like 3s but could have been 5s. That’s the reason – and it is very logical – that many out there have been looking for diagonal formations.
Long story short, I am keeping an open mind to a 2nd wave correction from 1191 down to here.
If your question is specifically asking if gold must move down another $5, I don’t know. Seems like a moot point though.
The main thing now is to be very patient. The natural inclination of most will be to jump on any small correction, when, in fact, it may take multiple days/ couple weeks and be a slow grind up.
Minute ii from 1,191.64 October 15th to 1,085.55 at 9:22 am
Right, this gives a potential maximum target of 1151.11 (.618 of the entire move down). However, gold may well drop another couple dollars. From 1180, .618 would be 1149.
All of that said, those are maximum targets. Since gold is in a strong downtrend, I would be ecstatic to sell anywhere in the 1140s!
Here’s a good chart showing the potential bounce that is discussed below. Chart by Fullgoldcrown.
Dreamer
Good idea gets around!!! Thanks for posting.
If you look at Lara’s Stockchart she has drawn the same trend line (aqua).
It always makes me nervous when everyone is looking at the same thing. 🙂
Matt/MTSLD
Good plan and thanks for sharing.
At around 1122 which may happen in three days trading will be a place to put shorts.
I just took profit in D UST yesterday and added some long.
Is wave b of flat over now or will it have move down from 1110 to 1102?
This analysis is very much in line with my thoughts as well. Great job, Lara!
Gold is short term oversold and should correct imminently, although there is always a chance that gold may move down to 1080. If so that is an even stronger area of support.
My estimate for this correction to end is the 1130s – 40s. That may take several days. While the 1150s are possible, the chances of gold getting there are low. If it did get that high, consider it a gift and load up on shorts like there is no tomorrow.
IMHO this could be a great point for adding shorts, or initiating a position if you haven’t already. Think of it this way: if it is only a 4th wave, there is a good chance of a strong 5th down thereafter. If so, any upcoming larger 2nd wave may not get much higher than this 4th wave anyway. If this is a 2nd wave, then you get to enjoy a 3rd wave down!
One last comment: it’s been stated multiple times already, but tomorrow at 8:30 am EST is the October jobs report for the U.S. and with it comes a lot of turbulence. Expect a wild ride.
Just in case I wasn’t crystal clear, the high point of any upcoming rally would be a great point for adding to short positions – not now.
You bet. I’ll be adding some gold shorts in the next few days.
So will every man and his dog! Trading is rarely that easy though.
How many predicted the relentless down moves of the past 2 weeks? Now that most are wrong-footed, I doubt that the market will deliver further easy pickings to the downside. Maybe 1080 beckons, but expecting to be confounded with sideways to upwards for longer than you might think might be a safer strategy.
I do hope I’m wrong though, as I’m sure you do. It would be nice to get this bear market over with.
It’s true, markets typically go higher or lower than we think and don’t do so in our timeframes.
Well this has been my plan, let the first wave finish, and look for sometime in the second /b wave to go short. We shall see, this wave has been very strong.
If gold does not clear 1122.95, it may be better to wait. Gold would then likely correct off of 1080.
Fortunately, I got in near the top and now have the privilege of being able to be sloppier about adding to the position.