
The third hourly Elliott wave count is confirmed by a green daily candlestick.
Summary: A fourth wave correction has most likely arrived. It may continue for at least another two days to last a total Fibonacci three days. If it does not end in three days total, then the next Fibonacci numbers in the sequence of five and eight would be expected for the duration of this bounce. Targets are either the 0.236 Fibonacci ratio at 1,108 or 0.382 Fibonacci ratio at 1,122. If it takes long enough, it may find resistance at the upper edge of the Elliott channel drawn on both daily and hourly charts.
To see weekly charts click here.
New updates to this analysis are in bold.
BEAR ELLIOTT WAVE COUNT
Click chart to enlarge.
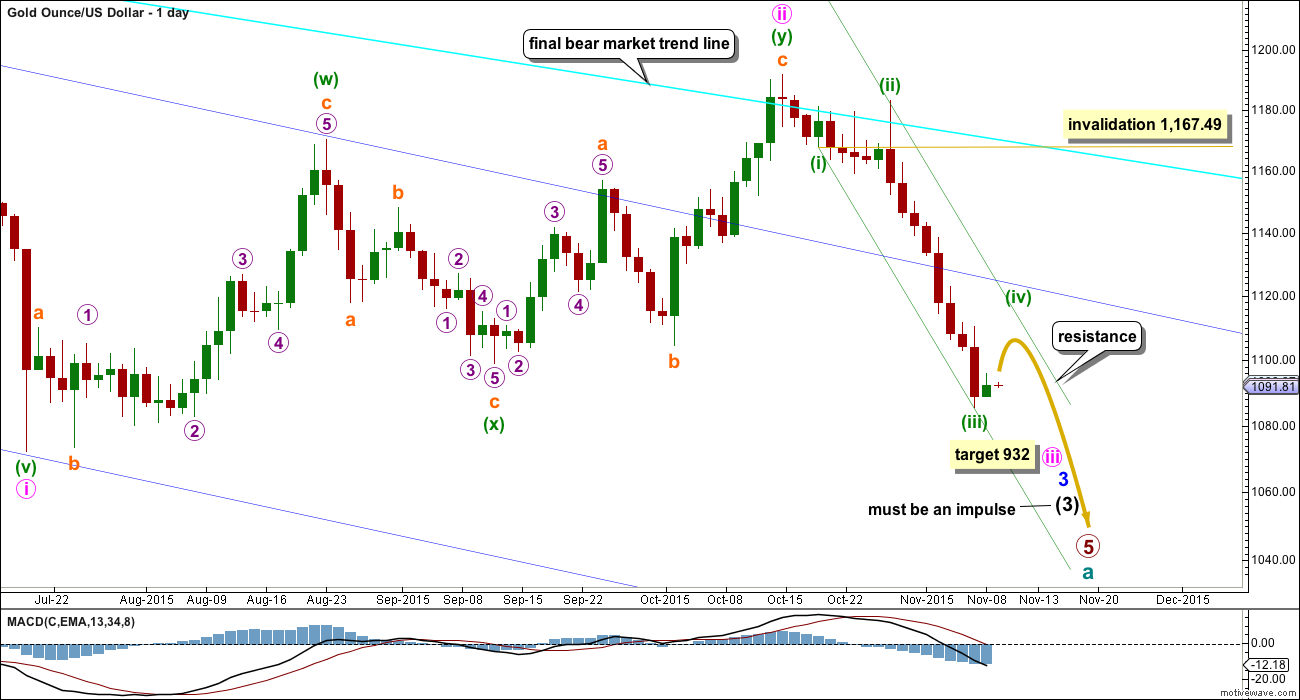
Gold has been in a bear market since September 2011. There has not yet been confirmation of a change from bear to bull, and so at this stage any bull wave count would be trying to pick a low which is not advised. Price remains below the 200 day moving average and below the final bear market trend line (copied over from the weekly chart). The bear market should be expected to be intact until we have technical confirmation of a big trend change.
The final line of resistance (bright aqua blue line copied over from weekly charts) is only overshot and not so far properly breached. While this line is not breached the bear wave count will remain possible. Simple is best, and the simplest method to confirm a trend change is a trend line.
Minute wave ii is a complete double zigzag and deep at 0.75 the length of minute wave i. It has breached the dark blue base channel drawn about minor waves 1 and 2, one degree higher. When a lower degree second wave correction does this it reduces the probability of the wave count but does not invalidate it. Base channels most often work to show where following corrections find support or resistance, but not always.
At 932 minute wave iii would reach 1.618 the length of minute wave i.
Gold often exhibits swift strong fifth waves, particularly its fifth waves within its third waves. When price moves towards subminuette wave v of minuette wave (iii) it may be explosive. For this wave count look out for surprises to be to the downside.
At 1,080 minuette wave (iii) would reach 4.236 the length of minuette wave (i).
Draw a channel about this downwards movement using Elliott’s first technique: draw the first trend line from the end of minuette wave (i) to the last low which may be minuette wave (iii), then place a parallel copy on the high of minuette wave (ii). Minuette wave (iv) may find resistance at the upper edge of the channel.
Minuette wave (iv) may not move into minuette wave (i) price territory above 1,167.49.
HOURLY CHART
Click chart to enlarge.
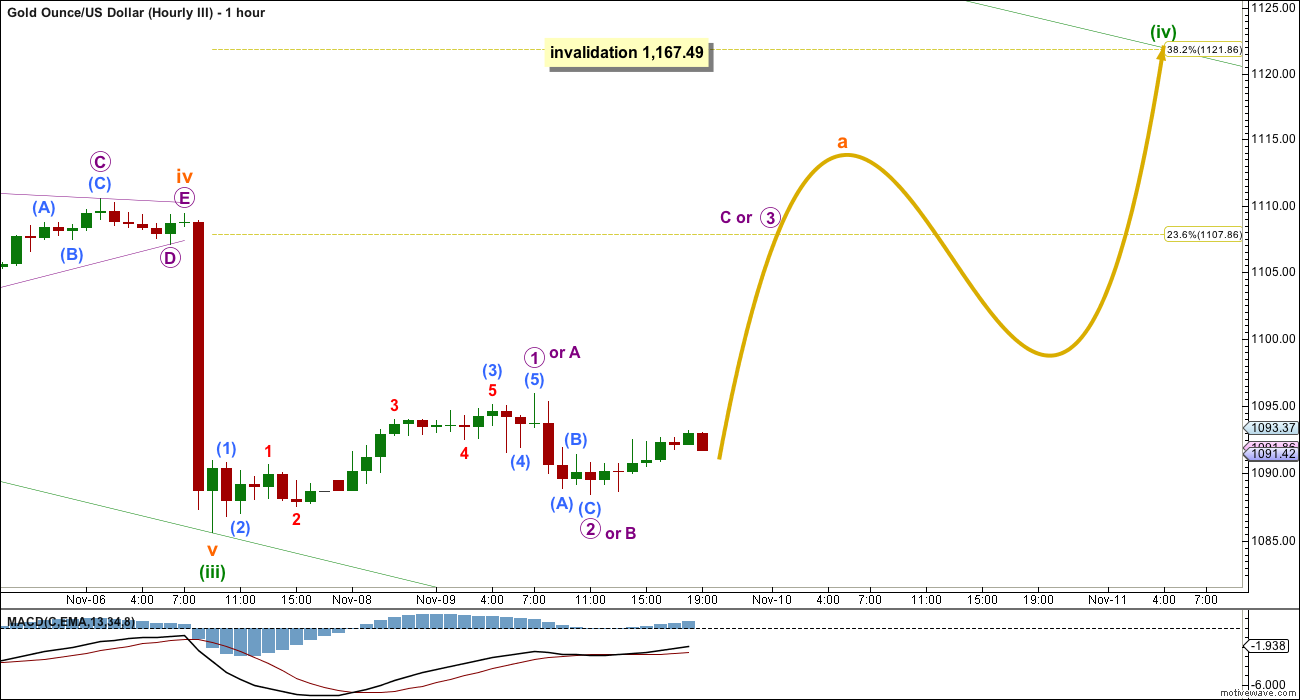
The green candlestick on the daily chart for Monday’s session confirms the arrival of minuette wave (iv). I have just the one hourly wave count today. It follows on directly from the last wave count labelled “third”.
Minuette wave (ii) was a deep 0.65 expanded flat lasting six days. Minuette wave (iv) may be shallow, most likely ending at either the 0.236 or 0.382 Fibonacci ratios. It would most likely be a zigzag or triangle.
It may be quicker than minuette wave (ii) due to the strong downwards pull of minuette wave (v) to come, and may last most likely a Fibonacci three days and possibly (less likely) a Fibonacci five. It is also possible (but even less likely) that it may last a Fibonacci eight days. This may be expected if it unfolds as a time consuming triangle.
At this stage, it looks like a five up and a three down is completed within minuette wave (iv).
If minuette wave (iv) is unfolding as a zigzag, then this may be micro waves 1 and 2 within a five wave impulse up for subminuette wave a.
If minuette wave (iv) is unfolding as a triangle, then this may be micro waves A and B within a zigzag up for subminuette wave a.
The labelling within this fourth wave correction will change because there are multiple structural options still open for this fourth wave correction as it unfolds. It is impossible at the start to know which structure will unfold, except only that a zigzag and triangle are more likely and a flat correction is least likely.
Minuette wave (v) downwards is expected to be very strong after minuette wave (iv) is complete. Gold typically exhibits swift strong fifth waves to end its third waves. At the daily chart level, downwards momentum for minute wave iii has yet to show an increase beyond that seen for minute wave i. The strongest downwards movement of this big third wave is still ahead and should now be fast approaching. Expect any further surprises to be to the downside.
TECHNICAL ANALYSIS
Click chart to enlarge. Chart courtesy of StockCharts.com.
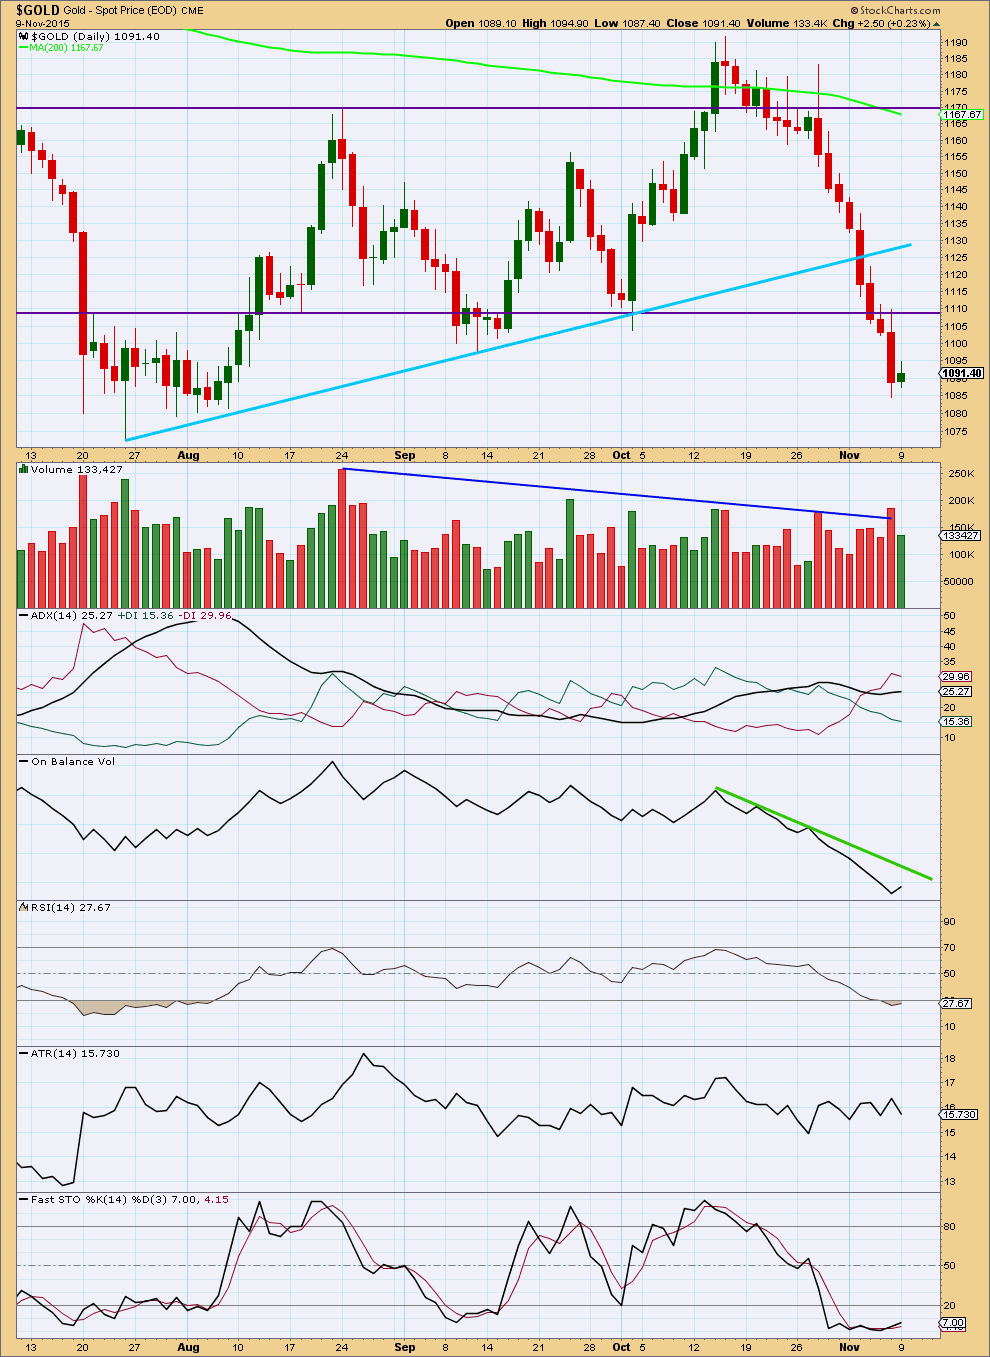
Daily: A decline in volume and range for Monday’s green candlestick looks corrective. This fits the Elliott wave count.
ADX still indicates a downwards trend is in place. ATR somewhat agrees: for recent movement higher lows and higher highs for ATR overall indicate an expanding range indicative of a trending market.
On Balance Volume may assist to indicate when the correction will end. If OBV comes up to touch the new green trend line, then at that time the correction may be complete. OBV should find resistance at that line.
This analysis is published about 08:10 p.m. EST.
With thin trading ahead and a bullish reversal off 1085, can expect an upturn / rally to test a break above 1102-03… Wouldnt trust the upside for long with 20dma fast approaching to drop below both 50dma and 100dma….
Does anyone know if Dust’s last three daily candles comprise a particular pattern? What is it named if so. (or GDX inversely) Thanks for taking a look.
I have not seen this pattern in past. but try this link???
https://www.google.com/search?q=candlesticks+patterns&biw=1366&bih=599&tbm=isch&tbo=u&source=univ&sa=X&sqi=2&ved=0CDYQsARqFQoTCNihjfqEh8kCFUozJgodAJoICw
yes, I’ve been googling chart patterns, thank you. I think Dust looks like a helicopter flying at me! Thanks Papudi and Robert for your responses.
Monday was Bearish Engulfing?
For those who were not aware: tomorrow, Nov 11th, is a holiday in the U.S.
Yes, but it’s a normal trading day for the stock markets and commodities. Bond markets are closed and trade settlements will not be processed until the next day.
Lara, are you indicating a very large volume spike for today’s oil close (doji) ??
No.
I’ve noticed sometimes close to the close of the NY session there is a volume spike for various markets…. which then disappears. Orders not filled?
It’s gone now.
From 1285 to 1092 = 7
Gold retraced to 1088= Fib .57
Wave 1 to wave 3 and now wave 3 of wave c.
Will wait for Lara’s wave count today/
The new low today may have been part of a running triangle or combination. Possibly a flat, but because minuette (ii) was a flat this is least likely.
I do not think the structure of minuette (iv) is over yet, but there is a very slim outside chance it could be. I can see a completed triangle in there. I’ll publish this idea today only because the strongest part of downwards movement is approaching and we don’t want to be surprised.
What is most likely at this stage is sideways movement in an ever decreasing range for a triangle, or complicated sideways movement for a combination. For another one day, or in the case of a triangle more likely three more days now.
Today fold needs to go higher than 1095.99. This will improve confidence in this wave count.
Possible explanation is expanded flat with C wave to now follow.
With an overnight high of 1,095.19 and a new gold low of 1,085.41 at 9:34 am today then it appears to me that the hourly II wave count from November 6th that only went up to about 1,096 on the chart then continues down now applies to gold instead of the hourly wave count last night.
Any comments or wave counts?
Lara-“The third hourly Elliott wave count is confirmed by a green daily candlestick.”
“The green candlestick on the daily chart for Monday’s session confirms the arrival of minuette wave (iv).”
Yes gold had a green candlestick.
I’m still questioning it because of a new low today.
That may make a difference to her count selection.
The count may change/adjust today. On the surface, it looks like gold just finished a B wave and is now in a C wave correction up.
Gold is likely still consolidating for a little longer. In the short term, gold should move up slightly to get rid of the oversold condition.
I won’t resurrect the first wave count, that would see subminuette iv showing up on the daily chart as a green candlestick where subminuette ii did not.
I think this is still more likely minuette wave (iv) unfolding as a flat, triangle or combination. At this stage my pick would be the triangle, it would give nice alternation with the flat of minuette wave (ii). MACD is closing in on the zero line. If it hovers about there then a triangle may be indicated.
An important read regarding this indicator “Step sum”. Must read for traders.
“Now I defer to my friend Mark Lundeen, who does compelling independent work using the step sum indicator he has developed. FLASH NEWS ALERT-The step sum is finally crashing. This indicates we are in the give it up final phase. There is no indication how long, but this is an important indicator that few even know exist.”
http://www.investing.com/analysis/bull-box-in-the-gold-market-270619
“The step sum is finally crashing.”
So what does that mean as far as per the direction and forecast of gold?
After studying Mr Lundeen’s work for more than a decade, he rates the highest score on my personal index of “Who on the Internet Knows What They’re Talking About”, right next to Jim Sinclare.
As for what this means, personally playing the “What Would Mark Say” game, I believe it would go something like this; “Expect swings in the POG approaching and exceeding $100 per day and in both directions until as many of the bears AND the bulls are suffering as much damage as the market can possibly inflict on them”.
Hope that helps Richard
Confessions of a Gold Analyst: Why I Use Elliott Wave – By Avi Gilburt
Friday November 06, 2015 13:50
http://www.kitco.com/commentaries/2015-11-06/Confessions-of-a-Gold-Analyst-Why-I-Use-Elliott-Wave.html
Good reasons for using Elliott wave. Thanks for sharing.
Thanks for sharing. Nice article.
But Mr. Elliott did not live to see the FOMC /NFP days where news causes the cycle change. If EW counts are there than he should have benefited from those days of change in gold dropping/up significantly in matter of seconds of news.
Nor Elliott had not seen the High Frequency trades (HFT) which distorts the market every nano second now.
From article: “Elliott was saying is that news does not “cause” the cycles, as most believe. Rather, news falls within the cycles. “
News still falls with the EW cycles in current days and in depression days 1929-1931… Lara has mentioned that about news many times and so has Avi.
It is commonly accepted that NEWS is neutral.
Reaction to news is what moves price.
In a bull market good news is amplified and exaggerated and bad news is discounted.
In a bear market bad news is amplified and exaggerated and good news is discounted.
In fact this behaviour comprises some of the personality of individual Elliott Waves.
News doesn’t cause the cycle change. If it did then EW would be useless. It may look like news causes the cycle change but it doesn’t, it only appears to cause it.
I notice that big moves in Gold, S&P and currencies (those markets I follow most closely) tend to be third waves, fifth waves (in the case of Gold, these are strong) and C waves. They fit perfectly into an Elliott pattern. And they often happen with a “news” announcement that traders react to. In the direction which fits the wave count.
I see the comment that high frequency trading is distorting the markets a lot. I have two responses to that.
Much of HFT is done to exploit small short term differences within markets which are normally the same. For example, to exploit a difference quoted for the same market in two different locations. It’s arbitrage and the result is to bring markets back into alignment.
And so if that is true then it’s not distorting the market, it’s adding liquidity and minimising geographical differences quoted within the same market.
The other thing that occurs to me about HFT is the programs are written by human beings with all of their biases and faults. The programs will reflect those biases and faults, and will be part of group behaviour.
It is a relief to have just 1 daily and 1 hourly chart and a bear.