
Sideways movement remains above the invalidation point on the hourly chart.
The short term Elliott wave count is changed slightly. The longer term picture is the same.
Summary: Both wave counts expect upwards movement this week to make a new high above 1,112.19. The main bear wave count requires upwards movement to a minimum at 1,125.13. The target for the alternate bull wave count is at 1,158.
New updates to this analysis are in bold.
Last published weekly charts with the bigger picture are here.
MAIN BEAR ELLIOTT WAVE COUNT
Click chart to enlarge.
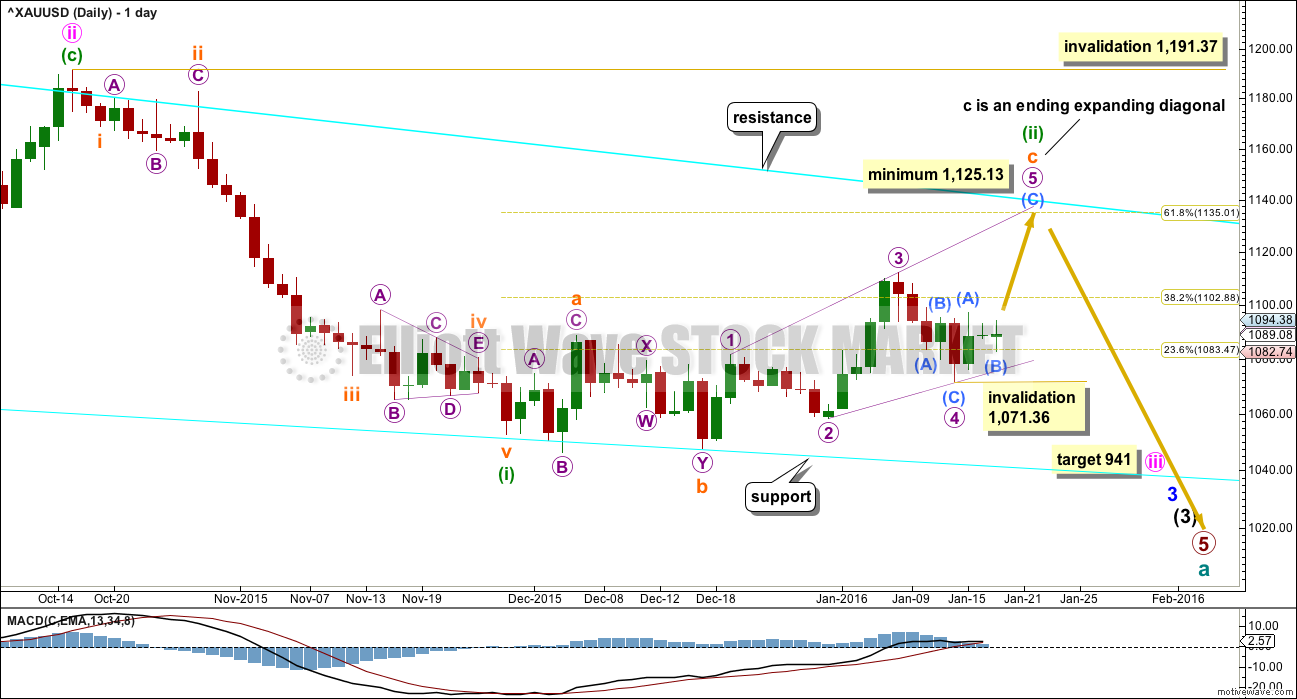
Gold has been in a bear market since September 2011. There has not yet been confirmation of a change from bear to bull, so at this stage any bull wave count would be trying to pick a low which is not advised. Price remains below the 200 day moving average and below the cyan trend line. The bear market should be expected to be intact until we have technical confirmation of a big trend change.
That technical confirmation would come with a breach of the upper cyan trend line by at least one full daily candlestick above and not touching the line. A new high above 1,191.37 would provide full and final price confirmation.
The final line of resistance (cyan line copied over from weekly charts) is only overshot and not so far properly breached. Simple is best, and the simplest method to confirm a trend change is a trend line.
Minute wave ii is a complete zigzag and deep at 0.73 the length of minute wave i.
At 941 minute wave iii would reach 1.618 the length of minute wave i.
Minuette wave (i) is complete.
Minuette wave (ii) looks like a fairly typical expanded flat correction which may end about the 0.618 Fibonacci ratio at 1,135.
Subminuette wave c may be unfolding as an ending expanding diagonal. Ending diagonals require all subwaves to subdivide as zigzags. Within the final zigzag of micro wave 5, submicro wave (B) may not move below the start of submicro wave (A) below 1,071.36. If the hourly chart is invalidated with a new low below 1,082.74, then submicro wave (B) may be continuing further. The invalidation point would then be at 1,071.36 for both charts.
The diagonal must be expanding because micro wave 3 is longer than micro wave 1, and micro wave 4 is longer than micro wave 2. The trend lines diverge. Micro wave 5 must be longer than micro wave 3, so it must end above 1,125.13.
There is still the possibility that minuette wave (ii) could be labelled as complete at the last high. If it was over, then the only structure I can see which would fit is a double combination. But double combinations are sideways structures; they should not have a slope against the trend one degree higher. This correction has a clear slope. For that reason I still do not want to publish this idea because the probability is too low. I will only publish it if price breaks below 1,058.42.
Click chart to enlarge.
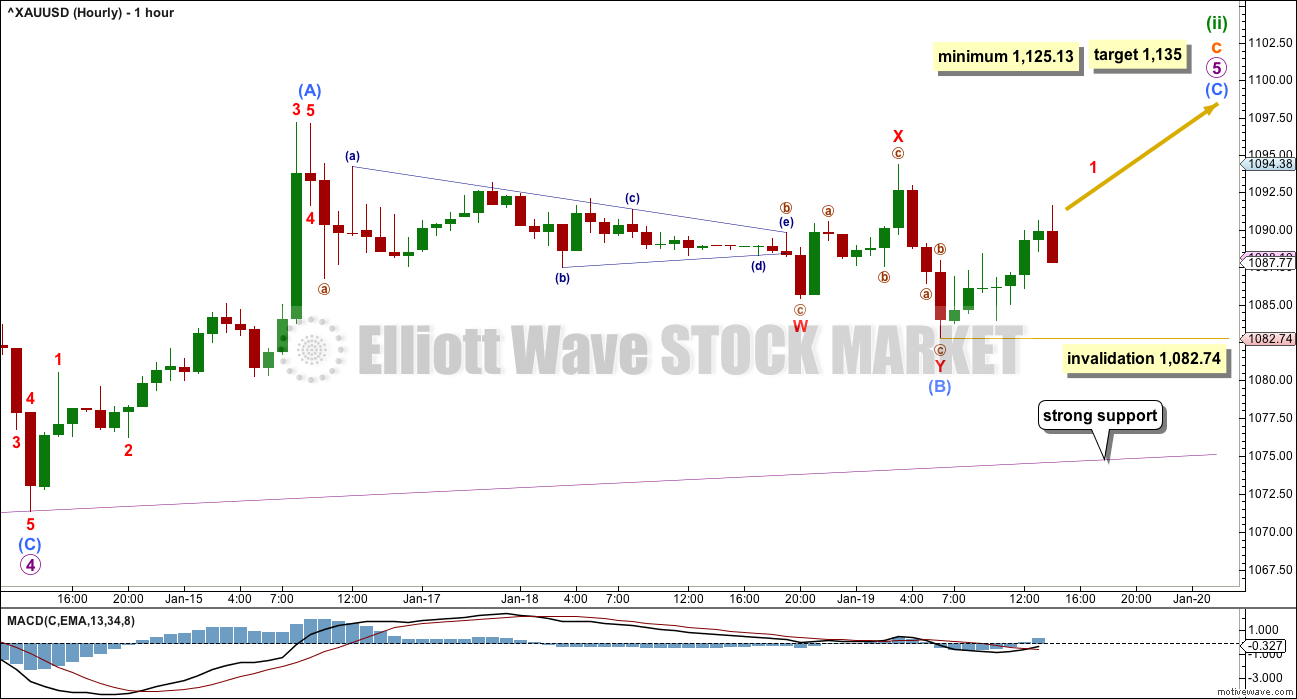
Micro wave 5 upwards is underway and must subdivide as a zigzag.
The diagonal is expanding, so micro wave 5 must be longer than micro wave 3. Micro wave 5 would reach equality with micro wave 3 at 1,125.13. It must end above this point.
The target will remain the 0.618 Fibonacci ratio at 1,135. The cyan line, the final bear market trend line on the daily chart, should provide strong resistance for this wave count.
The duration of this sideways movement is far too large to be part of the prior wave up, so it no longer looks right as a fourth wave correction.
The last wave up will not subdivide as a five wave impulse on the hourly chart. On the five minute chart, it will if it has a slightly truncated fifth wave.
Sideways movement over the last two days would then be submicro wave (B). This will subdivide as a double zigzag.
Submicro wave (C) may not exhibit a Fibonacci ratio to submicro wave (A). If it were to reach 1.618 the length of submicro wave (A), it would not be long enough and the minimum would not be met. If it were to reach 2.618 the length of submicro wave (A), price would breach the final bear market trend line. The target is not recalculated for this reason.
Submicro wave (C) must subdivide as a five wave structure, either an impulse or an ending diagonal. An impulse is more likely. Within submicro wave (C) no second wave correction may move beyond the start of its first wave below 1,082.74.
ALTERNATE BULL WAVE COUNT
Click chart to enlarge.
This was published here as a second alternate wave count. I will use it as the only regular alternate bull wave count because it is the only bull wave count to meet all Elliott wave rules.
I want to remind members that last time Gold saw a reasonable upwards movement from 24th July, 2015, to 15th October, 2015, there were many who expected that rise meant the bear market had ended and a new bull market had begun. It turned out that idea was premature: price turned around and made new lows. On 21st August I developed three bullish wave counts, partly in response to a demand from members, and one by one they have all been eliminated.
Now, again, price rises and there is a demand for bullish wave counts.
It is my strong view that this is premature. I will publish this wave count with that strong caveat.
Eventually the market will change from bear to bull, and when that change is confirmed that is the time to have confidence in a bull wave count. That time is not now.
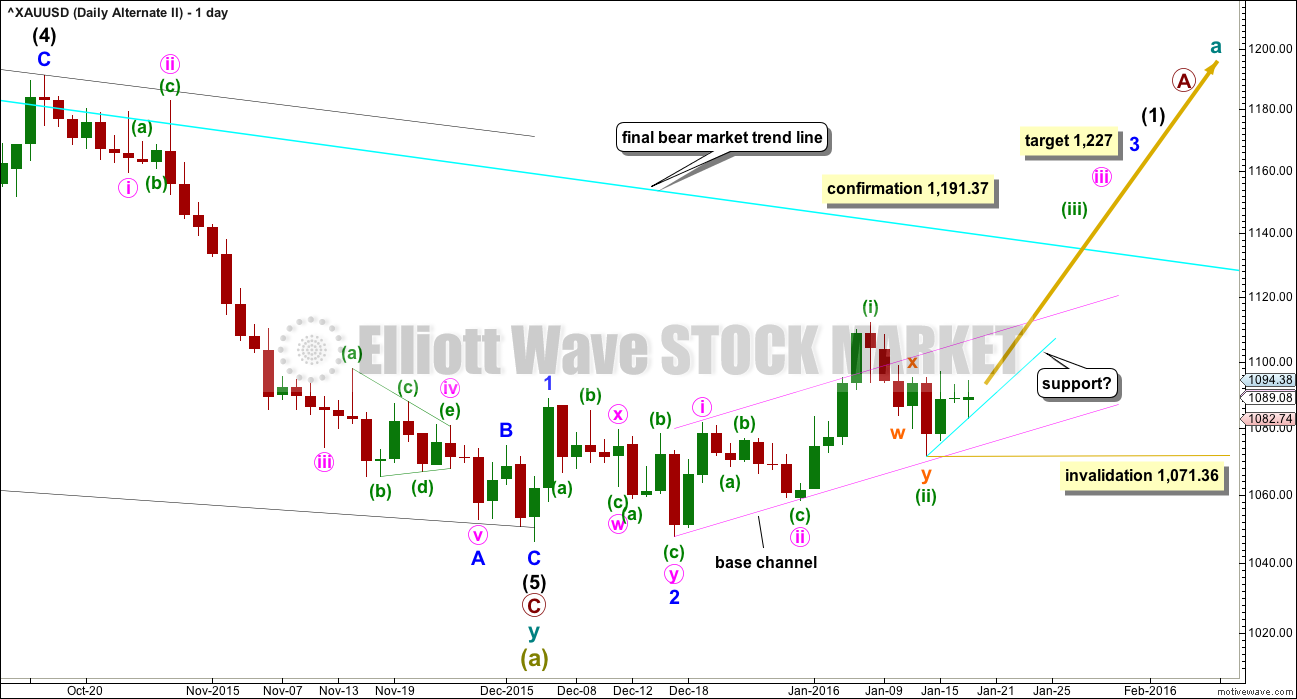
Price remains below the 200 day moving average. Price has made a series of lower highs and lower lows down to the last recent low. There is not a clear five up on the daily chart. Price remains below the bear market trend line. While price remains below that line this wave count will be an alternate and comes with a strong warning that it is premature.
Downwards movement from the all time high for this bull wave count is seen as a big double zigzag which would most likely be complete at super cycle degree for an A wave.
When an A wave subdivides as a three, then the larger structure may be either a flat or triangle. The B wave may make a new price extreme beyond the start of the A wave within flats and triangles. Here, super cycle wave (b) may move above 1,920.18 as in an expanded flat or running triangle.
When the first move of a larger correction subdivides as a multiple (w-x-y), then a combination may be eliminated. Combinations may not have multiples within multiples, because that would increase the number of corrective structures within a multiple beyond three and violate the rule.
A new wave up at super cycle degree must begin with a clear five up on the daily chart (and probably the weekly as well). So far only minor waves 1 and 2 are complete. At 1,227 minor wave 3 would reach 4.236 the length of minor wave 1.
Minute waves i and ii are complete within minor wave 3. The acceleration channel is not working, so a more conservative base channel is drawn about these two waves. Copy it over to the hourly chart. A lower degree second wave correction for minuette wave (ii) should not breach a base channel drawn about a first and second wave one or more degrees higher. The lower pink line should provide support, if this wave count is correct.
Minuette wave (ii) should now also be complete. A third wave at three degrees may be in the very early stages. Within minuette wave (iii), no second wave correction may move below the start of its first wave at 1,071.36. Minuette wave (iii) may only subdivide as an impulse.
For the short term, along the way up, for this wave count downwards corrections may find some support at the cyan trend line.
Click chart to enlarge.
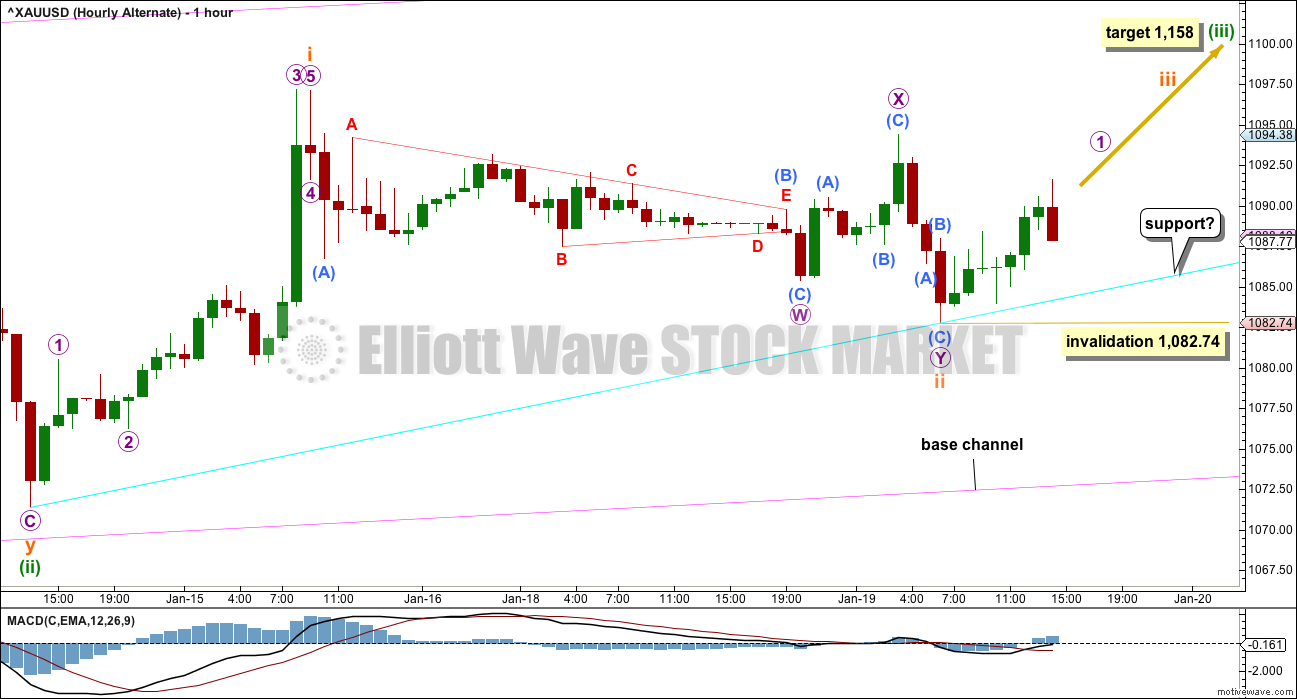
This wave count now sees a third wave up at three degrees in the very early stages. Upwards momentum should increase this week as new highs are made. Minuette wave (iii) must move above the end of minuette wave (i) above 1,112.19.
At 1,158 minuette wave (iii) would reach 1.618 the length of minuette wave (i). If price keeps rising through this first target, or if when price gets there the structure is incomplete, then the next target would be at 1,212 where minuette wave (iii) would reach 2.618 the length of minuette wave (i).
Minuette wave (iii) may only subdivide as an impulse. So far subminuette waves i and ii may be complete. No second wave may move beyond the start of its first wave at 1,082.74 within subminuette wave iii.
The cyan line is drawn also on this hourly chart. It may offer some support for corrections along the way up.
TECHNICAL ANALYSIS
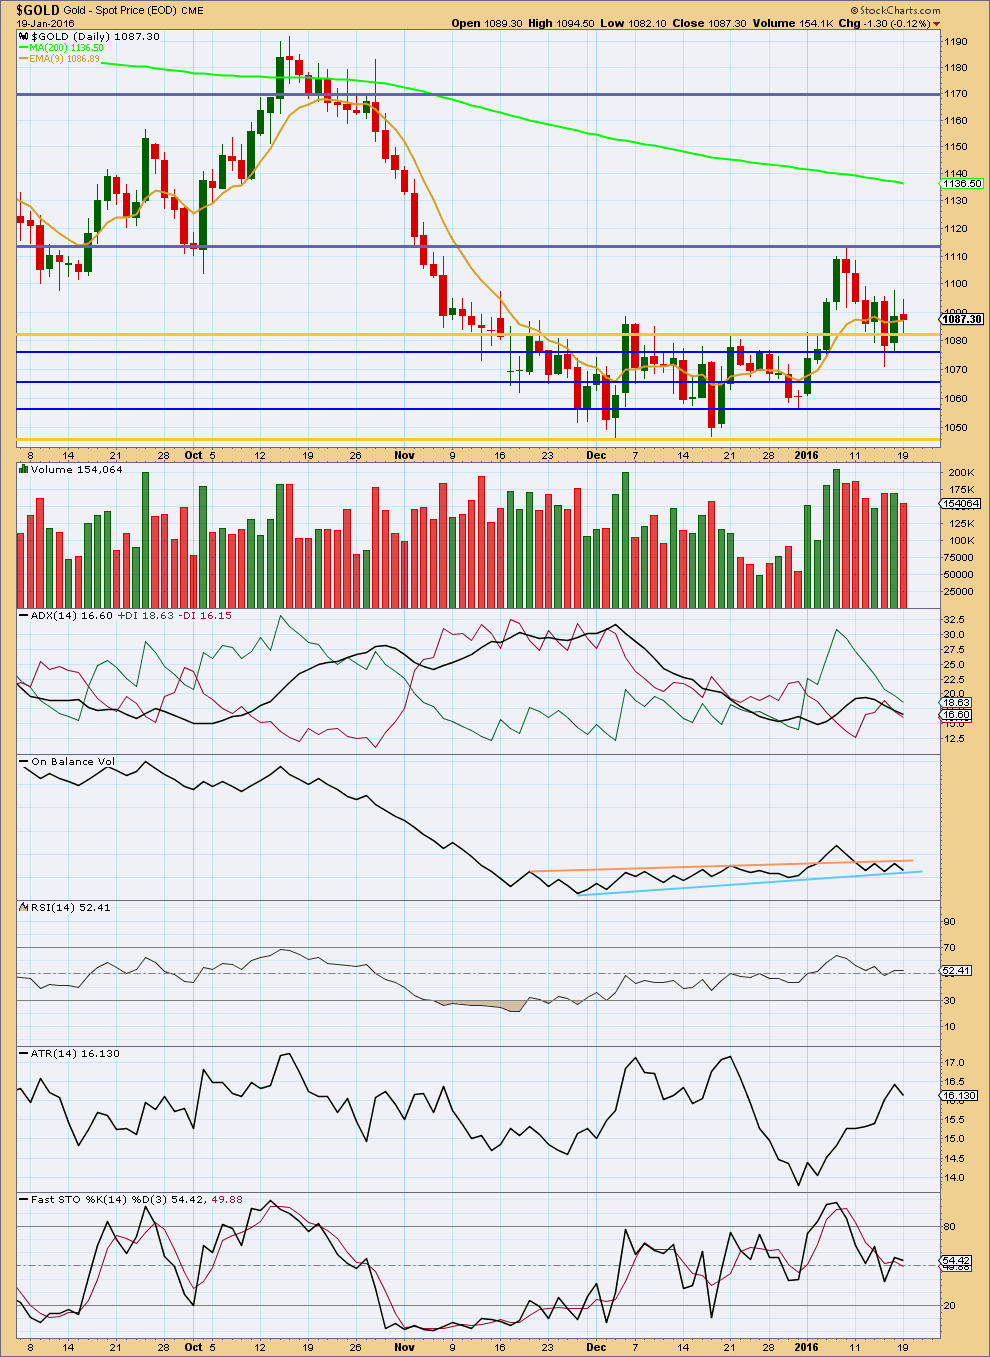
Click chart to enlarge. Chart courtesy of StockCharts.com.
This analysis is updated 7:08 p.m. EST after StockCharts volume data for the session is available.
The red candlestick for Tuesday’s session comes on a decline in volume. The fall in price was not supported by volume. This supports the Elliott wave counts in expecting more upwards movement.
The rest of this classic TA remains the same.
Overall the volume profile still indicates an upwards breakout is more likely than downwards. As price rose from 31st December to 8th January volume supported the rise in price. As price then fell to the low on 14th January it came on declining volume. This suggests an upwards trend is in place.
ADX does not yet indicate a new trend has begun, but this is a lagging indicator. It does not indicate a trend change either, the +DX line remains above the -DX line. ATR indicates the market is trending as it is increasing.
On Balance Volume is finding resistance at the peach line and support at the blue line. A breakout by OBV may indicate the direction that price may subsequently break out.
Both RSI and Stochastics are neutral. There is plenty of room for price to rise or fall.
This analysis is published @ 03:42 p.m. EST.
Huge reversal candlesticks pattern in general market across the board.
Bounce is coming. Time to short again on top of the bounce.
January 7th gold at 1105 and GDX at 15.01 last high, now gold 1102 and GDX at 12.81 because way oversold and short term bottomed Tuesday.
NUGT broke it’s downtrend line from Jan 8. Chart by Above the Green Line
Cool Bullish NUGT chart thank you.
Freamer
Lara wrote: “My S&P analysis expects that the middle of the big third wave has still not passed.”
Can you explain what middle of the third wave means????
My EW count has S&P approaching the middle of an intermediate wave (3).
It started with a series of first and second waves.
It has to pass the middle.
Then it will keep going down with a series of fourth wave corrections along the way.
The target for intermediate (3) is 1,428.
I will be waiting for StockCharts volume data today before I’m going to publish the analysis.
It means I don’t have to go back twice.
For now I cannot see a complete five up on the hourly chart. There is too much overlapping there.
I need to spend some time on a lower time frame, maybe 15 minute today, to look more closely at the subdivisions in this upwards move.
For now, just remember, the trend is up for Gold. There will be corrections along the way, they represent opportunities to join the trend.
Todays analysis will be again pretty much the same.
Gold still has to make a new high above 1,112.19.
This is either the early stage of a good strong third wave up, or it’s the end of a C wave.
The price point in future that will differentiate those ideas will be 1,097.16. The bear will need a new low below that while the bull will be invalidated.
But that is days away yet, maybe even a couple of weeks. For now the trend is up.
Price is finding resistance at the upper edge of the base channel on the bull count. If that line is breached it may provide support.
Matt
According to Lara’ fabulous EW count SPX has met the minuette iii target below 1818.
If this wave count is still valid than SPX should go in a shallow corrective wave iv no higher than 1990.
I plan to short the market then.
Warning wave count and target may have changed.
My S&P analysis expects that the middle of the big third wave has still not passed.
In that market I’m just jumping in and holding short. Adding to my position on corrections.
But right now I’m expecting it to just fall off a cliff. Corrections should now start to be quick and shallow as the middle of a huge third wave passes.
Todays long red candlestick for S&P should be duplicated with maybe longer red candlesticks for a few days.
That is my expectation anyway at this stage, looking at momentum on the hourly chart.
Stock bloodbath.
12:35pm
Only 3 stocks in the Nasdaq 100 are trading higher
12:34pm
Only 10 stocks in the S&P 500 are gaining ground
Gold up $20 but miners get no respect and drop with oil the mother of commodities.
Excellent gold analysis, Lara. You nailed it!
Yay!
So happy this morning.
Nailed Gold. Nailed FTSE. And S&P. And Oil.
And my trading account has a nice fat profit from FTSE, S&P and Oil.
Anyone observing the utter carnage in US stocks today? S&P broke to another new low. Gold is receiving a good lift from this.
At some point, in the near future, the S&P will have a corrective rally which will snuff out gold.
Gold and miners turned up strong today. Go GDX go!
BELIEVE!!!
IN LARA!
For AVI G followers:
Final Run To Lower Lows Setting Up (GDX)
This past week, when the market chose to not take this corrective rally higher, it may have provided our answer. With the more complex w-x-y pattern seemingly completing this past week, and with what seems to be a nice 5 wave structure having developed to the downside in GDX, it looks like we have our set up for the final drop.
Breaking below the market pivot on the 8 minute chart without being able to move back over it is confirmation that we are likely heading down to the 9.65 region to potentially complete this 4+ year correction.
http://www.321gold.com/editorials/gilburt/gilburt012016.html
Has any one experienced such huge divergence between Gold price and Miners in the past????
Miners and indices are all time low while POG is moving higher and EW count expecting higher prices to $1135.
GDX is on the brink of annihilation to down side.
May be it will change this week. Who knows????
See my thoughts on GDX post
GDX has been updated: http://elliottwavegold.com/2016/01/gdx-elliott-wave-technical-analysis-19th-january-2016/#comment-56477