
A small inside day fits both hourly Elliott wave counts, which remain the same.
Summary: The correction is still most likely to end sooner rather than later. It may end with a final push up to a short term target at 1,091. In the short term, a new high reasonably above 1,081.5 would indicate the final push up is underway towards the target and the violet channel on daily and hourly charts. Also in the short term, a new low below 1,062.6 would be earliest indication that the correction of the last 26 days is over. The breakout is still expected to be downwards.
New updates to this analysis are in bold.
To see the last long term analysis with weekly charts click here.
MAIN ELLIOTT WAVE COUNT

Click chart to enlarge.
Gold has been in a bear market since September 2011. There has not yet been confirmation of a change from bear to bull, and so at this stage any bull wave count would be trying to pick a low which is not advised. Price remains below the 200 day moving average and below the cyan trend line. The bear market should be expected to be intact until we have technical confirmation of a big trend change.
The final line of resistance (cyan line copied over from weekly charts) is only overshot and not so far properly breached. Simple is best, and the simplest method to confirm a trend change is a trend line.
Minute wave ii is a complete zigzag and deep at 0.73 the length of minute wave i.
At 930 minute wave iii would reach 1.618 the length of minute wave i.
Minuette wave (i) is complete.
This main wave count today looks at the possibility that minuette wave (ii) is an almost complete double combination: an expanded flat for subminuette wave w, a three in the opposite direction labelled X, and the second structure for subminuette wave y an almost complete zigzag.
MAIN HOURLY WAVE COUNT
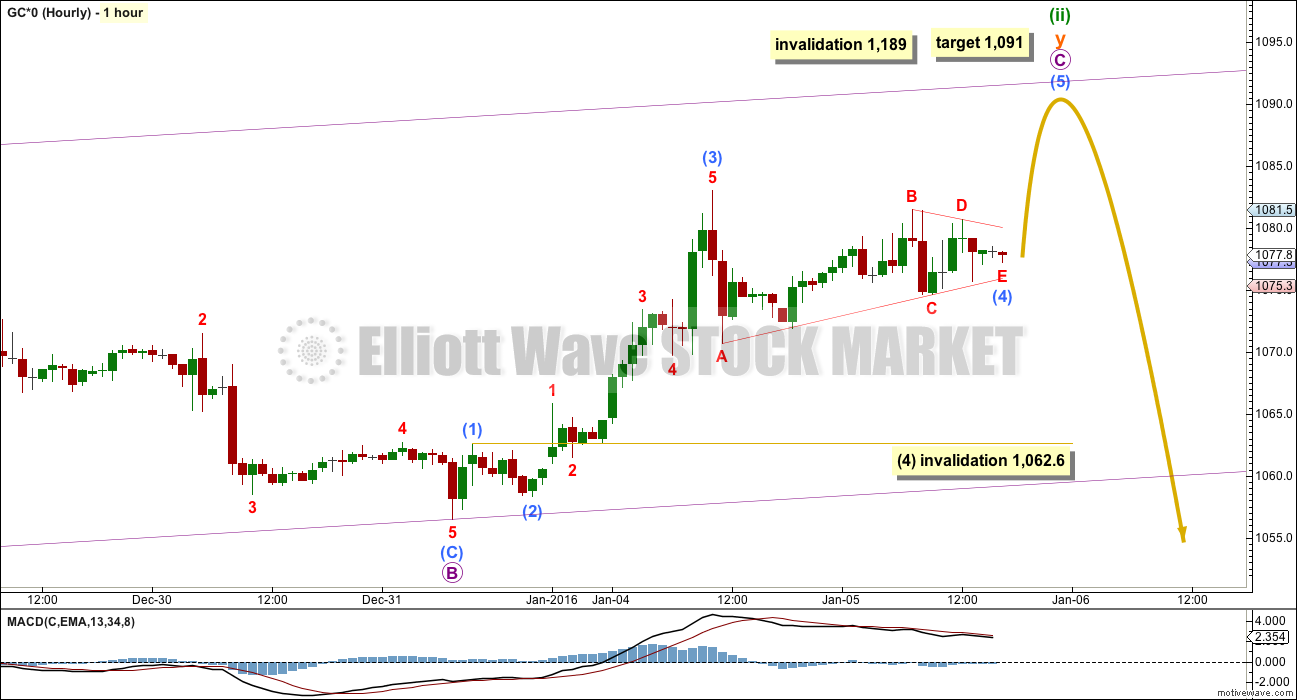
Click chart to enlarge.
There are several structural possibilities for a second wave correction. The only structures the second wave correction may not be are triangles. At this stage, minuette wave (ii) may be an almost complete combination or it may be a flat correction (alternate wave count).
This main wave count expects it is an almost complete combination with the second structure in the double a simple zigzag labelled subminuette wave y.
At 1,091 micro wave C would reach equality in length with micro wave A. The violet channel is copied over from the daily chart. Look for price to find resistance at the upper edge of this channel, if it gets that high.
It is still possible that the whole correction for minuette wave (ii) could come to a relatively swift end. Price has drifted sideways in a narrow range today. This fits perfectly as a fourth wave triangle which is either complete or extremely close to completion. If this wave count is correct in the labelling of the triangle, then the breakout from it should be upwards. Fifth waves to follow fourth wave triangles for Gold are sometimes surprisingly short and brief. If the target for this main wave count is wrong, it may be a little too high.
Submicro wave (4) may not move into submicro wave (1) price territory below 1,062.6. In the short term, a new low below 1,062.6 could not be a fourth wave correction which would mean that the impulse of micro wave C would have to be over.
The triangle will remain valid while price remains above 1,070.7. Within the triangle, if minuscule wave C is unfolding as a time consuming structure, then it may not move below the end of minuscule wave A.
If price breaks reasonably above 1,081.5, then the triangle is most likely over and the final fifth wave up should then be underway. At that stage, upwards movement may not be minuscule wave D continuing higher as it may not move substantially above minuscule wave B. If upwards movement continues high enough that the B-D trend line of the triangle no longer looks flat, then expect the triangle is complete. Unfortunately, this price point is not black and white because for a barrier triangle minuscule wave D may end a little above minuscule wave B as long as the B-D trend line remains “essentially flat”.
If price moves higher as expected, then the minimum expectation would be for submicro wave (5) to move at least slightly above the end of submicro wave (3) to a new high above 1,083 to avoid a truncation. If price comes up to touch the upper edge of the violet channel, it may end there.
ALTERNATE DAILY WAVE COUNT
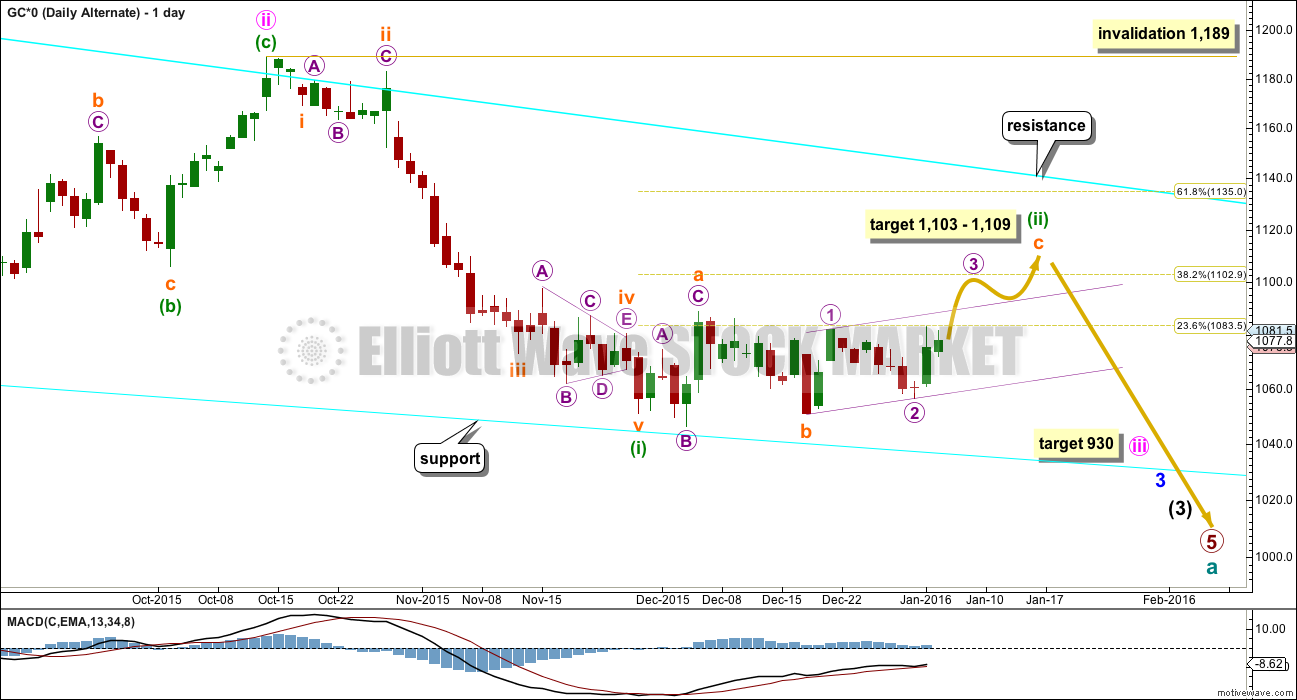
Click chart to enlarge.
This wave count is identical to the main daily wave count up to the low labelled minuette wave (i).
Thereafter, it looks at the possibility that minuette wave (ii) is unfolding as a flat correction. Within the flat, subminuette wave a is a three and subminuette wave b is a three and 1.06 the length of subminuette wave a. This would be an expanded flat correction.
At 1,109 subminuette wave c would reach 1.618 the length of subminuette wave a. This is somewhat close to the 0.382 Fibonacci ratio at 1,103 giving a $6 target zone.
Subminuette wave c must subdivide as a five wave structure.
This alternate expects a slower end to the correction of minuette wave (ii). So far it has lasted 26 days. If it exhibits a Fibonacci duration, it may continue for a further 8 days to total a Fibonacci 34.
ALTERNATE HOURLY WAVE COUNT
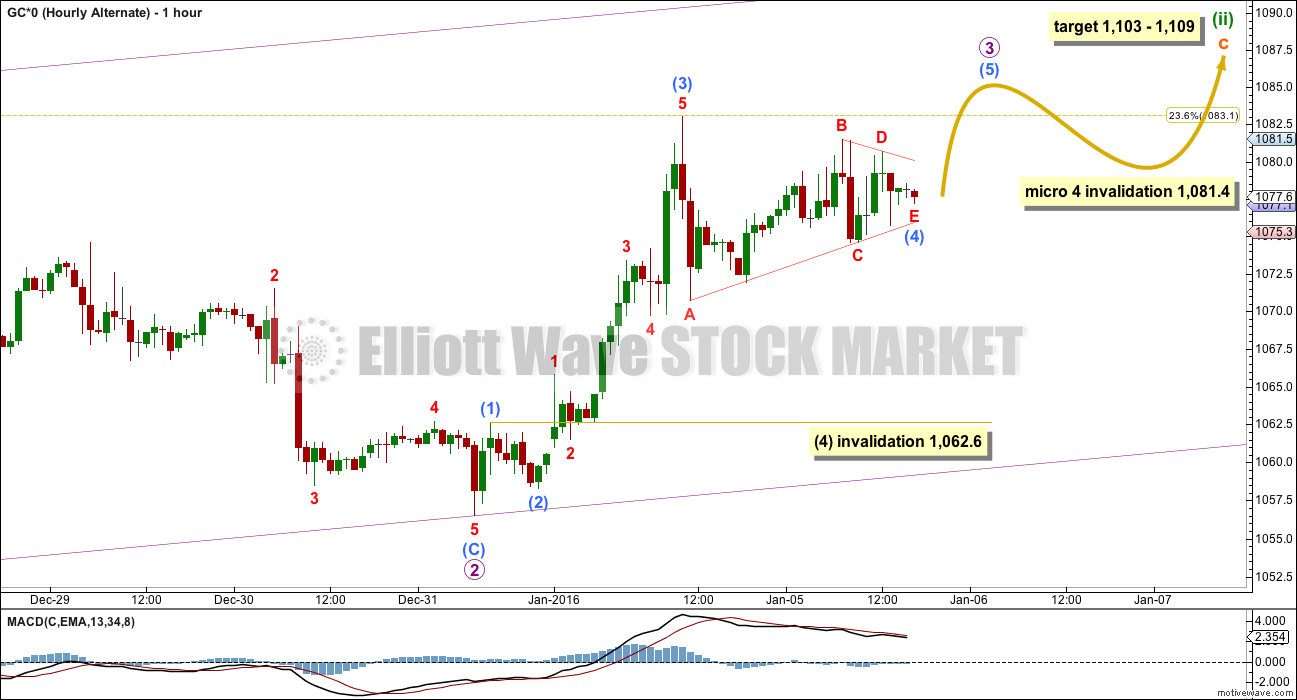
Click chart to enlarge.
This alternate wave count follows on directly from the alternate in last analysis.
The structure of subminuette wave c is an incomplete impulse.
I would not consider labelling subminuette wave c over at the high labelled micro wave 1 (seen on the alternate daily chart) because it would be truncated by 6.9. The truncation would be very large for this small correction and minuette wave (ii) would be a very rare running flat correction. The size of the truncation and the rarity of the structure make the probability of that idea very low indeed. What is much more likely is subminuette wave c would be incomplete.
Micro waves 1 and 2 are complete within subminuette wave c.
Micro wave 3 must move higher, high enough to allow room for downwards / sideways movement for micro wave 4 to unfold and remain above micro wave 1 price territory at 1,081.4.
The short term outlook for both wave counts is the same, which gives a little more confidence to expectations of what should happen next. The violet channel is drawn on both wave counts today in the same way. Here it is a base channel about micro waves 1 and 2. Micro wave 3 should have the power to break above the upper edge of the base channel, and once above it the upper edge should then provide support.
In the short term, a fourth wave triangle should be either complete now or very close indeed to completion. Reasonable movement above 1,081.5 would indicate it is over.
When micro wave 3 could be seen as a complete five wave structure upwards, then the invalidation point for this alternate will be at 1,081.4. At that stage, movement below 1,081.4 would invalidate this alternate and provide confirmation for the main wave count.
SECOND ALTERNATE ELLIOTT WAVE COUNT
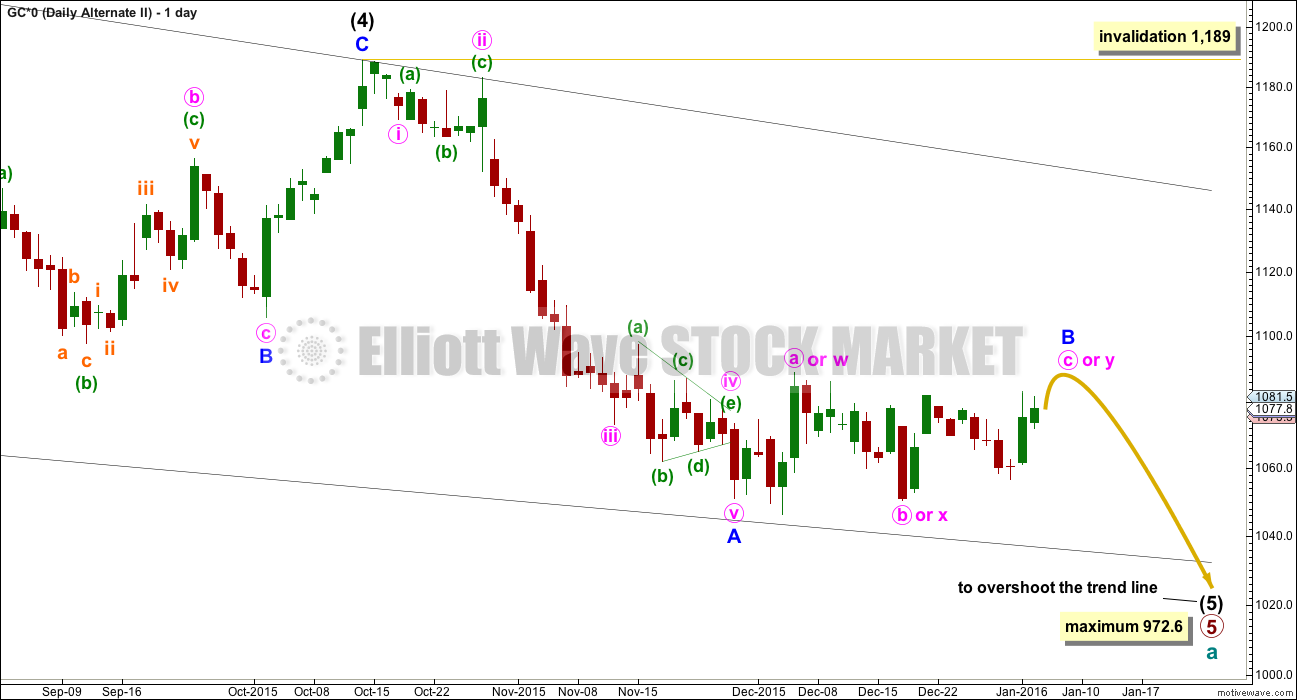
Click chart to enlarge.
I am aware that this is the wave count which EWI and Danerics have. The implications are important, so I will follow this wave count daily for members here too.
Everything is the same up to the end of the triangle for primary wave 4 (see weekly charts for this larger structure). Thereafter, primary wave 5 is seen as an ending contracting diagonal.
Within the ending contracting diagonal, it is not possible to see intermediate wave (2) as a zigzag and meet all Elliott wave rules. To see an explanation of why see this video at 10:25.
The same problem exists for the ending diagonal of primary wave 5 itself. Intermediate wave (3) is longer than intermediate wave (1) which would suggest an expanding diagonal, but intermediate wave (4) is shorter than intermediate wave (2) and the trend lines converge which suggests a contracting diagonal.
From “Elliott Wave Principle” by Frost and Prechter, 10th edition, page 88: “In the contracting variety, wave 3 is always shorter than wave 1, wave 4 is always shorter than wave 2, and wave 5 is always shorter than wave 3. In the expanding variety, wave 3 is always longer than wave 1, wave 4 is always longer than wave 2, and wave 5 is always longer than wave 3.”
This structure violates the rules for both a contracting and expanding variety. If the rules in Frost and Prechter are accepted, then this is an invalid wave count.
It may be that the rules need to be rewritten to add “sometimes a third wave may be the longest within a contracting or expanding diagonal”. But I have never seen Robert Prechter publish such a rule, I do not know that it exists.
I cannot reconcile this wave count from EWI with the rules in Frost and Prechter.
If an ending contracting diagonal is unfolding, then the (1) – (3) trend line may be overshot signalling the end of intermediate wave (5). If price behaves thus and turns around and moves strongly higher, then this wave count must be accepted and the rules for diagonals will need to be rewritten.
I will continue to follow this possibility as price moves lower.
Intermediate wave (5) should be shorter than intermediate wave (1). At 972.6 intermediate wave (5) would reach equality in length with intermediate wave (1). A new low below this point would take this possible diagonal structure too far from the rules. At that stage, it really should be finally discarded.
All sub waves within ending diagonals must subdivide as zigzags. Within the zigzag of intermediate wave (5), minor wave B may either be an incomplete combination or flat correction as per the main and alternate hourly wave counts above. They work in exactly the same way for this alternate at the hourly chart level.
Minor wave B may not move beyond the start of minor wave A above 1,189.
For this ending diagonal idea, the final fifth wave of intermediate wave (5) should be expected to overshoot the (1)-(3) trend line, which is a very typical look for contracting diagonals. What that means is if price moves lower and it overshoots the lower black line (which is the same as the lower cyan line on the main wave count), then look out for a possible end to this bear market.
At that stage, any shorts should be carefully handled. Manage risk so that your account is not left exposed at that stage to a potential major trend change.
Minor wave B is incomplete at this stage. A final target for minor wave C may be calculated when minor wave B may again possibly be complete. That cannot be done today.
The same idea for Silver now works on COMEX data. An ending expanding diagonal, which meets all Elliott wave rules, may be close to completion for Silver. This adds slight support to this alternate idea for Gold.
TECHNICAL ANALYSIS
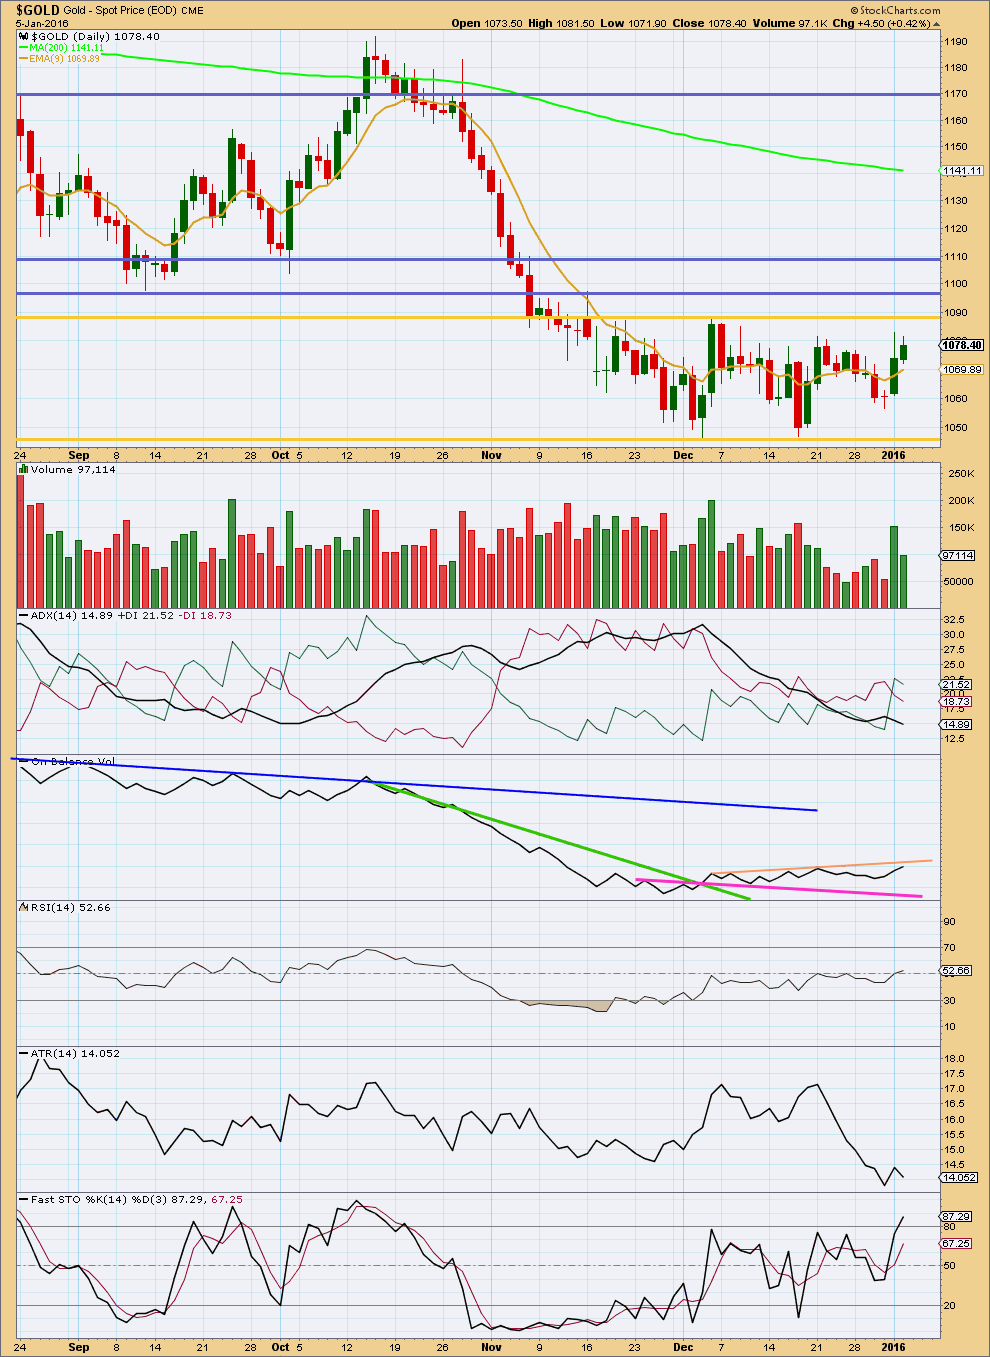
Click chart to enlarge. Chart courtesy of StockCharts.com.
Upwards movement for Tuesday comes with a decrease in volume. The rise in price was not supported by volume, so is suspicious. This makes sense if this movement for Tuesday was a fourth wave triangle which supports the Elliott wave count in the short term.
Stochastics is now reaching overbought and price is close to resistance. A range bound system would expect the end to upwards movement about here or very soon, and the start of the next swing down to support.
If the first day of the consolidation is considered (4th December), then the strongest volume during the consolidation is for an upwards day. This would suggest that an upwards breakout is more likely than downwards.
Of more recent days, the downwards day of 17th December was the strongest.
Today ADX is declining indicating no clear trend. ATR is also declining today and overall has been declining since 21st December. There is no clear trend, so the market is confirmed as range bound.
On Balance Volume works best with trend lines. The bottom line to this classic technical analysis is price (and OBV) remains range bound. We need to be patient and wait for a breakout. The Elliott wave analysis expects the breakout should be downwards, Gold remains in a bear market, but short term volume suggests the breakout may be upwards.
We need to see price break either above or below the Gold trend lines which delineate this consolidation.
On Balance Volume may be a leading indicator of the breakout direction. If OBV breaks above its peach line, then expect an upwards breakout from price. If OBV breaks below the pink line, then expect a downwards breakout from price. OBV is very close to finding resistance at the upper peach line today. This line should be watched closely for the next day or two to see if it holds.
This analysis is published @ 05:47 p.m. EST.
Now the main and alternate diverge.
The main hourly wave count expects price to turn around and move lower from here. The confirmation point is 1,081.4. A new low below this point would indicate that Gold has likely ended the correction and may be on the way down.
For a reasonable amount of confidence in that idea we really should be waiting to see the violet channel breached.
Classic TA would wait for a breakout to new lows. On a day with increased volume.
The alternate now expects a fourth wave correction to drift sideways from here for a few days, but it must remain above 1,081.4. When that is done more upwards movement to the target for the alternate at 1,103 – 1,109.
There is another structural possibility for subminuette c on the alternate. It could be a diagonal. What if my analysis of micro waves 1 and 3 is wrong? What if they were zigzags not impulses? (these two structures can look similar sometimes). The invalidation point for the fourth wave of that possibility would be at 1,056.5.
And so a conservative confirmation point for a resumption of the downwards trend would be 1,056.5. A new low below that point would give a reasonable amount of confidence that the correction is ending and Gold will break out downwards.
Thinking that the 2PM minutes of FOMC will strengthen the US dollar and drop gold IMHO
That would tend to fit in with Lara’s analysis main wave as gold already exceeded 1,091 target as hit 1,093.03 at 9:32 am at the violet channel of resistance.
Any wave counts?
It looks like main wave count acted out quickly and moved up to 1,191 actually to 1,193.03 at 9:32 am at the violet line of resistance.
I’m thinking gold may drop today.
FED FOMC minutes at 2:00 pm EST today.
This does not look too pretty… There is no let up. Gold price coasting above 1089 opens up 1097+….
FED FOMC minutes out today Wed at 2:00 pm EST
http://www.marketwatch.com/story/what-time-do-the-fed-minutes-come-out-2016-01-06
Added 1/3 NUGT in pre market. Going to sit on my hands now. Good luck everyone!
Gold spiked as flight to safety as markets drop due to North Korea ‘Nuclear’ bomb test and other geo political risks escalate also quick 5th EW wave now.
9:18am Gold flirts with best level in about 2 months on global turmoil
9:10am ISIS attacks on Libya oil tanks fuel supply concerns: DJ
9:00am U.S. stocks set to tumble as North Korea worries roil markets
Gold at 1091 9:30 am the main fast target and may be peaking now???
Per Lara’s analysis gold break out.
A break out from bullish flag may be long lasting to $1140 and higher. Also depends on COT.
humm, thanks for input. I am guessing since none of Laura’s analysis have targets that high, if we get higher prices like that, the Alt ED is playing out.
Depends how gold ends today whether in the channel or above the channel.
Added another 1/3 GDX March Calls, now long 2/3 position. I will hold the last 1/3 in cash for now, no intent to use it unless the set up is there. COT cut off was today, report on Friday. Blue line bottoms on 1/8.
Good luck all.
Gold may have established a double bottom. A new beginning for gold from here higher high above 1190???
Is it possible?
IMHO: The upsidse risk for now is 1118 (a 50% retrace) with 1168 on the outside… There are previous highs 1088-89 and 1098 that Gold price would need to demonstrate to take out to move up further…. For todays trade (Wednesday), gold price is looking to top and ought to pullback (drop)… remains to be seen if can get above the upper band to test a break above 50dma…. Short and holding, no interest in Buy…. Good luck~!
Important note to ETF, ETN and stock traders…
Both NYSE and NASDAQ are terminating all stop-loss and good-til-canceled orders effective Feb. 26, 2016. IMO this will hurt liquidity.
Of course this doesn’t affect futures traders. IMO it’s another good reason for specs to trade futures instead of funds.
I cannot access yesterday’s post for OIL when I click on it (in Firefox and IE).
Is anyone else having that problem? Bad link?
no problem here viewing 1/4
and thanks for reminder about etns etfs.
Might add that I can still access earlier US OIL posts fine. Just not the Jan 4 one.
here’s the synopsis for 1/4/16
“The Elliott wave count remains the same.
There is still only one Elliott wave count for US Oil.
Summary: A fifth wave down to end a third wave may have begun. For confidence in this idea, price needs to break below the upwards sloping cyan trend line on the classic technical analysis chart and On Balance Volume needs to break below its two blue trend lines on the same chart. Fifth waves to end third waves are often the strongest part of the trend for commodities. The target for this trend is 29.21 which may be met in twelve days time.”
Ok, thanks.
We changed the products available here on EWG back (I think) in September 2015. After that date if you signed up for Gold analysis only then you should be accessing Gold analysis only. Gold Plus members get everything and US Oil / Silver members get access to Oil and Silver only.
But what happened after the new products were launched is the permissions for the last three months have been set wrong. So if you signed up for Gold only you have incorrectly been given access to Oil and Silver as well.
However, all those who were members prior to the change in September should always have access to all my analysis as a Grandfather deal.
And so it depends when your membership began. If it was prior to the change when there was only the one product you should have access. If it was after the change and you signed up for Gold only membership then you won’t have access to Oil and Silver anymore.
I am sorry for the confusion. Sometimes the membership software and settings can be a bit confusing on the back end, that’s why it happened. At least no one was denied access to something they had paid for.
And so if you need further clarification Judy please email me and I’ll sort it out. admin@elliottwavegold.com. Same goes for all members, if you have any questions.
Thanks!