
A short term target for a fourth wave correction to begin was 1,113. Price turned at 1,112.19.
Summary: Next week should see choppy overlapping sideways movement for a fourth wave correction.
New updates to this analysis are in bold.
To see the last long term analysis with weekly charts click here.
MAIN ELLIOTT WAVE COUNT
Click chart to enlarge.
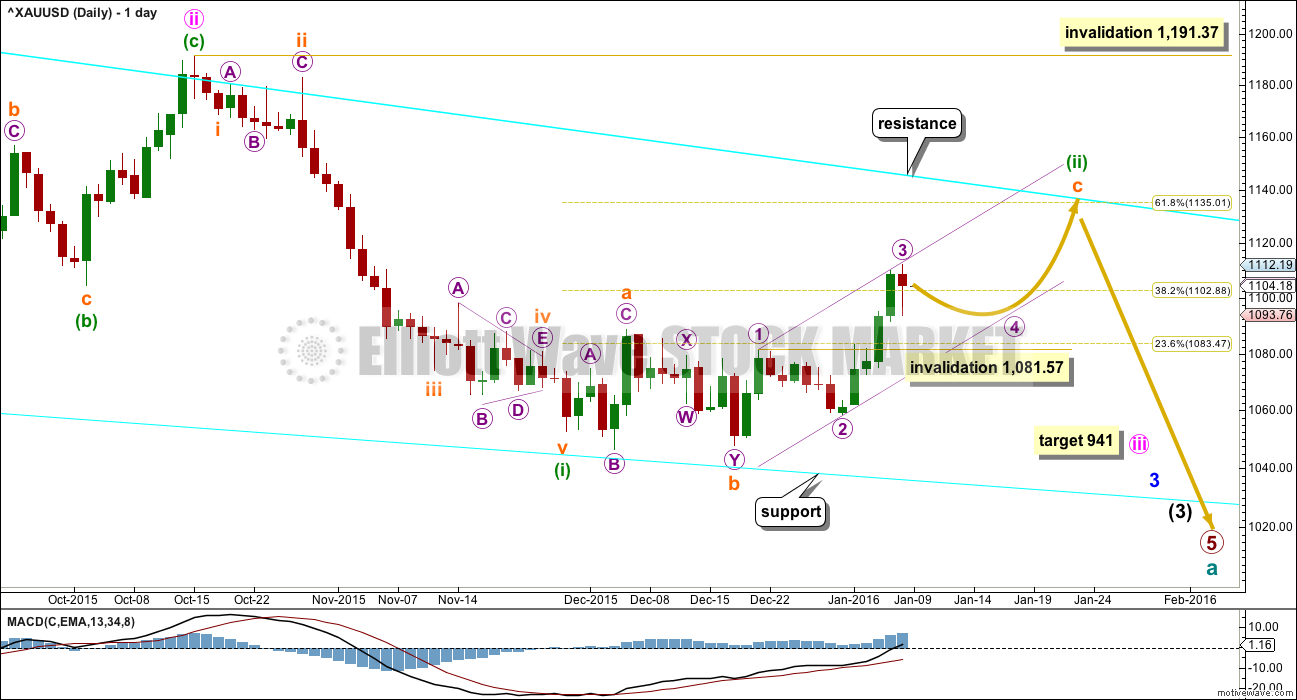
Gold has been in a bear market since September 2011. There has not yet been confirmation of a change from bear to bull, and so at this stage any bull wave count would be trying to pick a low which is not advised. Price remains below the 200 day moving average and below the cyan trend line. The bear market should be expected to be intact until we have technical confirmation of a big trend change.
That technical confirmation would come with a breach of the upper cyan trend line by at least one full daily candlestick above and not touching the line. A new high above 1,191.37 would provide full and final price confirmation.
The final line of resistance (cyan line copied over from weekly charts) is only overshot and not so far properly breached. Simple is best, and the simplest method to confirm a trend change is a trend line.
Minute wave ii is a complete zigzag and deep at 0.73 the length of minute wave i.
At 941 minute wave iii would reach 1.618 the length of minute wave i.
Minuette wave (i) is complete.
Minuette wave (ii) looks like a fairly typical expanded flat correction which may end about the 0.618 Fibonacci ratio at 1,135.
Draw a channel about subminuette wave c using Elliott’s first technique: draw the first trend line from the ends of micro waves 1 to 3, then place a parallel copy on the end of micro wave 2. Look for micro wave 4 to find support at the lower edge of the channel. Copy the channel over to the hourly chart.
MAIN HOURLY WAVE COUNT
Click chart to enlarge.
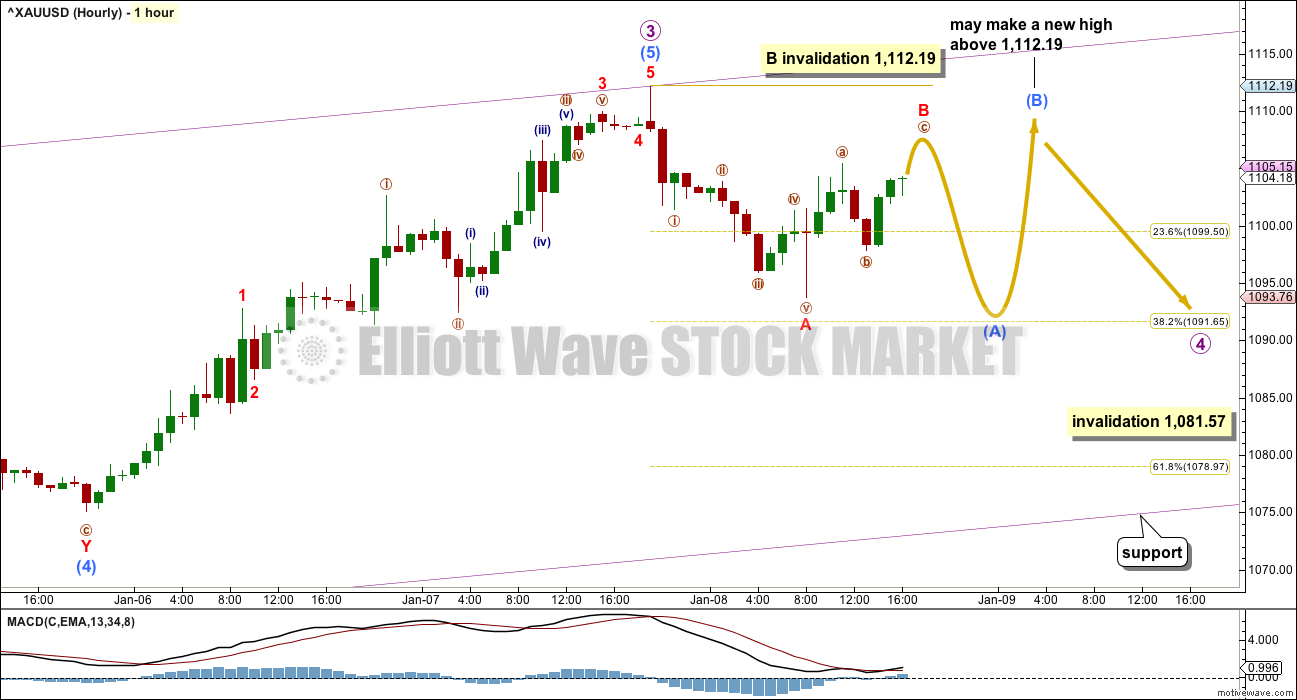
Micro wave 3 is a complete five wave impulse and 1.05 short of 1.618 the length of micro wave 1.
Micro wave 2 was a deep 0.66 zigzag. Given the guideline of alternation micro wave 4 may be expected to be a shallow flat, combination or triangle. It is most likely to end about the 0.382 Fibonacci ratio at 1,092.
Micro wave 1 lasted one day, micro wave 2 lasted 7 days, and micro wave 3 lasted 5 days. Micro wave 4 may be expected to last either a Fibonacci 5 or 8 days most likely.
The first move within micro wave 4 is most likely to be a zigzag downwards for submicro wave (A). There is a five wave impulse down for minuscule wave A so far within this zigzag. This should be followed by a three up for minuscule wave B which may not move beyond the start of minuscule wave A above 1,112.19.
Thereafter, another five down would complete a zigzag.
If submicro wave (A) subdivides as a three, then submicro wave (B) may make a new price extreme above the start of submicro wave (A) at 1,112.19 as in an expanded flat or running triangle.
A new high above 1,112.19 in the next few days does does not mean that this correction for micro wave 4 is over. A new high would most likely be part of the correction.
There are 23 possible structures a fourth wave may take. It is impossible to tell which one it will be at this early stage, and we may not be sure which one it is until it is complete. My focus during corrections is not to predict the exact pathway price should take during the correction, but to determine when it is over and when the trend should resume.
The labelling of this structure will probably change as more of this structure unfolds.
Micro wave 4 may not move into micro wave 1 price territory below 1,081.57.
ALTERNATE DAILY WAVE COUNT
Click chart to enlarge.
This was the second alternate yesterday. It is the only alternate today.
I am aware that this is the wave count which EWI and Danerics have. The implications are important, so I will follow this wave count daily for members here too.
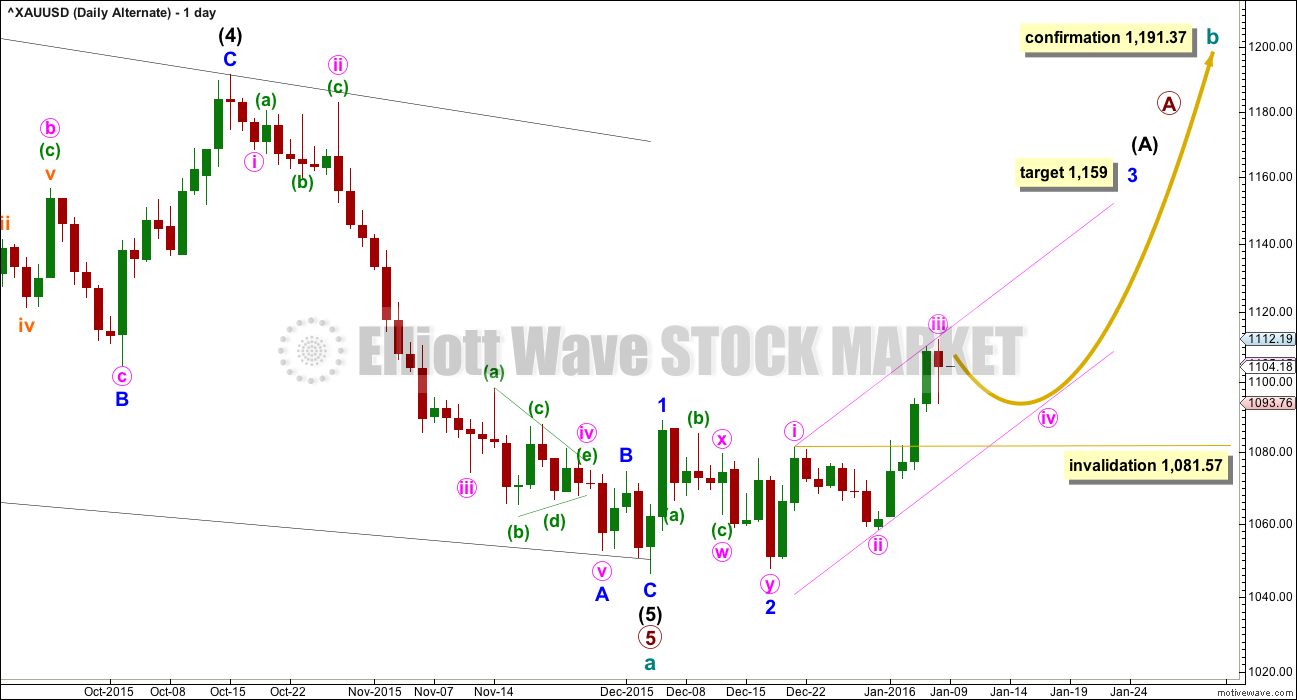
Everything is the same up to the end of the triangle for primary wave 4 (see weekly charts for this larger structure). Thereafter, primary wave 5 is seen as an ending contracting diagonal.
Within the ending contracting diagonal, it is not possible to see intermediate wave (2) as a zigzag and meet all Elliott wave rules. To see an explanation of why see this video at 10:25.
The same problem exists for the ending diagonal of primary wave 5 itself. Intermediate wave (3) is longer than intermediate wave (1) which would suggest an expanding diagonal, but intermediate wave (4) is shorter than intermediate wave (2) and the trend lines converge which suggests a contracting diagonal.
From “Elliott Wave Principle” by Frost and Prechter, 10th edition, page 88: “In the contracting variety, wave 3 is always shorter than wave 1, wave 4 is always shorter than wave 2, and wave 5 is always shorter than wave 3. In the expanding variety, wave 3 is always longer than wave 1, wave 4 is always longer than wave 2, and wave 5 is always longer than wave 3.”
This structure violates the rules for both a contracting and expanding variety. If the rules in Frost and Prechter are accepted, then this is an invalid wave count.
It may be that the rules need to be rewritten to add “sometimes a third wave may be the longest within a contracting or expanding diagonal”. But I have never seen Robert Prechter publish such a rule, I do not know that it exists.
I cannot reconcile this wave count from EWI with the rules in Frost and Prechter.
I am going to discard the idea that intermediate wave (5) may be incomplete because the low shows an overshoot of the (1)-(3) diagonal trend line. This idea has a very typical look for the end of a diagonal. If this wave count is correct, then the diagonal is most likely over.
The same idea does not work for Silver which puts some doubt on this wave count.
This wave count expects that the bear market from September 2011, has very recently ended and that Gold is in a new bull market to last one to several years. A trend change of that magnitude absolutely requires confirmation before it may be used with any confidence.
A new trend up at cycle degree must begin with a clear five wave structure at the daily chart level. So far only minor waves 1 and 2 are complete. Minor wave 3 would reach 2.618 the length of minor wave 1 at 1,159.
Minor wave 3 may only subdivide as an impulse. So far minute waves i, ii and now iii may be complete. Minute wave iv should unfold over 5 or 8 days as choppy overlapping sideways movement. It may not move into minute wave i price territory below 1,081.57.
The hourly chart for this bull wave count would be exactly the same as the bear, only everything would be moved up three degrees.
I want to remind members that last time Gold saw a reasonable upwards movement from 24th July, 2015, to 15th October, 2015, there were many people who expected that rise meant the bear market had ended and a new bull market had begun. It turned out that idea was premature: price turned around and made new lows. On 21st August I developed three bullish wave counts, partly in response to a demand from members, and one by one they have all been eliminated.
Now, again, price rises and there is a demand for bullish wave counts.
It is my strong view that this is premature. I will publish this wave count with that strong caveat.
Eventually the market will change from bear to bull, and when that change is confirmed that is the time to have confidence in a bull wave count. That time is not now.
Price remains below the 200 day moving average. Price has made a series of lower highs and lower lows down to the last recent low. There is not a clear five up on the daily chart. Price remains below the bear market trend line (cyan line on the main daily chart). While price remains below that line this wave count will be an alternate and comes with a strong warning that it is premature.
When the upwards impulse of minor wave 3 is complete, then how low the following correction goes will tell us which wave count, bull or bear, is correct. At that stage, minor wave 4 must remain above minor wave 1 price territory at 1,088.79 while the main wave count will expect new lows.
Short to mid term there is no divergence between the two wave counts. Both expect a fourth wave correction to move sideways and be followed by a fifth wave up. With both wave counts expecting the same thing next, we may have more confidence in that expectation.
TECHNICAL ANALYSIS
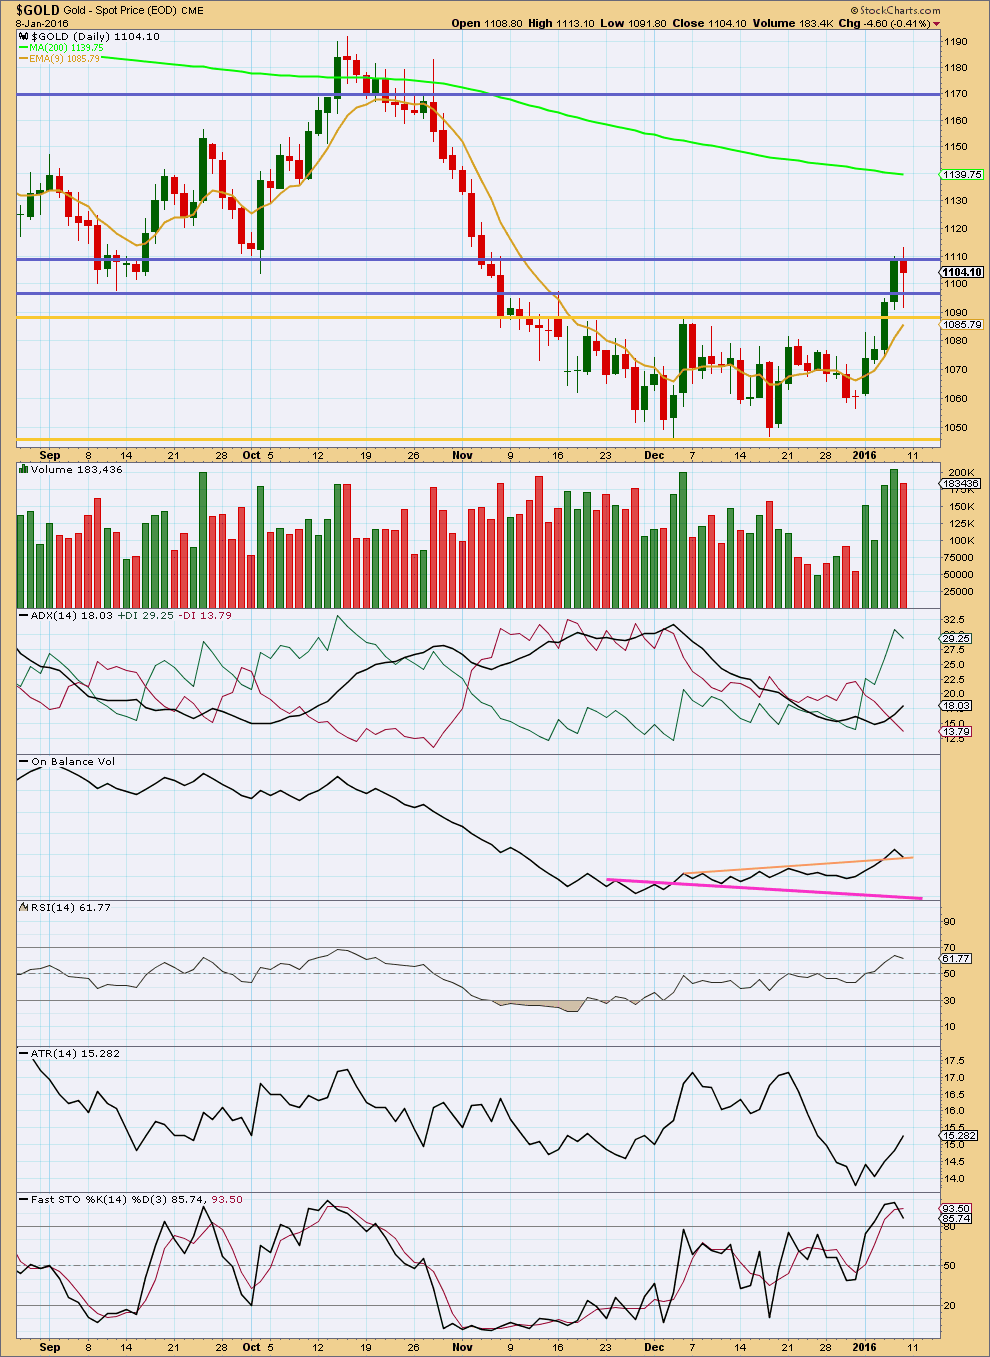
Click chart to enlarge. Chart courtesy of StockCharts.com.
Friday’s red candlestick has a small red body and long lower wick. It is not particularly bearish, but it is more bearish than bullish. It looks like a typical corrective day.
It was preceded by four days of upwards movement which showed a clear increase in volume. That rise in price was well supported by volume.
Friday’s red candlestick comes with lighter volume. The fall in price was not supported by volume.
ATR and ADX both agree that there is a trend. The trend is up.
The small correction which began with Friday’s red candlestick may be expected to find support and resistance about the two closest blue horizontal lines and the next support line, the yellow line.
This analysis is published @ 02:57 a.m. EST on 9th January, 2016.
Good Morning!
Can anyone tell me if wave count is on par for miniscule A completing?
I think you mean submicro (A), one degree higher. (light blue).
Minuscule is red.
Yes, it looks like its close to the end. Minuscule C of this zigzag should move below the end of minuscule A at 1,093.75 to avoid a truncation. It’s not quite there yet.
I can so far see minuscule C as a possible ending contracting diagonal. The maximum length for the fifth wave within it would be 1,092.34.
But minuscule wave C could still turn out to be an impulse. That would see it end a fair way lower. A short term target for it to reach equality with A would be 1,089.85.
What is more important than trying to predict the small swings within this correction is trying to see if it could be over. And today, most definitely not.
More sideways movement ahead. A range bound market, and we are yet to see the upper and lower limits of that range set.
Yes, thank you. I meant submicro. It’s helpful to know its definitely not over today, I trade a daily directional entity.
I have 5-8 days from 1-7-16 start of micro 4 at nxt THURS 14th-TUES 19th
Lara, I just came across a new version of a count that I posted for your review quite some time ago. With the passage of time and the consideration of the ending diagonal count in play, it seems appropriate to take another look at this count. This version is by thewavetrading.
http://www.safehaven.com/article/40104/time-to-reconsider-gold
This seems to solve some issues with the ED count except the wave 2 zigzag issue and ignoring the obvious wave 4 triangle. Thoughts?
It’s technically possible. But it seems to be ignoring a rather obvious third wave (with a typically extended fifth) in the middle, and as you say, a fourth wave triangle.
But importantly I just checked the idea for Silver and it works. And both these ideas resolve the problem of the ending diagonal.
Now for Silver the ending diagonal meets all the EW rules for an ending contracting diagonal.
Thanks for sharing this idea Dreamer!
I’ll take a closer look and when I’m satisfied that all the subdivisions fit I’ll probably publish it here.
My Grand Super Cycle analysis expects this is a big fourth wave correction. So I’d see this double zigzag as only wave A of a larger fourth wave correction.
But when A subdivides as a three that means B can move beyond its start. So now this idea expects a new multi year bull market for Gold, and it may make new all time highs.
Wow Lara that is a new projection if the waves work out . I am loading up on juniors now.
I wouldn’t have any confidence in a bull wave count which sees the bear market over until it’s confirmed.
It is really important to wait for confirmation.
The bear wave count is still entirely possible. Both bull and bear are valid at this time.
I’m not planning on entering any long term buy position for Gold until that bull is confirmed. But I am planning on a shorter term buy for the next fifth wave up because they can be good strong movements for Gold.
One traders very bullish bet on GLD
Lara, I read your commentary above and wanted to give you my perception about the prior bull counts. Since you are the one in charge of this analysis, it appears to me that you focus on sharing higher probability counts and not showing lower probability counts…I think that is your style for the site which gives the members like me an opportunity to narrow our focus to a few counts. It’s the main reason I am a member, it’s easier for me.
We have seen on many occasions that gold pushes the extremes of counts. As a member, I use many other sets of analysis to form my opinion on what I think gold will do, and your EW analysis is one of them. For me, including a low probability count (for Bull in this case), is very helpful because it helps me plan as I view gold performance in my other analysis.
The reality is that low probability isn’t ‘No’ probability, and you have to balance that with what you feel has integrity for you on this site. As a member and individual responsible for my own money, I have a duty to be open to possibilities that may go against me and to understand what those are and the risks involved as a result. I appreciate you posting the bull count, along with the caveats. You may even want to create a section in that bull count that summarizes or bullets the specific rules that are broken.
You have a tough job, Elliott Wave has a set of rules, but those are the rules that have been determined so far. Time is not complete yet, and we can’t look at the past and state with 100% certainty that all EW rules are in existence, yet we have to move forward like they are until it’s clear new rules are needed, and I know you are open to this as I have read about your openness in your commentary. 1,000 years from now, there may be many more EW rules, they just needed more time/sentiment etc. to show up….who knows. So thank you for continuing to provide a low probability alternate like the current bull.
And for what it’s worth….I am still open to one more low around 980 🙂 in an ending diagonal….
Have a great weekend all!
Thanks for the feedback.
I’m happy to publish lower probability wave counts, with an explanation of why it’s low probability. And you’re right. Low probability doesn’t mean no probability.
I just want to be clearer on the caveat that a cycle degree trend change is not confirmed. I suspect I may not have been clear enough last time, and some members may have placed too much weight on the bull wave counts because of it.
Lara,
Excellent work, could you post a 5 min. chart with sub-divisions if time permits.
Just wanted to clarify, Main Daily its in Micro 4 and in Alt. daily its in Minute (iv),
difference of 3 degrees of waves?
One degree apart seems more reasonable, would you say?
Thanks
I am not going to be publishing 5 minute charts.
The difference between the degree of labelling between the main bear and alternate bull wave counts will not be determined by looking at subdivisions on a five minute chart. The difference comes from the labelling at higher time frames. It’s not because of the subdivisions because both see all subdivisions the same.
thanks
Lara,
Excellent work, could you post a 5 min. chart with sub-divisions if time permits.
Just wanted to clarify, Main Daily its in Micro 4 and in Alt. daily its in Minute (iv),
difference of 3 degrees of waves? Thanks
Sorry Members I am populating the forum.
Lara: ” From “Elliott Wave Principle” by Frost and Prechter, 10th edition,……. In the expanding variety, wave 3 is always longer than wave 1, wave 4 is always longer than wave 2, and wave 5 is always longer than wave 3.””
From this I understand that main bear wave count is an expanding triangle.
So wave 1 was = 385
wave 3 = 619.34
wave 5 = should be longer than wave 3. Wave 4 ended at $1346 .
That should puts wave 5 target at 1346 – 619 and higher??? atleast $727 or lower??
Am I correct????
Thanks.
There is no expanding triangle on the bear wave count. Primary 5 is an impulse.
The issue of wave lengths relates to the bull alternate wave count, not the bear.
It’s an expanding diagonal. An Elliott wave diagonal is not the same as a triangle.
The classic technical analysis pattern of a triangle has its Elliott wave equivalent also called triangles.
An Elliott wave diagonal has the equivalent classic TA pattern a rising or falling wedge.
Look at the weekly chart to see the structure of primary wave 5 ending contracting diagonal.
Wave 1 = 214.79
Wave 2 = 175.79
Wave 3 = 230.34
Wave 4 = 113.91
Wave 5 = 145.10
Primary waves duration :
Lara: ” Nov 11 2015
So far these primary degree waves are exhibiting durations either at or very close to Fibonacci numbers (in weeks duration): 1 =3 , 2 = 53 (2 short of 55), 3 = 37 (3 more than 34), 4 = 54 (1 less than 55).
So far 5 is 70 weeks in duration. The next Fibonacci number in the sequence for primary 5 is 89, so cycle wave a may end in a further 19 weeks give or take up to three either side of this expectation.”
Now gold’s wave 5 has 11 more weeks to bottom. That puts gold in a seasonal swing cycle.
Awesome info Papudi! That would line up very well with what I am seeing. I am expecting 2-3 weeks up, followed by 8-10 weeks down for the final low. I would be surprised at this point it we break 970, but this last flush may be a killer too, who knows.
Weekend read. Another way opinion from a TA analyst on PM sector.
http://goldtadise.com/?p=359442#comments
Gold seasonal at work. After Dec low gold has Jan-Feb high, then March low. That will be the final wave 5 low as has been predicted for many years.
Between March and Jun a final low to be expected.