
A small correction followed by more upwards movement is exactly what was expected.
Summary: If price remains above 1,255.66 and makes a new high above 1,266.27, then it would be most likely that a third wave up is underway towards 1,327. Alternatively, a new low below 1,255.56 would indicate that a second wave correction is deepening towards 1,243.50. The trend for Gold remains up with a fifth wave up underway. Although the hourly wave counts are labelled “main” and “alternate” they have an even probability; price will tell us which one is correct within the next 24 hours.
New updates to this analysis are in bold.
Last published weekly chart is here.
DAILY ELLIOTT WAVE COUNT
Click chart to enlarge.
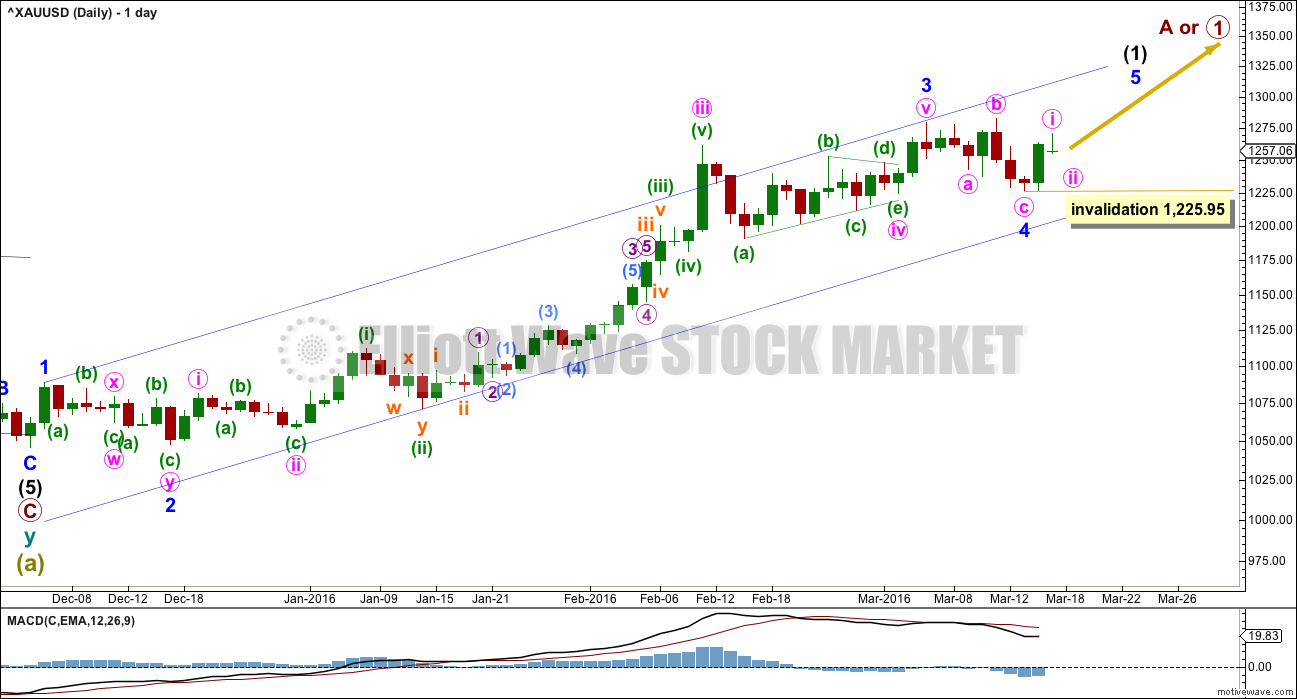
Gold has very likely changed from bear to bull.
So far, within the first five up, the middle of the third wave is now most likely complete. The strongest move may still be ahead. Gold often exhibits swift strong fifth waves typical of commodities.
Ratios within minor wave 3 are: there is no Fibonacci ratio between minute waves iii and i, and minute wave v is just 0.07 short of 1.618 the length of minute wave i.
There is perfect alternation between the deep double zigzag of minor wave 2 and the very shallow 0.23 expanded flat correction of minor wave 4.
Minor wave 4 is within the price territory of one lesser degree. Minute wave iv has its range from 1,261.94 to 1,190.9.
Upwards movement has confirmed that the last wave down within minor wave 4 is complete. The probability that minor wave 4 in its entirety is complete is high. Within minor wave 5, no second wave correction may move beyond the start of its first wave below 1,225.95.
Minor wave 1 lasted one day. Minor wave 2 lasted nine days (one longer than a Fibonacci eight). Minor wave 3 lasted fifty four days (one short of a Fibonacci fifty five). Minor wave 4 lasted seven days (one short of a Fibonacci eight).
At this stage, minor wave 5 may be expected to last either a Fibonacci five or eight days. It may be swift and strong but not necessarily extended. It is very likely to end with a strong upwards day on a volume spike.
MAIN HOURLY ELLIOTT WAVE COUNT
Click chart to enlarge.
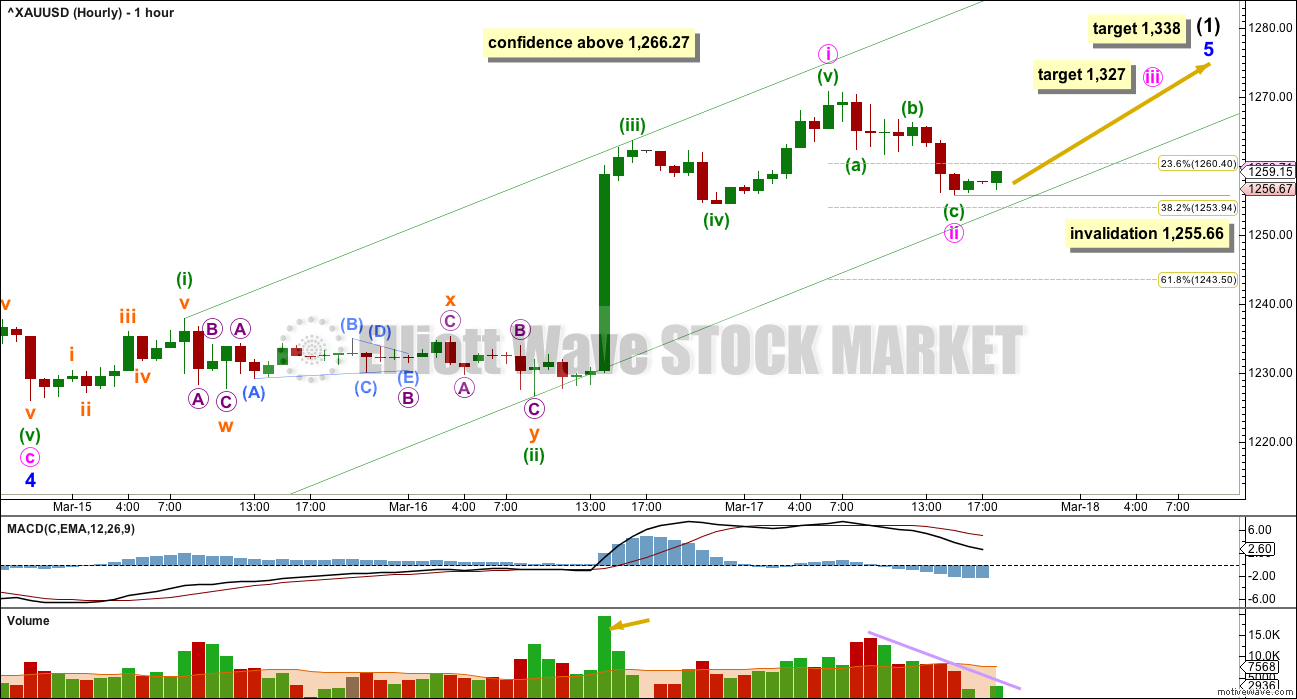
There is now a clear five up on the hourly chart. This provides further confidence that minor wave 4 is most likely over.
Ratios within minute wave i are: there is no Fibonacci ratio between minuette waves (i) and (iii), and there is no Fibonacci ratio between minuette wave (v) and either of (i) or (iii).
Minor wave 5 must subdivide as a five wave structure, either an impulse or an ending diagonal.
If minor wave 5 is unfolding as an impulse, then within it minute wave i is complete. The question today is whether or not minute wave ii is complete.
Minute wave ii may be complete as a relatively quick shallow zigzag ending just short of the 0.382 Fibonacci ratio. It shows on the daily chart as a small green doji. This is possible if minor wave 5 is not going to be a long extension like minor wave 3. As price fell for minute wave ii, it comes on declining volume at the hourly chart level. This fall in price is not supported by volume. This looks like a correction and not a new trend.
The middle of the third wave of minuette wave (iii) has strongest volume. Minuette wave (iii) has strongest momentum within minute wave i. This wave count fits the volume profile and fits with MACD.
At 1,327 minute wave iii would reach 1.618 the length of minute wave i.
At 1,338 minor wave 5 would reach 2.618 the length of minor wave 1.
Within minute wave iii, no second wave correction may move beyond its start below 1,255.66.
A new high above 1,266.27 would add confidence to this hourly wave count as at that stage the alternate below would reduce in probability.
ALTERNATE HOURLY ELLIOTT WAVE COUNT
Click chart to enlarge.
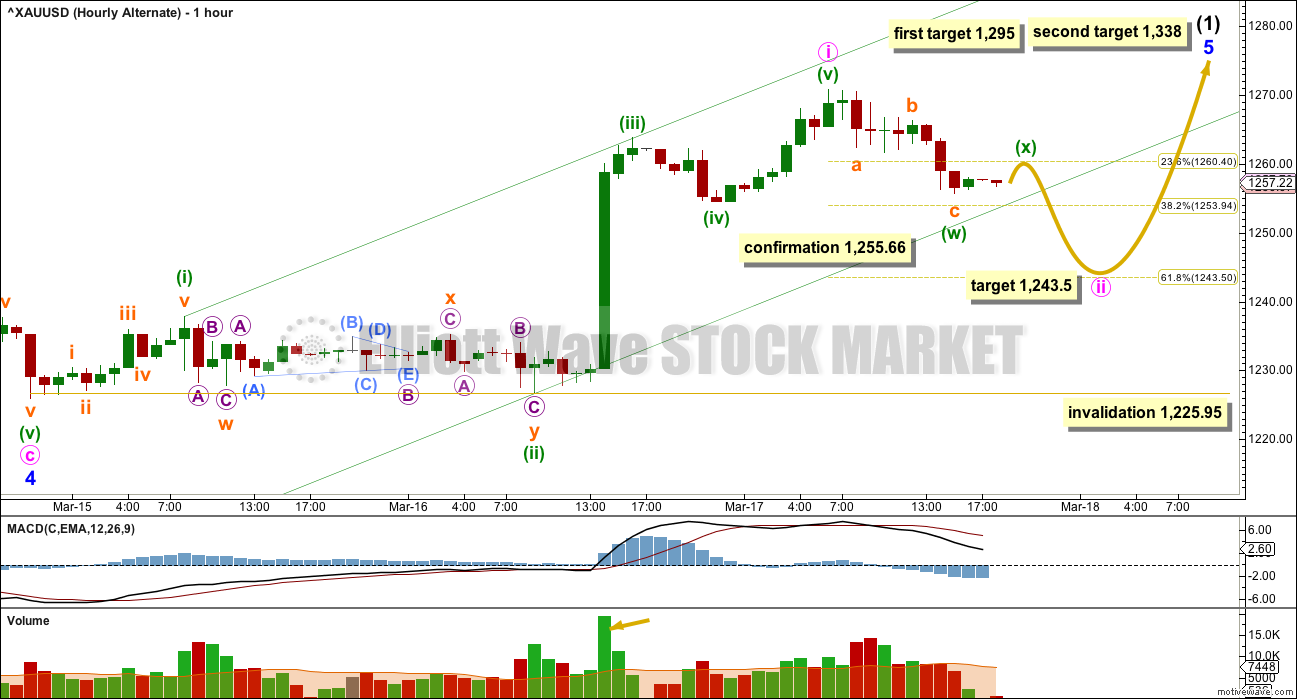
Although this is labelled an alternate hourly wave count, it is my judgement that it has an even probability with the main hourly wave count. We need to let price tell us which one is correct.
Minute wave ii may be incomplete. It would most likely continue lower as a double zigzag.
Within a double zigzag, the purpose of the second zigzag is to deepen a correction when the first zigzag does not move price deep enough. To achieve this purpose X waves within double zigzags are normally shallow and often also quick.
For minuette wave (x) to be shallow it would be unlikely to move above the start of subminuette wave c within minuette wave (w) at 1,266.27. A new high above 1,266.27 would reduce the probability of this wave count in favour of the main hourly wave count.
A new low below 1,255.66 would invalidate the main hourly wave count in favour of this alternate. At that stage, expect it is most likely that minute wave ii is continuing lower as a double zigzag. The most likely target for it to end is the 0.618 Fibonacci ratio of minute wave i at 1,243.50.
The green channel is drawn using Elliott’s first technique about minute wave i. Minute wave ii should be expected to be very likely to break out of this channel.
Minute wave ii may not move below the start of minute wave i at 1,225.95.
TECHNICAL ANALYSIS
Click chart to enlarge. Chart courtesy of StockCharts.com.
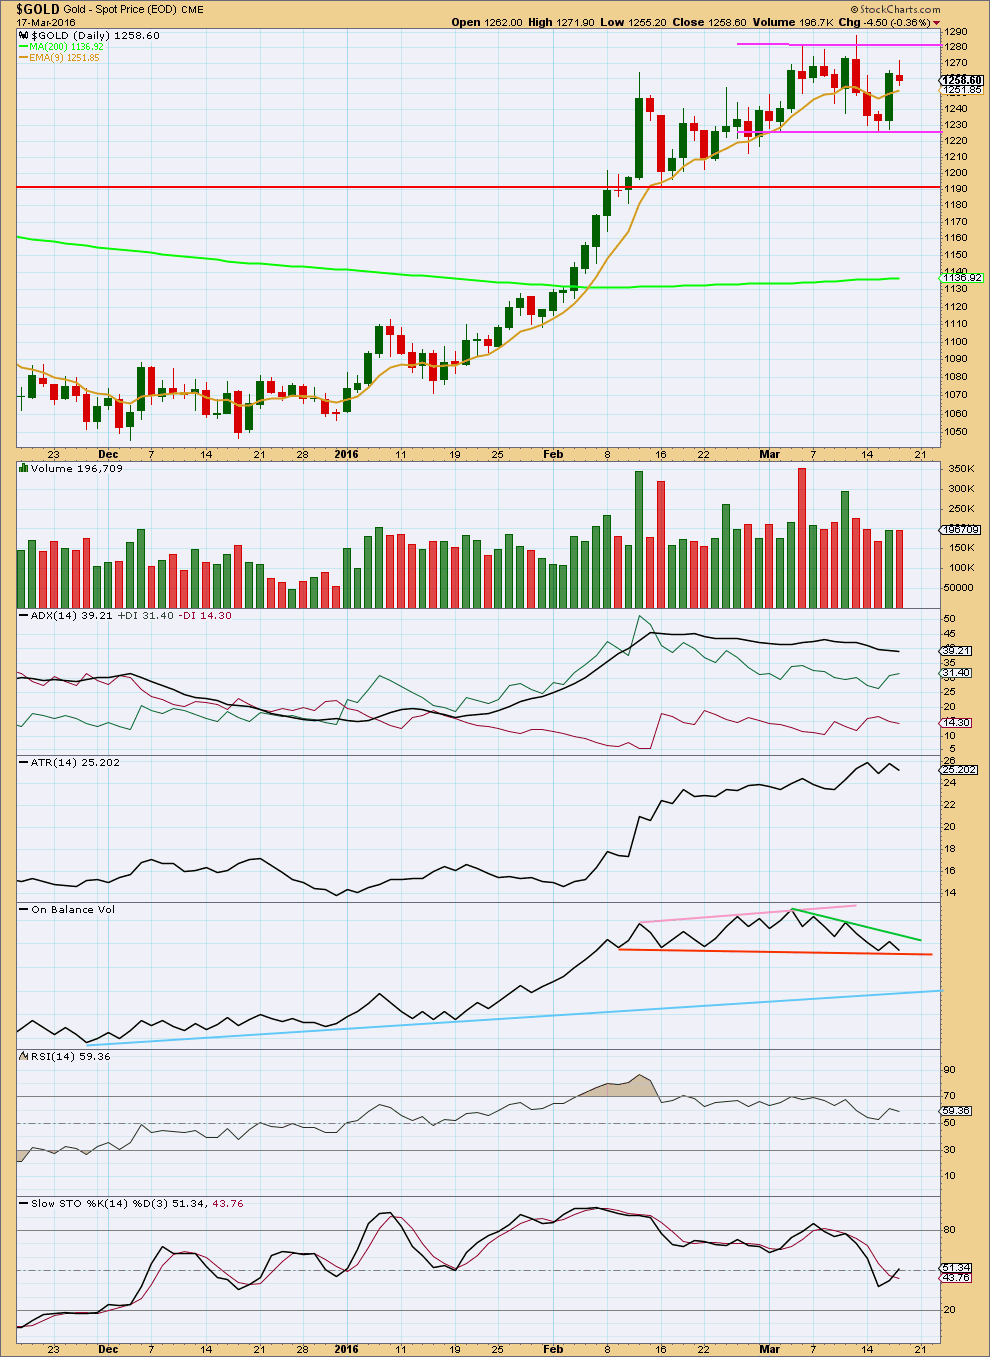
Thursday’s small red candlestick with a long upper shadow is more bearish than bullish. The small real body and small range for Thursday indicate indecision, a balance between bulls and bears with the bears winning. A slight increase in volume for this small downwards day is not of great concern, but it is of very slight concern. It indicates that a little more downwards movement may be likely as there is some support for the fall in price from volume. This favours the alternate hourly Elliott wave count.
Price has not yet broken out of a trading range between about 1,280 and 1,225 delineated by pink trend lines. We need to see a breakout above or below this range to have confidence that the next wave up or down is underway.
During this consolidation, which began back on 7th March, it is still an upwards day which has strongest volume. This indicates an upwards breakout is more likely than downwards, and this supports the Elliott wave count.
ADX is flat to slightly declining, indicating the market is not yet trending; it is still consolidating. A range bound trading approach is indicated or stepping aside and waiting for a breakout.
Price recently found support and is moving up. A range bound approach would expect upwards movement to overall continue and to not end until price finds resistance and Stochastics is overbought at the same time.
ATR over the last few days has begun to level off. It is now indicating that the market is not trending; it is consolidating. Both ADX and ATR are lagging indicators as they are both based on 14 day averages.
On Balance Volume may be useful in conjunction with volume bars to indicate the next direction for price. A break below the orange line would be bearish. A break above the green line would be bullish. OBV has come down again to find support at the orange line. If this line holds and OBV turns upwards for the next day, then the strength of that line will be reinforced, and this would be a reasonable bullish signal.
This analysis is published @ 07:48 p.m. EST.
[Note: Analysis is public today for promotional purposes. Member comments and discussion will remain private.]
This downwards move subdivides as a zigzag on the five minute chart. It looks like a zigzag on the hourly chart.
It looks like minute ii has continued lower as a double zigzag to deepen the correction, which wasn’t deep enough with the first zigzag.
The structure is most likely complete. Minute ii broke out of the channel containing minute i which is normal. It is close to the 0.618 Fibonacci ratio which is normal. It should be over here.
If I’m wrong then if it continues lower I would not expect it to move much below 1,243.50, the 0.618 Fibonacci ratio.
Thanks a lot for your incredible insight into the mysteries of gold.
Thank u lara
If or when you have the time to post a 5min chart please, much appreciated 🙂 Also would like to ask you regarding the rules of WXY combinations, is it possible that if W was a 5-3-5 ABC type , the X was another 5-3-5 up or 3-3-5 failed flat maybe, then the Y can be only a simple 5 wave down? Or does Y also have to be a zigzag itself so another 5-3-5? Thanks
Combinations are different to zigzags. Combinations move price sideways. Zigzags have a clear slope.
Have you watched the videos I’ve made on my education page? They will answer your questions.
Y can never be a five. It is always a corrective structure.
Lara,
If we assume that ZZ completed 8:20 AM low but we do not have a an impulse wave up for a 5 and its been O/Lapping action. Unless we count as (i),(ii) and i, ii of Minute [iii]?
Therefore it implies that we will see another lower low yet towards 1243.50 area? Lower than 8:20 AM low.
Is this a fair assumptions?
Thanks for excellent analysis you do.
It is most likely two first and second waves overlapping. That is extremely common.
If I am correct in minute ii as a double zigzag then the only way it could continue lower is as a very rare triple. I have only ever seen four or five of those. So it is possible, but it has a very low probability.
Thank you Lara,
The chart above and your explanation helped.
Simply put from a TA point of view and not EW, the problem is there is a H&S pattern there and the target is 1240. Just now is sorta testing the neckline again to brake it up, failure to do it here can turn this wave into a B of Y and there you go… we go down to visit 1240ish lol, so carefull now… I have closed most of my longs here, keeping just a runner stop 1248,5 and profit very small lol… But sure, if we brake 1262-1263 I would say… all clear 🙂 Really looking forward for Lara’s comments now as I do not know for sure how to label the ABC of wave Y, as in is it finished with a double zigzag in it, coz I am not sure i see that really yet… but more like a 1st 5wave down and then either minute (ii) ends truncated at 1249,5… Anyway, maybe soon will sort out, no confirmation for me just yet… 🙂
Here we go folks… enjoy the minute iii wave 🙂
Hey…. easy now, my advice: Do not go all in yet unless it blows with conviction and volume! thru the descending channel which you can draw uniting the 2 lows and overnight high and then the resistence line uniting 3 highs which sits at about 1262…… 🙂
Hey…
I think the move yesterday from day high to 1255.6 was actually Wave A…than a high towards 1268 was B and todays low may be Wave C…I personally find minutte 2 a neat ZigZag..
Comment..??
You might be right, my indicators are about to say buy nugt!!!
Not possible 🙂 The move down yesterday from 1271 to 1255 cannot be counted as a 5 down but a 3 so was a 5-3-5 making 1st zizzag and wave W according to EW theory. Then 3 up to 1265 or 1267 – this is where I am confused for Y to end. So now we either ended it or we did not, am long- stop 1248.5 moved it up. If it blows down I will resume position lower, gluck!
The problem with that idea is the wave A subdivides strongly as a three, with a triangle for the B wave.
And the following correction for your B wave was only 0.73 of wave A.
When A subdivides as a three it indicates a flat, and within a flat B must rectace a minimum 0.9 of wave A.
Trying to see the whole move as a zigzag means you have to see wave A as a five. And with that triangle in a second wave position it doesn’t work.
At 12:10 pm gold may of topped a smaller second wave because at 12:11 pm gold headed quickly on the way down. I hope gold bottoms hard and GDX cheap before the close. Then Lara can drop in with her insight in time for discount miners on a Friday afternoon buying spree before next week’s minor wave 5, intermediate (1) explosive parabolic rise up in golden glory, where we sell out and buy into gold’s daring swan song deep dive into intermediate wave (2).
storm is brewing in Elliot wave country and headed our way, surf will definitely be up next week!!!
Yea i think we stay within 1247-1254 trading range today with some chance of braking 1247 later to bottom at 1236-1243 but probably monday during assian session and then resume up later next week. Am seeing a possible flat forming if we test succesfully 1246-1247 now, not braking yet and head back up to 1254 where resistence today….
I’m thinking gold will drop below 1247.90 low of 8:22 am, before the close today. Fridays when gold looks weak, I believe it tends to get weaker before the close. If this is an A-B-C down then A was 1247.90 at 8:22 am, then B was 1254.51 at 11:33 am, where C wave down began. Or maybe my rough count is wrong?
What I am unsure of right now is to place the label for the top of wave X? 1st swing high of 1266.7 or 2nd swing high later at 1265.3? (those the numbers on my platform) This would diferentiate the count and expectations now… What do you think?
On 2nd thought not surif we get 1260 1st or simply dive around 1243 and end minor ii … coz maybe the 38,2% retrace of A of Y (last 2xswings down on 4hour chart) holds as a possible flat there on last 1-2hours … holding a little loss now lol
It seems like gold having a hard time going past 1254/1255 area… there’s a lot of congestion there on the 5minute chart. It’s been tested several times and currently dropped back to 1252…
Just waiting for Lara’s mid day thoughts on the action today
Lara: SPX EW analysis is excellent. Hope SPX 2126 will hold and market will turn over to provide clarity in global market. This has been two years of side way movement.
Ron Rosen has a different count for DOW from 1920 on ward. He has labeled market move since year 2000 as triangle A,B,C,D and now expecting wave E down.
http://www.321gold.com/editorials/rosen/rosen020216.pdf
Is it possible that SPX could be triangle wave?? The target is same for both wave counts. Does it matter how market gets to final target?
May be it does. Wave E and wave C down may behave differently????
I am excited to learn all these different rules of waves.
Thanks.
I have considered the expanding triangle idea. The problem is it is the rarest of all EW structures.
A huge flat correction is much more likely because its a very common structure.
Wave D of an expanding triangle should not breach the A-C trend line. Triangles normally adhere very well to their trend lines.
Expecting an expanding triangle means the next wave down should be a zigzag.
Expecting an expanded flat means the next wave down should be an impulse (most likely) and may be deeper and stronger.
I think its time to buy some gold and just relax…let market do what it want to do…
Could 1247.90 low at 8:22 am EST have only been the A wave of an A-B-C correction down to 1,243.50 or maybe an adjusted lower target after last night’s high?
I’m going with we are in a combination (y) wave (Alt hrly count), and a ?4th wave of that. Looking for Lara’s target 1243. Just guessing really.
I think so too. I have target 1260 for B of Y but if it goes beyond 1263-1264, Y and ii terminated I would say. If not we may go around 1240ish … next
First gold confirmed the main hourly then this morning invalidated the main hourly and confirmed the hourly alternate.
I sold my GDX at a profit today and I hope I get GDX cheaper before the close. I’m now waiting for the hourly alternate target of 1243.50 area to buy it back if it is still in effect after being invalidated.
Below 1243.50 target is 1225.95 invalidation for both daily and hourly charts.
The peak of gold may take including today another 3 or 6 days for the 1295 or 1338 target. The 1327 may no longer be effect because the alternate was later confirmed.
We may need two new hourly charts because at one point they were both invalidated?
so far its been a snoozefest!
nugt sandwiched between the 10sma and 20sma on the hourly, waiting for break either way to get in
Shahab, please let me know when you think it is time for your NUGT Sandwich. I may be in the market or hopefully already bought in as cheap as possible in GDX or NUGT although I don’t like holding 3X ETFs over weekends as 3 x the risk.
Did gold complete the correction down today?
Did minute iii begin at 1247.90 at 8:22 am?
I think so.
I am also still long on gold, however looking to buy more on 1243-1245 now, what I see is the top of X at 1267 and a head& shoulder formation with neckline broken. Do you agree?
Yes it looks like we have a double zig zag for minute ii…
Patiently waiting for minute iii to start in the next few hours.
Hmm hours… Maybe less. I am looking for a spike down to finish it soon.
I have a feeling that spike down to 1248 was it…
Spiked quickly back up to 1253.
I’m relying on my interpretation of the rule “wave 2 may not move beyond the start of wave 1” and within a zigzag “wave B may not move beyond the start of wave A” to logically apply to wave X within a double zigzag.
But to be fair, I’m applying my interpretation to expect wave X may not move beyond the end of wave B within the first zigzag, and to more logically apply the interpreted rule it should be wave X may not move beyond the start of the first zigzag.
That is why I have the confidence point at 1,266.27.
I hope that all makes sense.
Anyway, within subminuette c no second wave correction may move beyond the start of its first wave. So this upwards move cannot now be a continuation of subminuette wave c. That last wave down is now confirmed as complete and it was a three.
There is still a possibility that minute ii could continue lower as a double zigzag. But at this stage the probability has reduced.
Low probability does not mean no probability.
If we see a new high above the start of minute ii at 1,270.85 then there will be a high probability that minute ii is over and minute iii upwards is underway.
So depending upon your own personal risk appetite you may have already entered long, or you may choose to wait.
If you are holding long positions please manage risk appropriately. Understand that there remains a possibility (a low probability) that price could move lower as minute ii deepens.
The risk to trading this next move up is at 1,225.95 still, until we make a new high.
Lara FREE Gold analysis and video are free to the public today.
“nalysis is public today for promotional purposes.”
Tell some people.
We do. We tweet and Facebook the link.
We also syndicate it to FX Street and Safe Haven.
Good.
Your excellent analysis should get to many Gold investors.
How about these other sites but not limited to:
kitco, 321gold, gold seek, seeking alfa, gold eagle, etc.
No don’t send it to everyone as we want to have an advantage trading gold against traders who don’t use Elliott Wave or Lara’s services. LOL
I did used to send it to Gold Eagle, but had a problem with their syndication.
I have contacted Kitco but they never got back to me. Maybe I’ll try again.
Gold just hit after market high of 1,267 at 9:20 pm EST.
Main Hourly chart has “Confidence above 1,266.27”.
Analysis has for main hourly “If price remains above 1,255.66 and makes a new high above 1,266.27, then it would be most likely that a third wave up is underway towards 1,327 (minute wave iii).” Minor 5 remains at 1,338.
Really glad I did buy back into GDX, just pennies above the low at close.
Yeah looks like the first wave count is in play… Lara’s mid day analysis was just in time, I bought into my GLD position at a good time as well. We’re sitting pretty right now watching minute iii unfold here.
Have a feeling tomorrow will be a good one 🙂
And thanx Lara for the video today…
Yes great timing of Lara midday comment and chart.
Great days lows buys at the close.
That’s why I do some day trading of smaller swings.
Great already confidence main hourly we’re in minute wave iii up already and a higher first target of 1,327. Very exciting.
I have a feeling the waves are unfolding quickly. We might see minute iv and minute v also near the end of trading day tomorrow. Which would be close to 17 hours from now. Originally Lara mentioned primary 5 would take Fibonacci 5 or 8 days. Looks like it will be on the shorter end of estimate…
If there will be big gains tomorrow It’ll be hard holding my position through the weekend…
We’ll see. Great problem to have!
Primary 5 may take another 3 or 6 days, as already been 2 days.
Although lately gold has sped up.
If gold gets near 1327 Friday I’ll sell rather than holding over the weekend and minute iv would correct down.
If that main hourly wave count is correct and if that is it for minute ii then it was shallow.
Which means minute iv may be deep. Alternation.