
A new low indicated that the correction was deepening to be closer to the 0.618 Fibonacci ratio.
This was not what was expected for Monday.
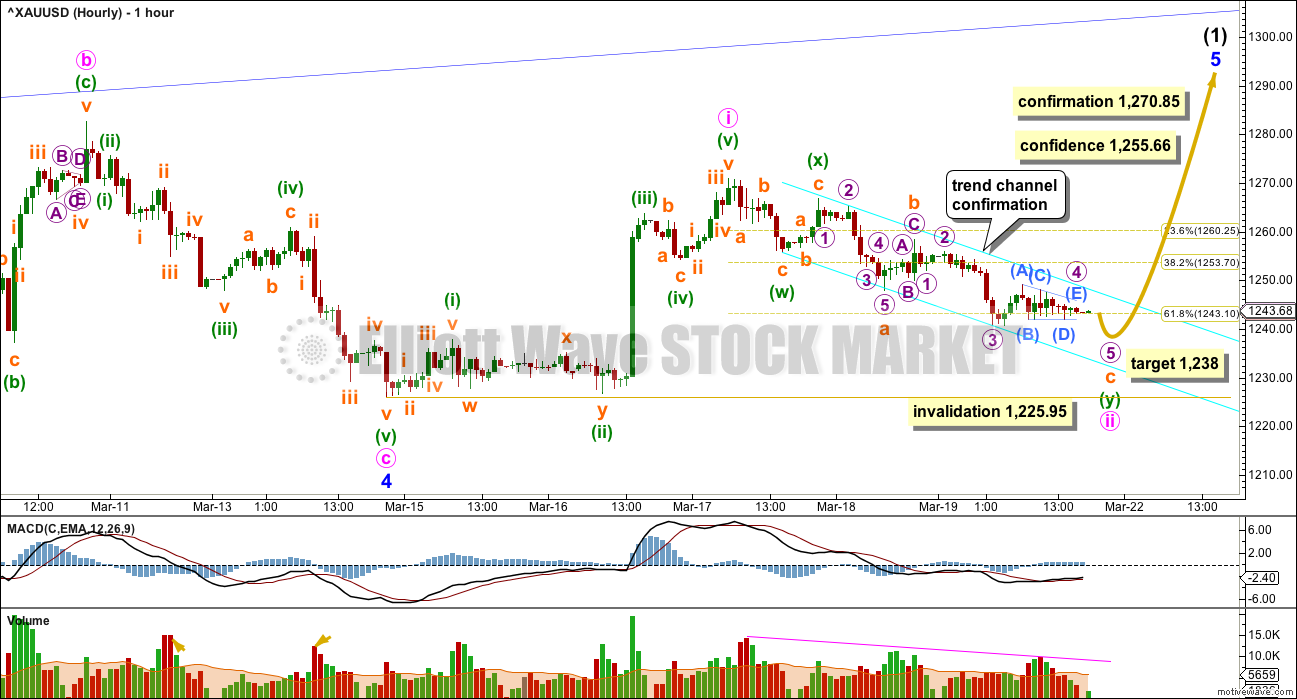
Summary: A target for this downwards movement to end is close by at 1,238. Thereafter, a third wave up should begin; confidence may be had above 1,255.66 and confirmation above 1,270.85. If price breaks below 1,225.95, a new alternate may be correct which expects intermediate wave (2) has arrived.
New updates to this analysis are in bold.
Last published weekly chart is here.
DAILY ELLIOTT WAVE COUNT
Click chart to enlarge.
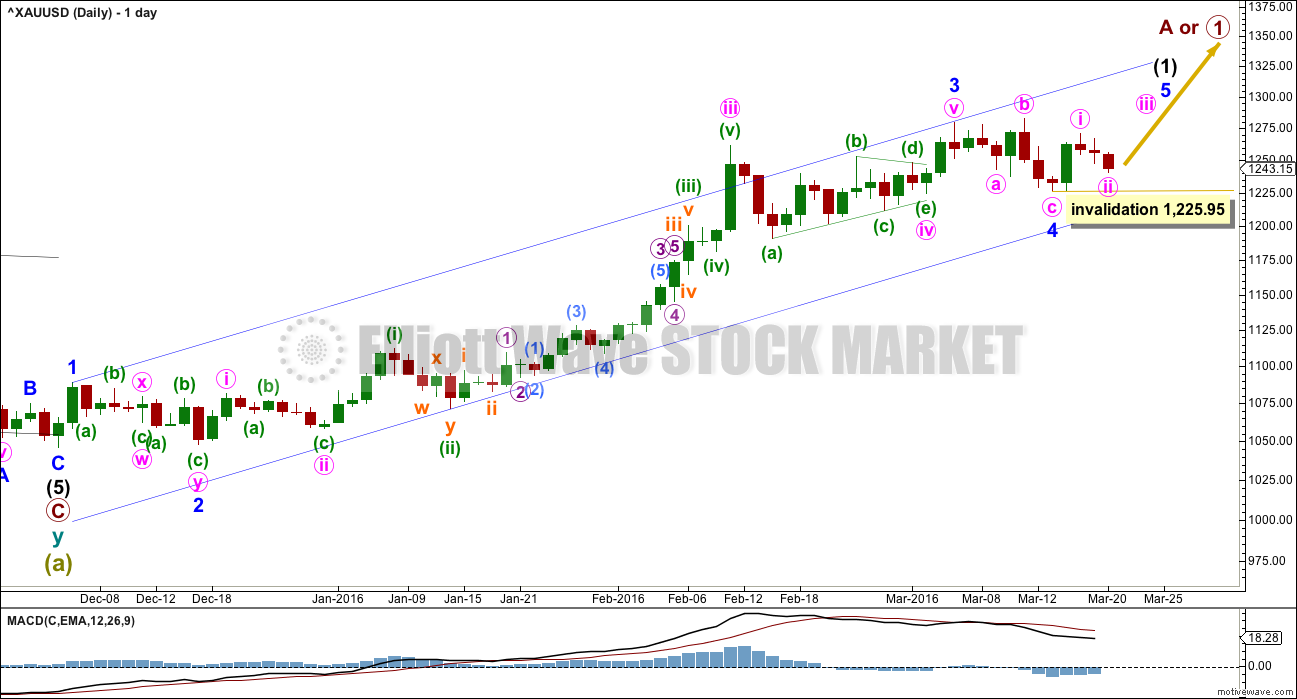
Gold has very likely changed from bear to bull.
So far, within the first five up, the middle of the third wave is now most likely complete. The strongest move may still be ahead. Gold often exhibits swift strong fifth waves typical of commodities.
Ratios within minor wave 3 are: there is no Fibonacci ratio between minute waves iii and i, and minute wave v is just 0.07 short of 1.618 the length of minute wave i.
There is perfect alternation between the deep double zigzag of minor wave 2 and the very shallow 0.23 expanded flat correction of minor wave 4.
Minor wave 4 is within the price territory of one lesser degree. Minute wave iv has its range from 1,261.94 to 1,190.9.
Upwards movement has confirmed that the last wave down within minor wave 4 is complete. The probability that minor wave 4 in its entirety is complete is high. Within minor wave 5, no second wave correction may move beyond the start of its first wave below 1,225.95.
Minor wave 1 lasted one day. Minor wave 2 lasted nine days (one longer than a Fibonacci eight). Minor wave 3 lasted fifty four days (one short of a Fibonacci fifty five). Minor wave 4 lasted seven days (one short of a Fibonacci eight).
At this stage, minor wave 5 may be expected to last a Fibonacci eight days. It may be swift and strong but not necessarily extended. It is very likely to end with a strong upwards day on a volume spike.
HOURLY ELLIOTT WAVE COUNT
Click chart to enlarge.
The hourly chart will be shown from the low of 10th March to today, so that it may be compared with the alternate below. This main wave count has a better fit.
Minor wave 4 was an expanded flat correction. Within minor wave 4, the upwards move labelled minute wave b fits well as a three, an expanded flat.
This main wave count sees the upwards wave labelled minute wave i as a five wave impulse. There are no Fibonacci ratios between minuette waves (i), (iii) and (v) within minute wave i.
Minute wave ii is still seen as a double zigzag, which is incomplete.
There is a triangle for subminuette wave b within the first zigzag of minuette wave (w). This fits perfectly on the hourly and five minute charts.
A small cyan best fit channel is drawn about this downwards movement. When it is breached by upwards movement, that shall be earliest indication of a trend change. Confidence may be had with a new high above 1,255.66 and final price confirmation would come with a new high above 1,270.85.
When minute wave ii is complete, then a target may be again calculated for minute wave iii. This cannot be done today because we do not know where minute wave iii begins.
At 1,238 micro wave 5 would reach equality in length with micro wave 1. Micro wave 5 should be expected to be surprisingly short; Gold often exhibits surprisingly short fifth waves out of its fourth wave triangles. Micro wave 5 is likely to make at least a slight new low below the end of micro wave 3 at 1,240.65 to avoid a truncation.
Minute wave ii may not move below the start of minute wave i at 1,225.95. If this wave count is invalidated, then the alternate below should be used.
ALTERNATE DAILY ELLIOTT WAVE COUNT
Click chart to enlarge.
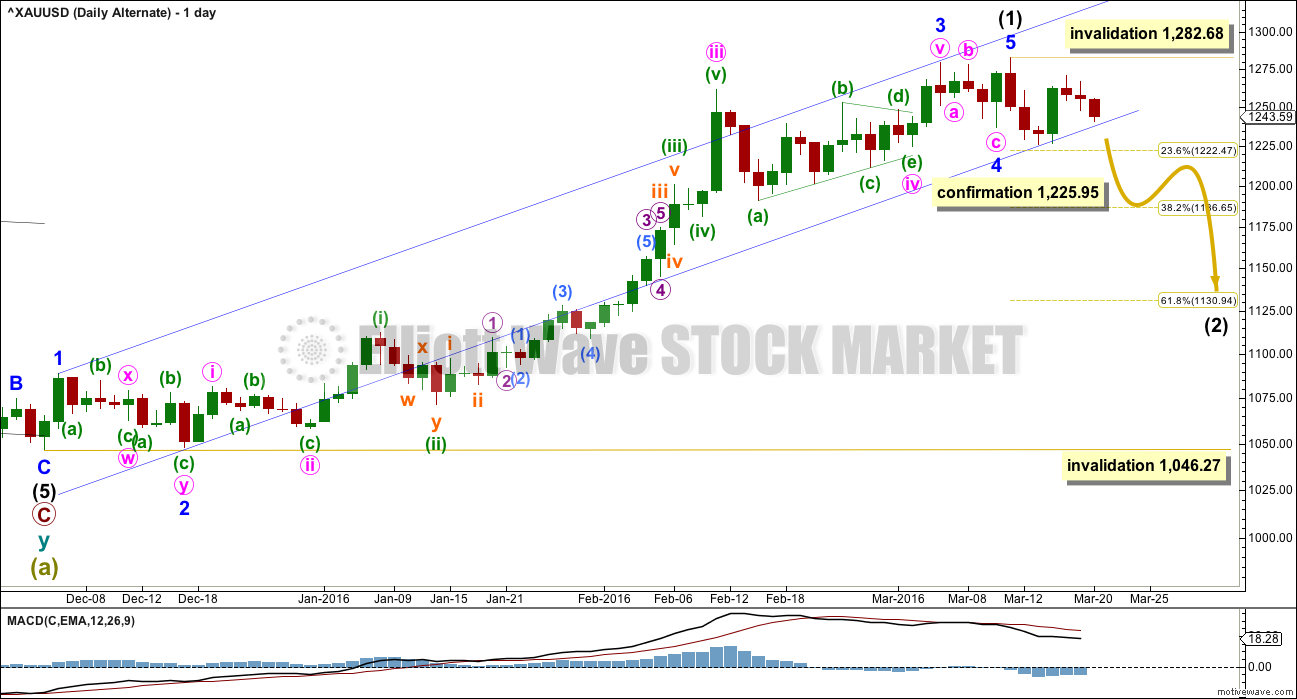
What if my analysis of intermediate wave (1) as incomplete is wrong? If it is complete, what would that look like? Does it fit?
This wave count is identical to the main wave count up to the end of minor wave 3 . Thereafter, instead of seeing minor wave 4 as an expanded flat correction this wave count must see it as a regular. There is still alternation between minor waves 2 and 4: minor wave 2 is a deep 0.97 double zigzag and minor wave 4 is a shallow 0.18 regular flat. The proportions are not as good though: minor wave 2 lasted nine days and minor wave 4 only four days. This slightly reduces the probability of this wave count.
Ratios within intermediate wave (1) are: there is no Fibonacci ratio between minor waves 1 and 3, and minor wave 5 is 2.95 points longer than equality with minor wave 1. This good Fibonacci ratio adds a little support for this alternate wave count.
A movement at intermediate wave degree should begin with a five down on the daily chart. That is incomplete. Within the first five down, no second wave correction may move beyond the start of its first wave above 1,282.68.
ALTERNATE HOURLY ELLIOTT WAVE COUNT
Click chart to enlarge.
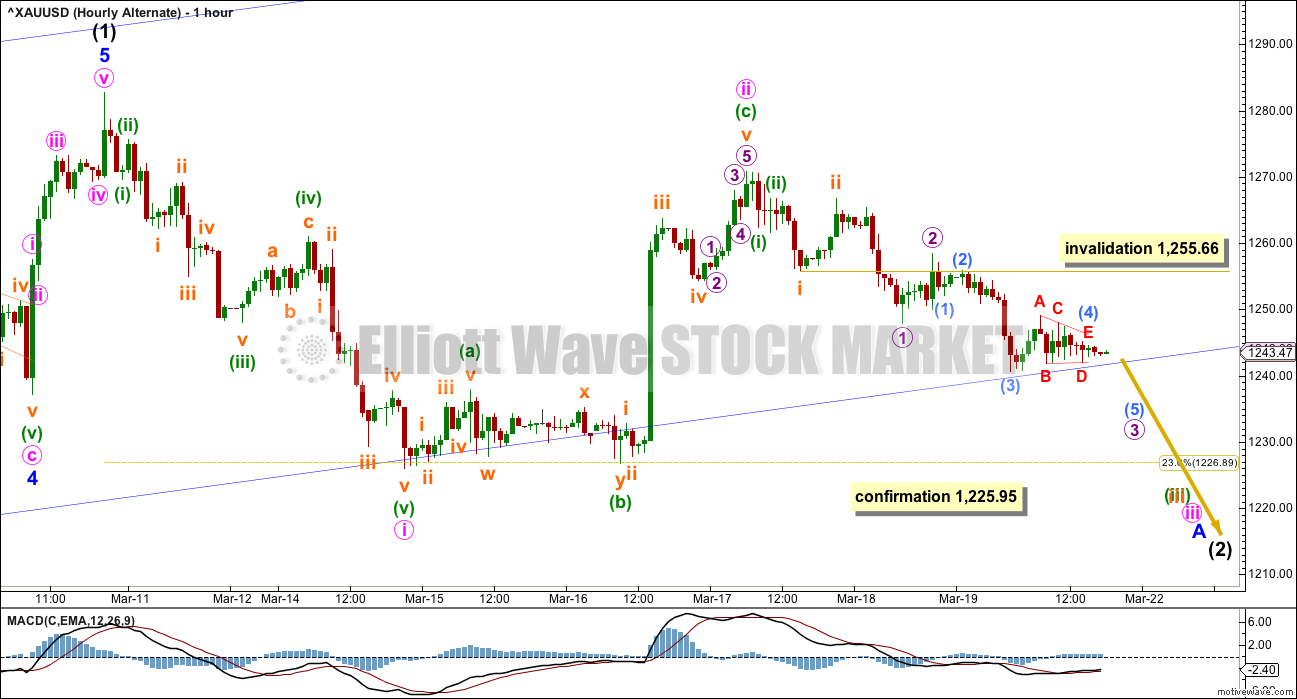
An ending diagonal is seen for minuette wave (v) at the end of minor wave 4. This downwards wave fits better as a three than a five, but it will fit both ways; it is ambiguous.
The downwards wave labelled minute wave i is seen as a five wave structure for both wave counts.
The upwards wave labelled minute wave ii is seen here as a zigzag. It has a better fit as an impulse (main wave count), but again it will fit either way; it is ambiguous. There is no Fibonacci ratio between minuette waves (a) and (c).
Ratios within minuette wave (c) are: there is no Fibonacci ratio between subminuette waves iii and i, and subminuette wave v is 0.91 longer than 2.618 the length of subminuette wave i.
The biggest problem with this new alternate wave count is what is happening with downwards movement. So far there is too much overlapping for minute wave iii to be complete, and it has not made a new low below minute wave i which it must do. Downwards movement looks more corrective than impulsive. The only structure minute wave iii may unfold as is an impulse.
Within the current downwards wave for minute wave iii, this wave count must ignore what looks like a triangle for minuette wave (ii). A triangle may not be the sole corrective structure for a second wave.
Another triangle looks like it is unfolding. For this wave count, if it is a fourth wave, then the middle of minute wave iii has passed yet momentum has not increased beyond that seen for minute wave i, and the middle of minute wave iii has passed yet price has not moved beyond the end of minute wave i. This gives this part of the wave count a strange look, so the probability is reduced.
This wave count is technically possible, but it has a low probability. It needs price confirmation below 1,225.95 before confidence may be had in it.
If this wave count is confirmed, then a multi week correction has begun for intermediate wave (2).
Within minute wave iii, subminuette wave iv may not move into subminuette wave i price territory above 1,255.66.
TECHNICAL ANALYSIS
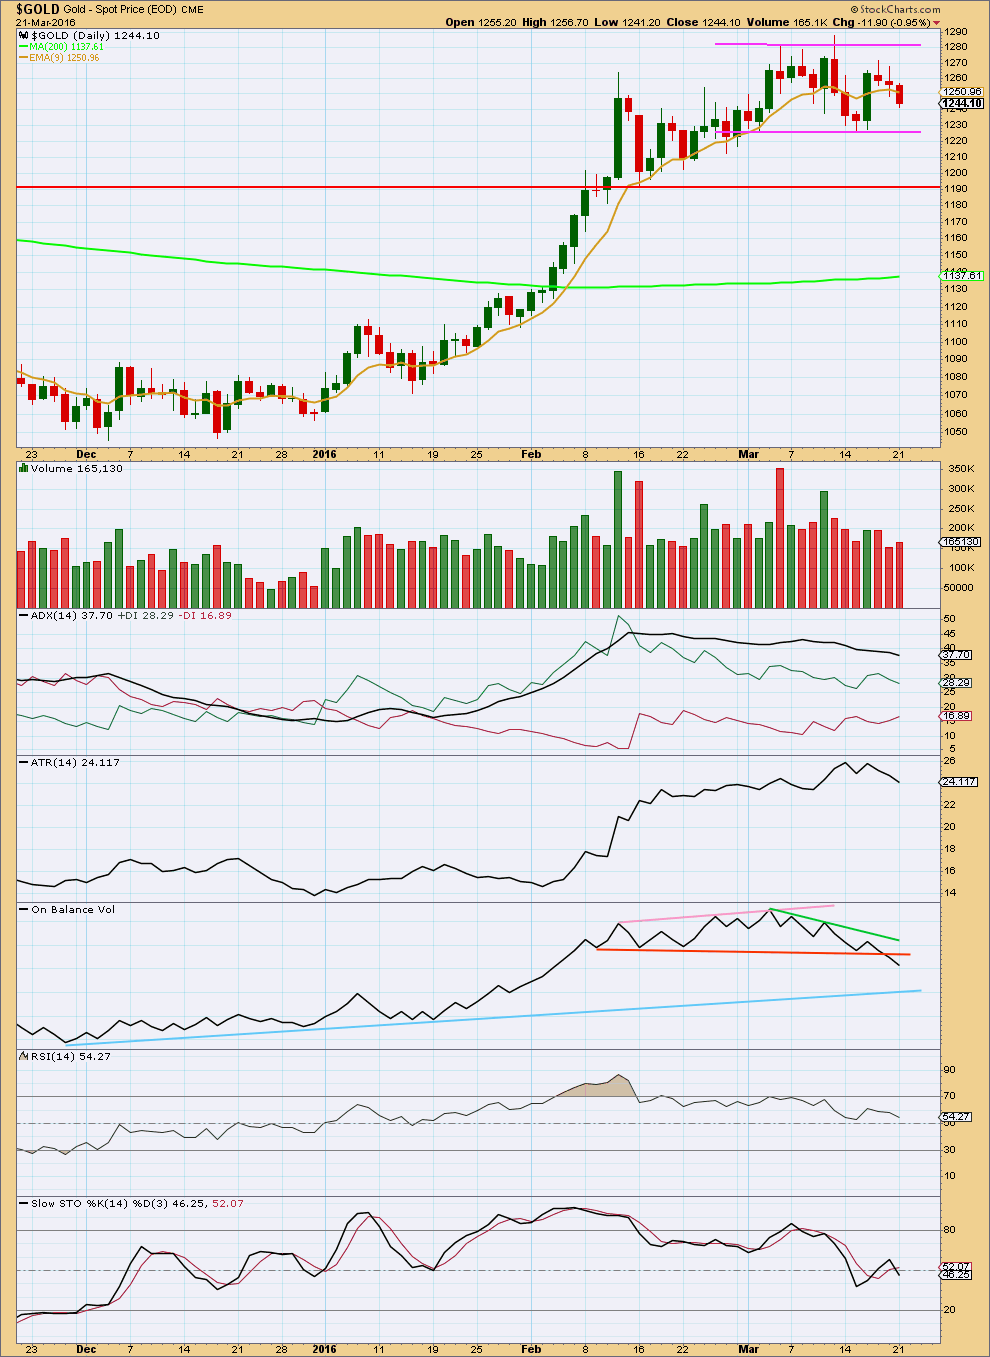
Click chart to enlarge. Chart courtesy of StockCharts.com.
Downwards movement for Monday still has a relatively small real body for the daily candlestick. Volume increased beyond Friday but not beyond volume for Thursday. Overall, as price falls, volume is still declining.
ADX is still declining indicating the market is not trending; it is consolidating. ADX is not indicating there has been a trend change: the +DX line remains above the -DX line. However, ADX is a lagging indicator as it is based upon a 14 day average.
ATR is declining indicating the market is not trending. With ADX and ATR in agreement, it should be expected that the market is still consolidating. Price remains range bound below about 1,280 and above about 1,225. During the consolidation, it is still an upwards day which has strongest volume indicating an upwards breakout is still more likely than downwards. This normally is a reliable indicator of price direction for Gold during a consolidation.
On Balance Volume has today given a clear bearish signal with a break below the orange support line. This line is not highly technically significant though; it is not long held nor often tested. This signal is weak, but it is bearish. The light blue line offers stronger technical significance. If OBV moves lower to test that line, then a break below would be very bearish whereas a move up from there would be very bullish.
RSI is back close to neutral. There is room for price to rise or fall.
Stochastics is also close to neutral.
This analysis is published @ 08:05 p.m. EST.
… long looking to initiate shorts in 1258-68 range….
I have to discard the main wave count.
This movement just does not fit as a third wave up.
I’ll have three wave counts today. Either minor 4 is continuing sideways and then minor 5 up will begin, or intermediate (2) is beginning.
Excellent site. Food 4 thought:
http://www.marketanthropology.com/2016/03/the-golden-corral.html
A superb analyst, though I’m first to admit much over my head, Eric Swarts comments:
“With gold now following the March 2014 seasonal pivot lower – the question becomes: will gold and commodities succumb to another disinflationary squall, or have underlying conditions in the currency markets shifted to more benevolent times for valuing hard assets and participants should expect a more moderate pull-back in gold? … From our perspective we believe the latter is more likely and continue to hold a near-term target of around 1190 for gold.
One chart of many correlates gold’s movement to dollar index.
P.S. Lara, as a former hydro-geologist, he studied movement of water. Okay so you surf it. Still a similarity here.
🙂
I study waves. To ride them. Very similar to EW and trading actually. Psychologically that is.
edit:
Market Anthropology continues…
“Gold continues to loosely follow the yen’s lead, implying that a breakout move above 1300 would approach after the current retracement decline runs its course.”
Word is :Japanese currency to be downgraded (Japanese debt) Affect on gold should be positive IMHO
Lara, I think Johno’s post today of Gold Eagle News thought on Monday that this cycle in the gold market is similar to the gold market of 1976 to 1980. The reason I find it of interest is that I was actually looking back to the 1970 to 1980 market in gold and silver a couple weeks ago. I was Director of Corporate Development then for Callahan Mining Corporation which owned the Galena Silver mine in Coeur de Alene Idaho. (22 ounces of silver per ton of dirt or ore. ) We made lots of money when silver went from $2.50 per ounce in 1970 to $50.00 per ounce in 1980. We also owned gold deposits in Livengood Alaska. Anyway ,I was thinking that the pattern was similar (I use pattern recognition as one of my trading tools) and thought a couple weeks ago that we might repeat this pattern to challange or beat the former high in gold in 4 to 5 years. Anyway ,pattern recognition worked well for me in 1986 when Sugar futures went from 5 cents a pound to 11cents in 5 months. Jusat a point to consider in your long range thinking. I am buying June Gold contracts on Comex as I do not think we will get much of a correction after this next top Best to you and your excellent work.
My Super Cycle analysis expects to see a big bull market here in Gold, and it could look like that move from 1976 to 1980. But my analysis doesn’t expect it to move that high compared to the ATH at 1,920.18.
It must reach a minimum of 1,832.79 and it may make a new ATH. The probability of a new ATH is high; that would see Grand Super Cycle an expanded flat which is a very common structure. The most common type.
It’s either a flat or triangle at this stage because A subdivides as a three. And with A being a multiple a combination is eliminated.
This sideways choppy mess just does not look like the start of a third wave up.
I am going to have to go back and consider minor wave 4 as incomplete.
And so I will have alternate wave counts to add to the analysis today:
What if minor wave 4 is a triangle? And if I’m considering a triangle then I must also consider a double flat or double combination.
And so I’ll have two alternates in addition to the one already published. Triangle, and double for minor 4.
These are all sideways movements. If it resolves itself as a triangle then we should expect minor 5 to be very short. If it resolves itself as a combination or double flat then we may expect minor 5 to be a reasonable length.
I’m still holding my buy from a few days ago. It’s still positive and as I expect it’s unlikely price will move below my entry point I’ll hang on. I still think it’s a good entry to ride the final fifth wave up.
The last 10 hour painful descent from the gold high of 1,260.25 at 3:55 am EST down to the 1,244.64 intraday low at 2:14 pm may just be a correction in minute wave iii just before it has another overnight increase in momentum. Perhaps it is a wave 2 correction.
I’d like to buy some more miners since we’ve already had trend channel confirmation and price confidence above 1,255.66, however I’ll first wait for Lara’s behind the scenes insight on gold’s stealth EW strategy to make a run for the final peak of minor wave 5.
I’d also feel better if Lara mentions, “Surprises are to the upside”, if that still applies.
Yes, still surprises to the upside may occur.
I’m thinking that maybe this is minor 4 continuing as a triangle. This overlapping mess does not look like a third wave up.
The surprise to the upside should come right at the end of minor 5. A strong upwards day with a volume spike.
Unless minor 4 is a triangle. Then we may just see a couple of upwards days like we saw for minute v which ended on 4th March. Not really very spectacular.
Good Friday March 25 NYSE closed
https://www.nyse.com/markets/hours-calendars
I am pleased that you considered alternative wave consistent with COT/Seasonal force.
Lara: “If this wave count is confirmed, then a multi week correction has begun for intermediate wave (2).”
What is the price target for int wave (2) and duration?
What is to expect for int wave (2) structure 3 or 5 down??
Thanks.
The 0.618 Fibonacci ratio at 1,131 is the target.
Intermediate (1) for the alternate lasted 69 days. So expect intermediate (2) to be at least that long, probably longer. Maybe a Fibonacci 89 days?
Is this right now a C wave of an A-B-C down to about 1,248 any minute now 11:16 am?
Well… the bottom at 1248 was an W it appears… double zigzag and now already Y should bottom soon expecting not sure where, but should be part of some i-ii 1-2 action so far…
Is Y expected to be lower than W which was 1248?
Once Y finished might minute iii continue back up with momentum? Or is it possible that 1,238 target is still in play or was that totally discarded with the strong bullish action overnight?
I expected yesterday for price to reach below 1240 or 1235-1239 but it did not. Wave Y could make a low below 1248 now but could have truncated aswell… However I must say I do not like the action so far although today seems like a lower scale repetition of the pattern we had past few days… I see a small i-ii for about 5 pts only last night (1241.7-1246.8) then down to 1243,5 at 7am and then up all the way to 1260 which could be 1 of i of iii. But it does not have a good look does it? Then all this huge downward action for 2 of i of iii? OR it could all be considered a big ABC from 1241,7-1260 and we now in another B(X) down to new lows below 1240? I am also confused
DORIAN your buying you were thinking about in the 1234-1236 area, might you be doing that at the bottom of the Y wave?
The hourly alternate chart was invalidated above 1,255.66.
The main hourly chart is looking very good.
The small cyan best fit channel on the main hourly chart was breached by upwards movement of at least 1 hourly candlestick at 3 and 4 am, which was the earliest confirmation of a trend change. Confidence was had with a new high above 1,255.66 when gold hit the high of 1,260.25 at 3:55 am.
We are still waiting for a final price confirmation with a new high above 1,270.85.
Perhaps minute ii down has ended and the target of 1,238 may no longer be in play for micro wave 5 and minute iii has already begun?
Lara did mention at 4 am, “So we have not seen the final fifth wave down I was expecting. But so far it looks like we shall see a third wave up.”
I’m going to have a new idea today which explains all this sideways mess.
http://www.zerohedge.com/news/2016-03-21/critical-consumer-buying-gold-first-time-three-weeks
Thx, Lara. Alternate count has been invalidated with a move above 1255,66 🙂 Ok, it seems micro 5 and minute 2 ended truncated yesterday at 1241.5 (on my platform). What I am seeing now is a expanded triangle for wave i of iii and ii of iii may have ended at 1243,5. Anyhow, I have moved my stops barely only at 1230. Let me explain why. Being in the markets for over 5 years, I have found out anything is possible, so expecting the most improbable outcome must be taken into consideration. So I am considering 1more option for gold – I place like 10% odds for this: what if we still in minor 4? Is it possible that 1225 bottom was just wave W and we are now in wave up X which can be a simple zigzag making minuete (i) in fact wave A , the drop to 1241,5 wave B and when we finish minuete (iii) that may just be wave C of X (which if it does not go beyond 1300 would be further indication this is possible?) Either way, I am expecting a retest of the highs around 1283 and if that goes well, my 2nd target now is 1315(backed up not only by (iii)=1,62x(i) but also a very nice head and shoulders pattern on hourly chart with neckline now around 1263! My 3rd target will be around 1338 which is backed up also! by TA not just EW by the fact that we got an expanded wolfe wave pattern aswell lol with this target EPA, however expanded wolfe is very rare and unreliable and sometimes fail…. Lara, I would like your opinion pls based on what I said and odds we still in minor 4, thx alot! 🙂
It is very difficult for me to digest a wall of text.
Please break it up.
I am considering a triangle for minor 4. Which means I must also consider a combination or double flat.
All are sideways movements.
Lara thanks for the new alternate idea. Even if less probably it’s good to keep an eye on the what if scenarios that may be lurking behind the scenes.
‘dsprospering’ did comment today about the possibility of minor 5 already ended.
I thought it wasn’t possible, however it was and Lara you’ve presented it brilliantly.
I’ll give a big thanks to both of you. Now as usual we let price be our guide.
Thank you Richard.
I’ve learned the hard way to always consider “what if?”
And to know that sometimes I’m wrong.
At this stage it looks like I was wrong about that fourth wave triangle. For the alternate price has moved into micro 1 territory, and even submicro (1) territory. price did not break out of the triangle downwards.
So we have not seen the final fifth wave down I was expecting. But so far it looks like we shall see a third wave up.
I will be back after sleep to update everyone.
Good luck!
I do not think you were wrong about the wave 4 triangle, I think micro5 made a truncation and micro5 = micro 1 even 😛 They tricked me too … I had lots of buying pendings in 1234-1236 area, I remained long today with smaller positions lol
I don’t think there was a truncation in there.
Don’t expect truncations, and don’t use them to make a wave count fit. If you have a truncation then unless it came after a very strong movement (or occasionally right before a very strong movement) then consider another idea. Such a wave count is probably wrong.
I think the upwards movement is a three, and the triangle was a B wave within a zigzag.
Ok, thanks.
I just love it when Lara presents a clear picture with multiple choice on movement. With the notations on the chart and price points we know instantly which one price is following. (And I so like seeing what is the risk just in case we’re all wrong) 🙂
Looking forward to her a.m. update.
Cheers. If you liked that one alternate, then you’re going to really love todays three alternates!
This is going to take some time….
lol.
It’s not the alternates that’s so fun. Its the being able to pick them off one by one till there’s only a winner left!
Buying gold in 2016 is like buying stocks in 1941
Avi Gilburt – EW – Mar 18, 2016 7:23 a.m. ET
http://www.marketwatch.com/story/buying-gold-in-2016-is-like-buying-stocks-in-1941-2016-03-18?mod=MW_story_trending&Link=obnetwork
Thx for article but I believe at this point in time it is unrealistic and crazy view. What would make gold go to 8000, only a war world III or some other cataclysmic event in a inflationary world? I doubt this… I saw even guy calling for 30k for gold to reach in a decade… Besides, let’s think for a second if some really bad things happen in future, even the rich people won’t afford to own so many jewelry as they do today and the poor would get rich by selling them high lol, oh… come on:)))) I am an optimist myself 🙂
Of course it is not realistic now as it is a 50 year projection.
I do wish Avi would give a chart with his analysis.
But anyway, my Grand Super Cycle analysis kind of agrees with this. I see a huge Grand Super Cycle wave III over at the all time high in September 2011.
Where I disagree is expecting that the following correction is over. I see it as Grand Super Cycle wave IV and only Super Cycle wave A down is complete.
So now we are in Super Cycle wave B upwards.
Now wouldn’t that be so much easier to digest with a chart?
Here it is. And I’ve realised it’s probably time to update that longer term picture.
Most Gold-Eagle contributions are ‘same old, same old’. However occasionally something catches my attention and this is one example.
http://news.gold-eagle.com/article/gold-forecast-2021-stealth-bull-market/120
PS. It is most interesting from the point of view of long-term investments in gold equities, wherein lies most of my investible funds.
Nice article. Thanks for posting it. 🙂 I’ve placed this projection in my notes!
Thx for article. Interesting view and somewhat realistic, can happen I believe… 🙂