
The main Elliott wave count expected upwards movement but the target at 1,267 was inadequate.
A new high above 1,269.07 has invalidated the alternate Elliott wave count at the daily chart level, leaving only one wave count now. We have some clarity for the bigger picture for Gold.
Summary: The target for upwards movement to end is now at 1,277. If price keeps rising through this target, then the next target would be at 1,289. When the channel on the hourly chart is breached by downwards movement, then expect a multi day correction has begun for a second wave. It is possible that the expected correction may not materialise soon though (this has happened before), so a buy the dips approach may be used for more adventurous traders. Each time price touches the lower edge of the channel a long position may be entered with a stop close by just below the lower edge of the channel. If the trend continues for some time, such a long position should become profitable quickly; as soon as the position is profitable and price moves up and away from the channel, move the stop to break even to limit risk. If the channel is breached and the position is negative, the loss should be cut quickly short. As always, invest no more than 3-5% of equity on any one trade and always use a stop loss.
New updates to this analysis are in bold.
To see last weekly charts click here.
DAILY ELLIOTT WAVE COUNT
Click chart to enlarge.
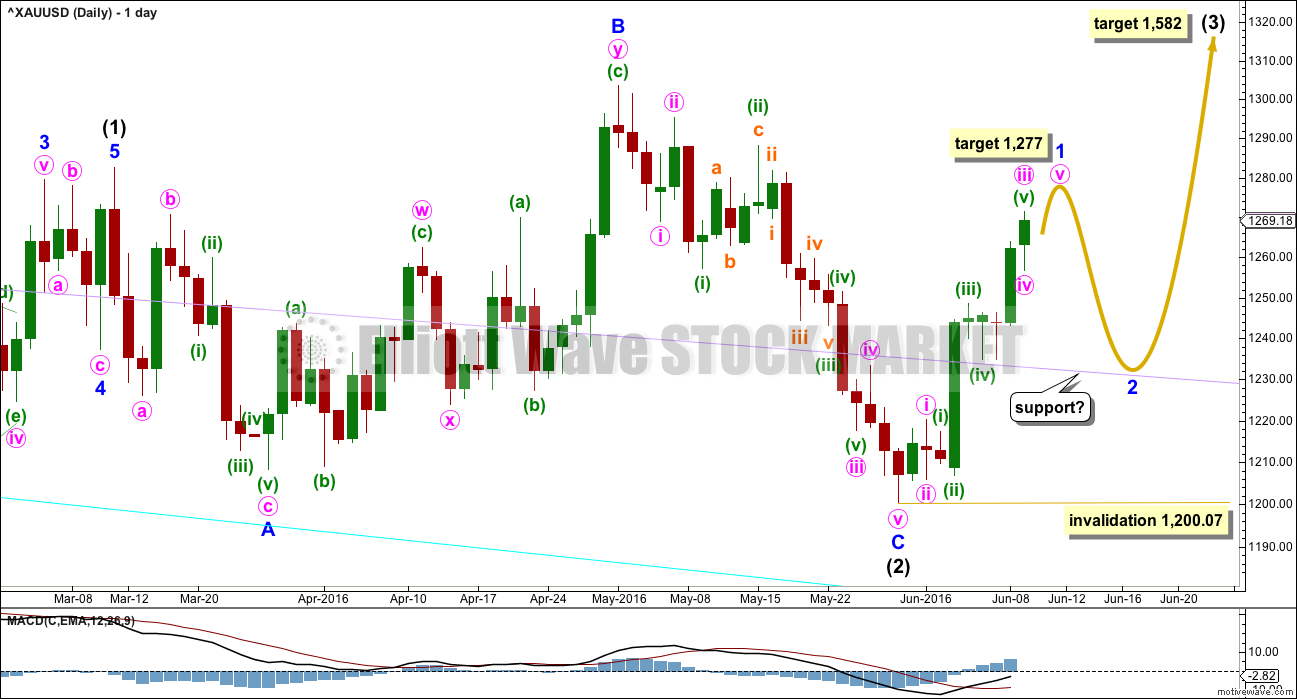
Intermediate wave (2) may be a complete expanded flat correction. It would be a shallow 0.350 correction of intermediate wave (1) lasting 56 days, just one more than a Fibonacci 55. There is no Fibonacci ratio between minor waves A and C. Minor wave C is a complete impulse.
Within intermediate wave (3), no second wave correction may move beyond the start of its first wave below 1,200.07.
When minor wave 1 is complete, then a following second wave correction should unfold and last about one to two weeks. If this wave count is correct, then the upcoming second wave correction may offer an opportunity to join the upwards trend at a good price. If minor wave 2 is deep, then it may find support at the lilac trend line (copied over from the weekly chart). Weekly and daily charts are always on a semi-log scale.
At 1,582 intermediate wave (3) would reach 1.618 the length of intermediate wave (1).
MAIN HOURLY ELLIOTT WAVE COUNT
Click chart to enlarge.
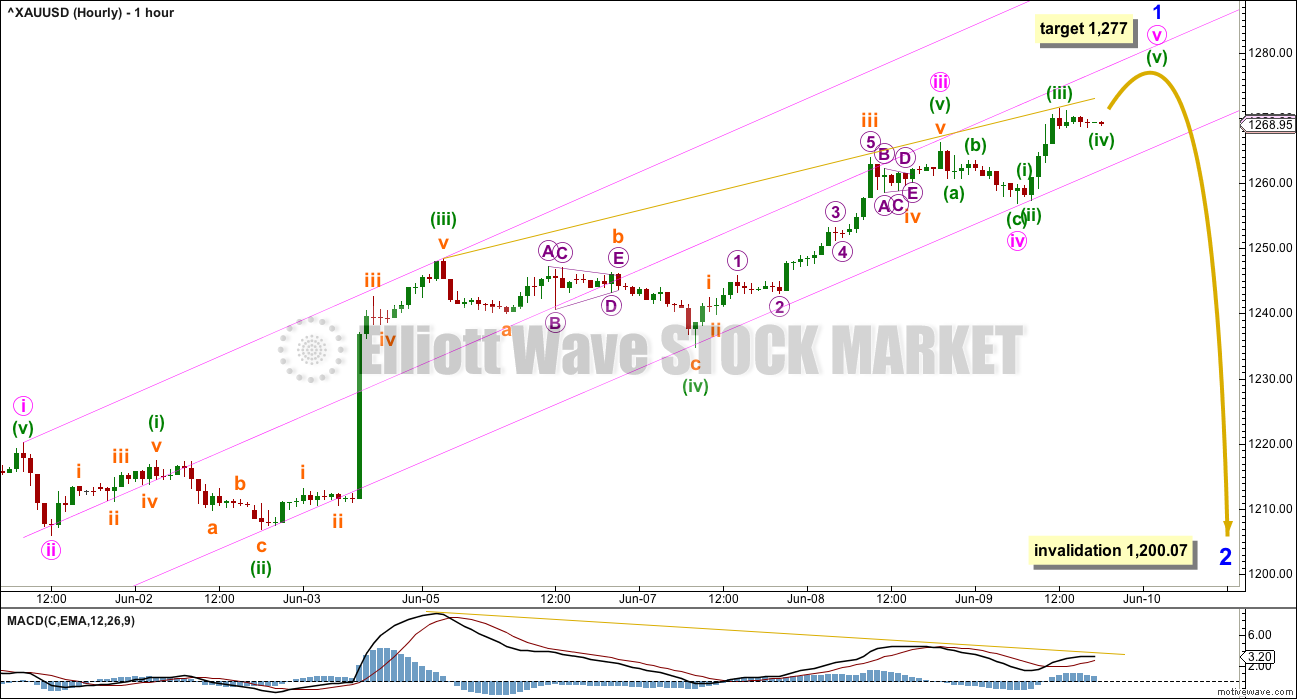
It is clear that with price continuing higher minor wave 1 was not over at the last target.
The end of minute wave iii may have been complete at the last high. The middle of minute wave iii so far has strongest momentum. This wave count still fits with MACD.
There is still no Fibonacci ratio between minute waves i and iii. It is still more likely that minute wave v will exhibit a Fibonacci ratio to either of minute waves i or iii.
At 1,277 now minute wave v would reach equality in length with minute wave iii. If this target is reached and price keeps going up, then the next likely ratio for minute wave v would be to reach 1.618 the length of minute wave i at 1,289.
So far within minor wave 1 the strongest extension is the third wave. So far there is double bearish divergence at the hourly chart level with price and MACD (gold lines on price and MACD). The fifth wave so far does not look like it will be a swift strong extension.
Gold, like all commodities, has a tendency to exhibit strong fifth waves. This tendency commonly turns up at the end of its third wave impulses, not so often at the end of its first wave impulses. It is when price is nearing the end of minor wave 3 within intermediate wave (3) that we may see a blowoff top in Gold, and possibly also the end of intermediate wave (3). For now price is early on in this upwards trend. Gold often will exhibit one to a few more time consuming corrections early on, so that the whole movement has a curved look.
Although it is possible that members may miss out on joining a good upwards trend at this stage, it would still be more likely that minor wave 2 will turn up sooner rather than later and will offer a good entry point. This statement is based upon my experience, and today it is supported by declining volume, declining momentum, declining ATR, and price sitting within the lower half of the pink channel.
When the channel is breached by a full hourly candlestick below and not touching the lower edge, preferably by clear downwards (not sideways) movement, then the channel shall be indicating a short term trend change for Gold. At that sage, draw a Fibonacci retracement along the length of minor wave 1 (on the hourly chart on an arithmetic scale). Use the 0.382 and 0.618 Fibonacci ratios as targets for minor wave 2, favouring the 0.618 Fibonacci ratio.
So far minor wave 1 has lasted nine days. It may not exhibit a Fibonacci ratio or it may continue a further four days to total a Fibonacci thirteen. Minor wave 2 may be expected to last about a Fibonacci five or eight days, or possibly longer.
TECHNICAL ANALYSIS
DAILY CHART
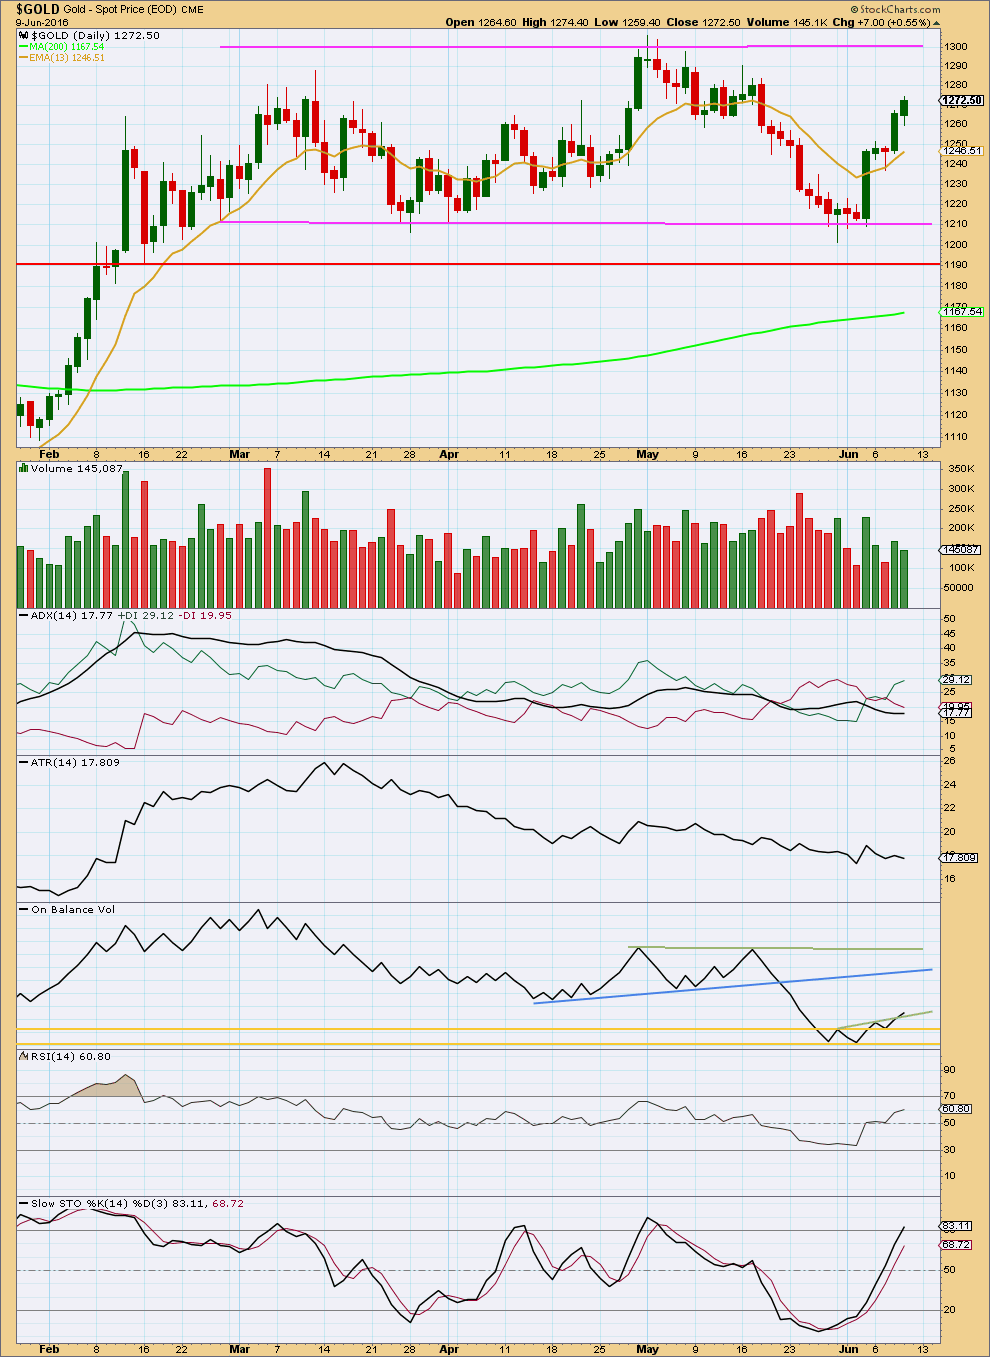
Click chart to enlarge. Chart courtesy of StockCharts.com.
Another upwards day comes with a decline in volume. There is less support today for the rise in price, and it looks like this upwards trend may be weakening today.
ADX is still very slightly increasing indicating an upwards trend is now in place. ATR today still disagrees as it declined today. Some disagreement between these two trending indicators may be expected in the early stages of a new trend.
On Balance Volume is giving another weak bullish signal today with a break above the short green trend line. A break below either of the horizontal yellow lines would be a strong bearish signal now from OBV. OBV should find support particularly at the lower yellow line. If the correction that is expected for minor wave 2 unfolds, then it may end when OBV comes to touch the lower horizontal yellow line.
RSI exhibits no divergence today with price to indicate any weakness. RSI is not yet extreme, so there is still room for price to rise further.
Stochastics is just beginning to enter overbought, so the rise in price may end soon.
This analysis is published @ 07:31 p.m. EST.
LARA- I really appreciate your very dedicated and professional analysis and comments, everything you do is very high quality.
You provide excellent customer service.
It is obvious that you put your heart into your work. It really makes a difference.
Wave Master Lara, Enjoy your weekend, I can hear the surf calling you to come play instead of working in the waves.
I wonder if you have to count the waves patterns like a Fibonacci to catch a good one or is that where you get away from waves counts. LOL
LOL
I’m sitting on the beach as I type this… set up underneath an umbrella with my laptop, watching Cesar surf bigger 4ft waves while I work. Happy… not happy… waves too big for me to get my longboard out in this. Tomorrow will be smaller and I can play too…
Waves often (not always) come in sets of three, the second or third is often the best, I’ve learned patience when surfing, wait for the one with the better shape that’s a bit bigger to ride….
Just like trading actually.
Work now, play later 🙂
And thanks for the kind words Richard. May you, and all members, have as fun a weekend as it looks like I’m going to have!
Tomorrow should be 2-3ft and offshore, perfect for me 🙂
Turns out the surf today was more like 4-5ft. I know my limits!
I won’t surf in waves too big for my longboard, nor waves that scare me.
Just like I won’t trade UVXY or anything with way too much volatility 🙂
Gold keeps going up…. keeps finding support at the lower pink trend line.
There is now strong persistent divergence with price and MACD at the hourly chart level…
Volume and RSI will be very important today. If today’s up move comes with lighter volume then it would look weaker, if volume increases then it would look stronger and I’d expect a green candlestick for Monday.
If there is any divergence with price and RSI I’d expect a high in place. No divergence doesn’t mean a high can’t be in place, it just wouldn’t be indicated.
Volume will again be important today.
The bottom line: while price is still finding support at the channel assume the trend remains the same, up. As soon as that channel is breached expect minor 2 has arrived.
Tentative chart…
minuette (v) may not be over
a new low below 1,264.49 now would confirm it is over and would breach the channel, that would be a good confirmation point of a trend change
GDX possible pullback targets
Agree with Syed. Sorry, was at Lara’s other site.
Just took a look at gold.
At the moment, we are at the final stages of Minute 5 minuette 5 subminuette 5 of Minor 1. Gold has most likely completed micro 2. Price should complete Minor 1 close to today’s high @ 1278.24. Unless micro 3 and/or micro 5 rise higher than their normal Fib patterns, we may even have a truncation.
I’m not keen to trade the Minor 2 correction, waiting only to go long at the end of it. So, it’s off to bed. Folks, enjoy your weekend.
IMHO with 1266-64 holding, another pop through 1277 for take out 1283+ most likely….
Just an idea. 5 Wave top at 1280?
Gold already hit the 1 hour support line and is sitting on it now.
http://www.pmbull.com/gold-price/
use the 1 hour time frame
Is the 1277 a hard number that can’t be exceeded by 1 dollar(1278.24)? I’m wondering if we still need to be looking for the 1289 now… or what decline now would confirm that the 1278 was close enough and 2 down was underway? Does that green support line need to be crossed?
http://www.pmbull.com/gold-price/
Throw me a bone here?!? 🙂 Thanks!
Yes the green support line at pmbull needs at least 1 full hourly candlestick below it.
“lower half of the hourly pink channel.
When the channel is breached by a full hourly candlestick below and not touching the lower edge, preferably by clear downwards (not sideways) movement, then the channel shall be indicating a short term trend change for Gold.”
Thanks RB!…. so it is possible that 1278 was close enough to Lara’s 1277 and could be the top for now? it was only breached for a few minutes?! As exact a science as this may be, there are so many variables!
The 1277 is not a hard number.
Targets are indications of where price may end up. Never hard numbers.
Invalidation points are hard numbers. If breached it means that wave count at that time frame was wrong.
heading for support, will we breakthrough this time?
GDX gap up today has filled. If gold has topped, lets see if the next lower gap gets filled in the next couple of days.
Lara’s new GDX Analysis is PUBLIC access today
http://elliottwavegold.com/
Gold day high $1,278.24 at 10:15 am exceeded 1,277 target.
Is 1,289 target in play?
If price keeps rising through this target (1,277), then the next target would be at 1,289.
What is our next target if 1277 is too low?
It’s in the summary, right at the top of today’s analysis. 1,289 🙂
Now you’ve had a comment approved the next one won’t go into moderation.
Lara- Is it time for updating Grand Super cycle wave analysis???
thanks.
Probably.
Again it looks like price is bouncing up off that lower trend line…
Another look at GDX gaps
https://goldpredict.com/?p=4195
Dreamer thanks for your extensive gap analysis.
Lara did mention in today’s Technical Analysis section that it appears gold is getting weaker.
I’m really hoping that Friday gold just hits 1277 then sells off a lot the whole afternoon for once and no exhaustion gap.
Although gold tends to go up on Monday of a US FED FOMC week as it is on Wednesday at 2 pm. Perhaps the rest of the FED presidents may be warning next week of a possible interest hike and then Janet may state that last Friday’s terrible US jobs report was a one off report as the US economy and inflation is on target for another interest rate hike in fact 2 hikes this year and wham then gold drops $50 down to $1,230 in a week for us to quickly buy miners, when they are down but a day or two before gold even hits the lower target like it did the end of May as when gold stalls then miners start back up as 1 billion investors know to Buy the Dip in gold.
Hopefully Friday or latest Wednesday gold breaches the hourly channel bottom so miners can drop and we all jump in fast without the gold train even stopping at the lower target before turning back up.
I may be dreaming. I may have an exhaustion gap and need sleep, goodnight one and all great Lara’s subscribers and EW Queen Lara herself, whon always deals with things very well as she is truly a class act.
Thank you Richard 🙂
GDX analysis written, being proofed now.
Following up on the conversation between Richard and Lara on whether or not we get a decent pullback on gold and the miners. The miners are looking very bullish. With a potential breakaway gap, we may not the gap fill that we are hoping for. It’s even possible that we get one more gap up before a pullback. If that happens, the final gap may be an exhaustion gap. That gap would be expected to get filled. Either way, not expecting much of a pullback. Two possible paths are shown.
Gap examples
There’s an important long term trend line that price has just come up to on GDX:
Draw it from the ATH in September 2011 to the first major swing high in the bear market on September 2012. On a semi log scale price is almost right up at that line yesterday and today.
It’s possible that may offer enough resistance for a downwards reaction. How GDX behaves in the next few days may indicate.
Lara, would you agree that the large gap on $HUI (and GDX) is a “breakaway” gap? Chart by Plunger.
Full analysis here: https://goldtadise.com/?p=372967
Yes, it looks like that to me.
The next gap up may be a runaway gap; if the next day closes up then it probably is, but if the next day closes down into that gap it may be an exhaustion gap.
If volume on the day that gapped up was stronger then I’d be more sure of that. But StockCharts don’t have volume data for HUI
I would think that the light volume might indicatee that this is not a wave one up, is there a chance this is a b. Wave with C to follow? I wonder if brexit would cause a bit of a dollar stampede and a market and gold swoon.
I did see an article or two Wednesday that blamed Brexit for the gold increase due to the safe haven effect.
The U.S. dollar briefly tumbled Thursday to its weakest level against the yen in more than a month as worries about a possible U.K. exit from the European Union drove investors into haven plays.
http://www.marketwatch.com/story/dollar-weakness-persists-as-fed-rate-cut-expectations-soften-2016-06-09