
A little upwards movement was followed by some downwards movement, exactly as expected.
Summary: The trend is up. The target remains at 1,582. Corrections are an opportunity to join the trend. Invest no more than 3-5% of equity on any one trade and always use a stop loss on all trades. In the short term, another small second wave correction has arrived and may end about 1,325. The invalidation point is at 1,312.50 and stops may be set just below this point. If price breaks below 1,312.50, then the target for a deeper pullback to end would be 1,296.
New updates to this analysis are in bold.
Grand SuperCycle analysis is here.
Last weekly chart is here.
DAILY ELLIOTT WAVE COUNT
Click chart to enlarge.
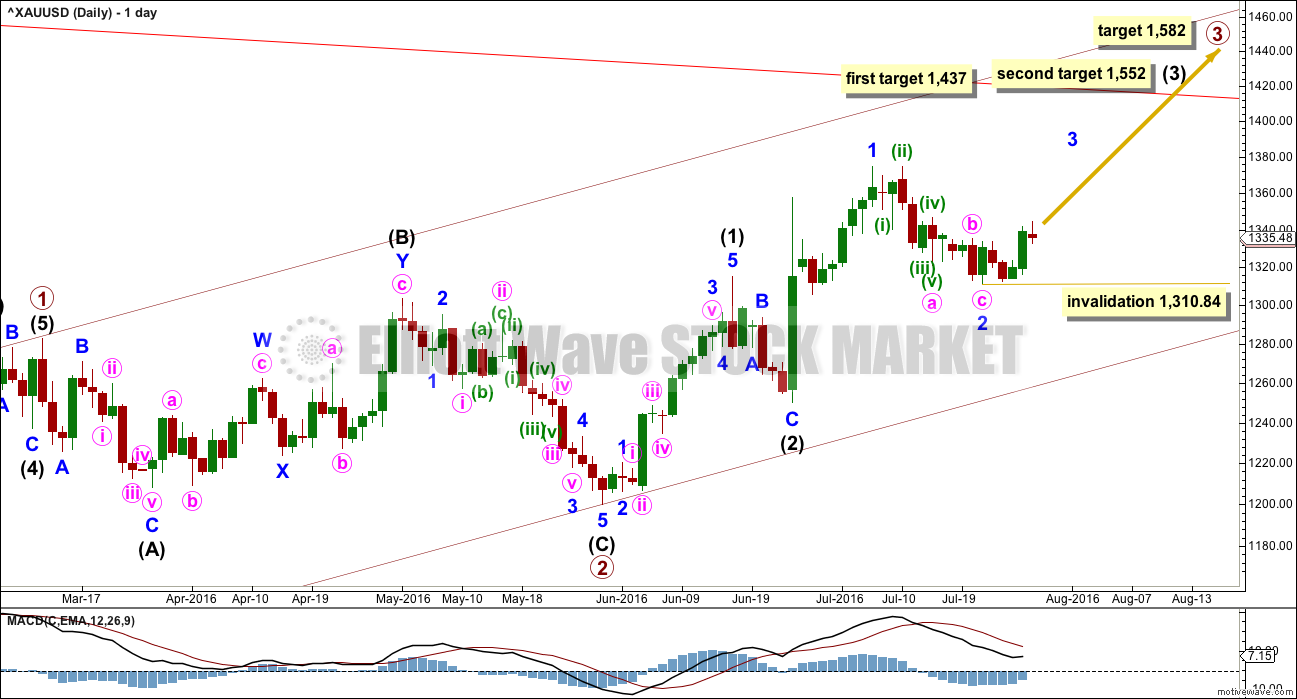
Primary wave 2 is a complete expanded flat correction. Price from the low labelled primary wave 2 has now moved too far upwards to be reasonably considered a continuation of primary wave 2. Primary wave 3 is very likely to have begun and would reach 1.618 the length of primary wave 1 at 1,582.
Primary wave 3 may only subdivide as an impulse.
So far intermediate waves (1) and (2) may be complete within primary wave 3. The middle of primary wave 3 may have begun and may also only subdivide as an impulse.
Within intermediate wave (3), the end of minor wave 1 is moved up to the last high. This fits on the hourly chart although it looks odd here on the daily chart. There was a small fourth wave correction up at the end of minor wave 1 and it subdivides on the hourly chart as an impulse. Minor wave 2 may be a complete zigzag, also subdividing as a zigzag on the hourly chart. If minor wave 2 is over, it would be 0.50 the depth of minute wave i.
No second wave correction may move beyond the start of its first wave below 1,310.84 within minor wave 3.
At 1,437 intermediate wave (3) would reach 1.618 the length of intermediate wave (1). If price keeps going upwards through this first target, or if it gets there and the structure is incomplete, then the next target would be at 1,552 where intermediate wave (3) would reach 2.618 the length of intermediate wave (1).
HOURLY ELLIOTT WAVE COUNT
Click chart to enlarge.
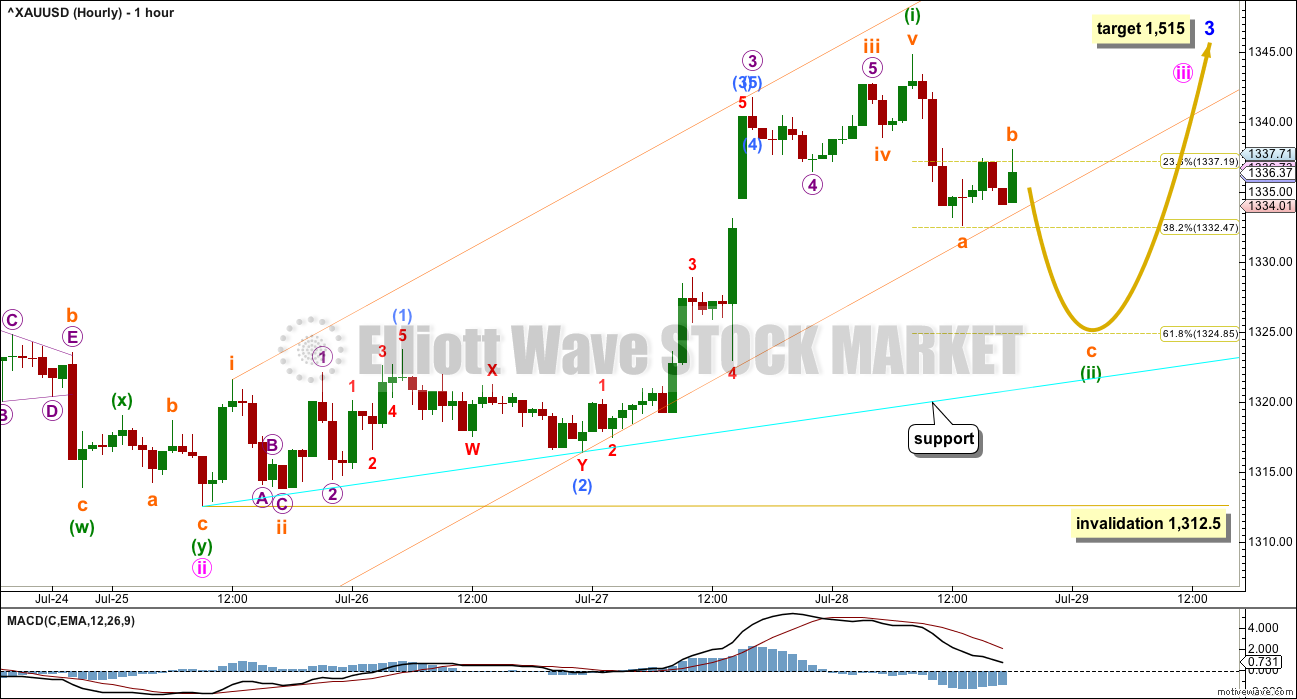
Minute wave iii may only subdivide as an impulse. At 1,372 it would reach 2.618 the length of minute wave i. If this target is wrong, it may be too low. If this target is right, then minute wave v would be a swift strong extension, which is what should be expected.
Minute wave iv may be expected to be very brief and shallow, so that minor wave 3 has a curved look. Gold often exhibits swift strong fifth waves, and this tendency is particularly prevalent for Gold’s third wave impulses. This is what should be expected for the end of minor wave 3 and probably also the end of intermediate wave (3). These impulses look like they are developing a typically curved look for Gold. When the fourth wave corrections higher up arrives, they may be very quick and shallow and not offer good entry points to join the trend except for the most nimble and active traders.
So far, within minute wave iii, the first wave of minuette wave (i) is now complete. Minuette wave (ii) is now underway and may end about the 0.618 Fibonacci ratio at 1,325. If this target is wrong for this correction, then it may be too low. Minuette wave (ii) should have a three wave look to it.
Gold often exhibits deep and time consuming second wave corrections to start its third wave impulses.
If minuette wave (ii) looks like it is showing up on the daily chart as one or more red candlesticks or doji, it may offer an opportunity to join the upwards trend. Minuette wave (ii) may not move beyond the start of minuette wave (i) below 1,312.50.
Draw a best fit channel about this upwards movement, shown in orange. At this stage, the correction of minuette wave (ii) is finding support at the lower edge of this channel. Minuette wave (ii) should be expected to break through this support and break out of the channel.
At 1,515 minor wave 3 would reach 1.618 the length of minute wave i. This target fits only with the second higher target for intermediate wave (3) on the daily chart.
Minor wave 3 should have support from rising volume and it should exhibit stronger momentum than minor wave 1.
Intermediate wave (1) lasted a Fibonacci thirteen days. Minor wave 1 lasted a Fibonacci eight days. Minor wave 3 may be expected to last longer, about a Fibonacci thirteen or maybe twenty one days.
ALTERNATE DAILY ELLIOTT WAVE COUNT
Click chart to enlarge.
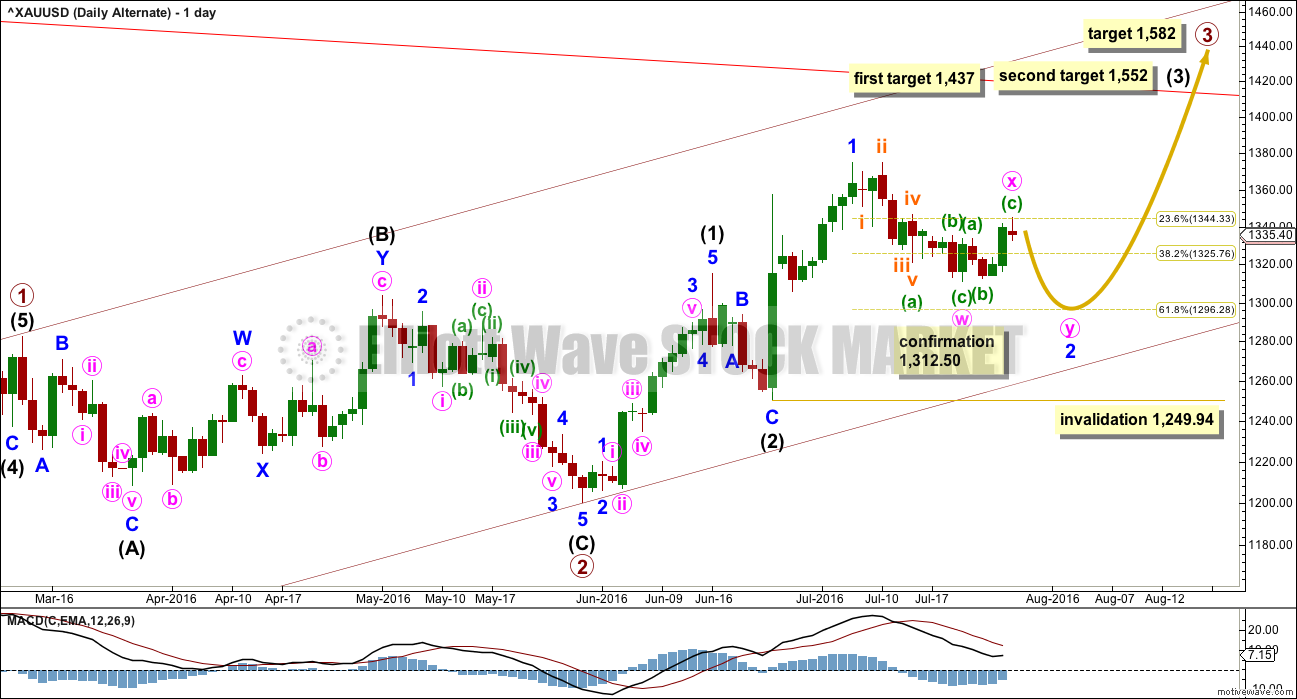
Alternates should always be considered. This alternate today will be published as a daily chart only. No hourly chart will be published for it because that would give it undue weight.
This alternate should only be used now if price makes a new low below 1,312.50, invalidating the main wave count.
This alternate is still possible in that many things are possible. It does have a reduced probability though.
It is still possible that minor wave 2 could be continuing further sideways or lower as a double zigzag or double combination. It may not move beyond the start of minor wave 1 below 1,249.94.
If minor wave 2 is continuing, then it would be much longer in duration than intermediate wave (2), one degree higher. So far intermediate wave (2) lasted six sessions, and minor wave 2 would be in its fifteenth session but only just over half way through. At its end, minor wave 2 would be grossly disproportionate to intermediate wave (2). For this reason, this alternate wave count must be judged to have a lower probability than the main wave count today.
If minor wave 2 is continuing sideways as a double combination, then within it minute wave x may make a new high above the start of minute wave w at 1,374.91. There is no upper invalidation point for this alternate wave count, so there cannot be an upper confirmation point for the main wave count.
This alternate is presented again today because it has some support so far from volume; the short term volume profile is bearish still.
TECHNICAL ANALYSIS
WEEKLY CHART
Click chart to enlarge.
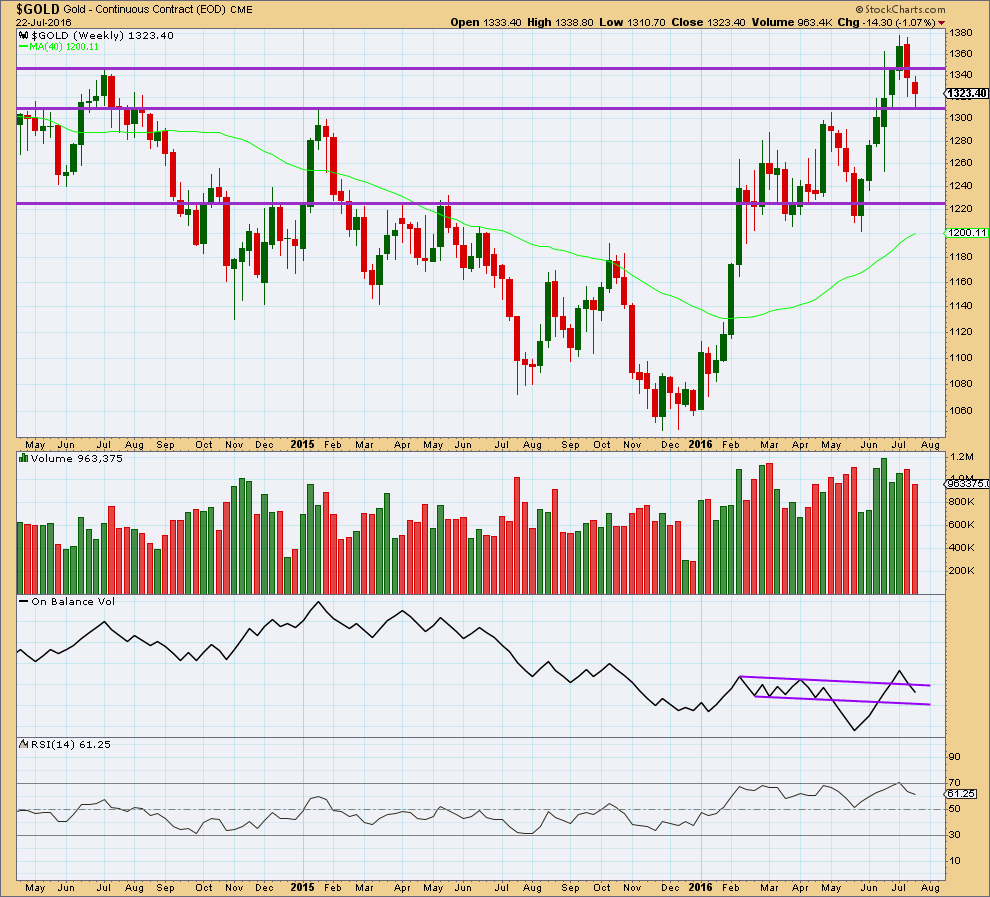
The week before last week completed a bearish engulfing candlestick pattern that was supported by an increase in volume. This bearish reversal pattern indicated a trend change from up to either down or sideways.
This weekly candlestick completes another red candlestick with lighter volume than last week. The fall in price last week was not supported by volume. Volume last week was lightest for six weeks, so this decline is significant. This last downwards week looks like a counter trend pullback within a larger upwards trend. The prior rise in price was supported by volume.
The reversal implications of the bearish engulfing candlestick pattern may now be fulfilled. A reversal pattern only indicates a trend change and gives no indication of how far or for how long the next trend should be. It also does not mean a change from up to down or down to up but may also mean a change from up to sideways or down to sideways.
Price may be finding support at the horizontal trend line about 1,310. Two weeks in a row with longer tails on these candlesticks is slightly bullish.
On Balance Volume is not working with the upper purple line, because it broke above the line giving a bullish signal only to turn and break below the line. The lower line so far should provide support if OBV moves lower.
DAILY CHART
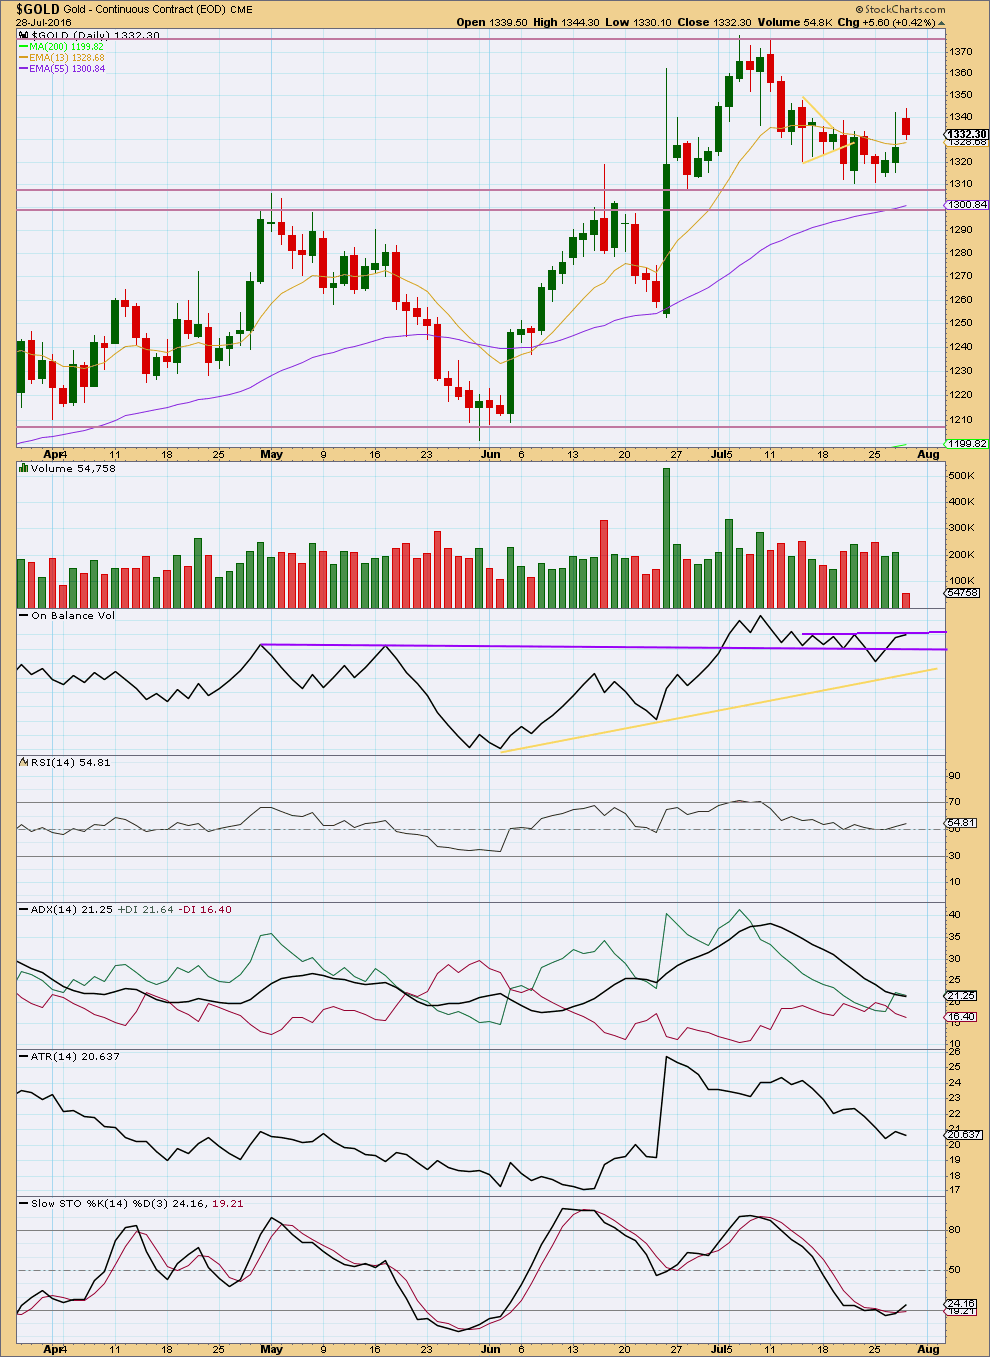
Click chart to enlarge.
Monday’s session completes a small hammer candlestick pattern. When this pattern occurs at a low after a decline, then it is a bullish reversal signal.
The last two green daily candlesticks come with an increase in volume. There was support for the rise in price from volume. Now a red daily candlestick shows much lighter volume. In the short term, the volume profile is now clearly bullish and this supports the main Elliott wave count.
On Balance Volume is finding some resistance at the upper purple trend line. If OBV breaks above this line, that would be a bullish signal. If OBV moves lower, it may find some support at the lower purple line, although this line was recently weakened by a breach. The lower purple line might serve to hold up the fall in price from moving too far.
RSI is close to neutral still. There is plenty of room for price to rise or fall.
ADX is flattening off. This pullback has brought ADX right down from extreme. There is again plenty of room for a trend to develop. Currently, ADX does not yet indicate a trend is in place.
ATR agrees with ADX. ATR is still overall declining.
Stochastics is returning from oversold. An upwards swing should be expected here as most likely, to continue until Stochastics reaches overbought and price reaches resistance. The next resistance line for price is about 1,375.
This analysis is published @ 07:34 p.m. EST.
Lara, to follow-up on Alan’s post below, this chart is directly from the Barchart.com site and it shows the spike down after BoJ announcement. Really strange that your data feed doesn’t show the same as a chart on their site. Crazy!
Lara used the cash chart GCY00. I checked yesterday after she posted her chart. That chart did not show the spike.
I agree with Alan’s sentiment, Gold should now be within the strong part of a third wave.
Draw a base channel about minuette (i) and (ii), shown here in green. The upper edge is providing resistance. When price can break through that it would confirm a third wave, then that line should provide support.
For now the lower edge of the base channel should provide support.
I think Alan and Lara are pretty much ‘on the mark’. Take a look at Avi’s short term as a comparison.
FYI, The Daily Gold thinks recent July correction is complete. They are quite bullish on the miners.
This will be an amazing series of wave 3’s up over the coming weeks.
Where is the bottom target for this retrace started at gold high at 12:04 pm at 1,350.68?
Some want to hold another $100 or $200 up and some want to day trade.
What retrace? 😉
Retrace turned out to be a 3 wave down to 12:58 at 1346.09 and 12:57 for NUGT at 156.20 then back up to 161.90 so far.
Gold and miners stronger today looks more like we’re in a third wave.
Indeed it does. Looking forward to seeing Lara’s wave count on the hourly.
Richard. We are now in a strong 3rd wave environment. I doubt if there are any strong pullbacks.
My wave count is currently at micro 3, targeting 1364-1365. Estimated future milestones are:
Subminuette 3 target 1369-1370.
Minuette 3 target 1376-1377.
Minute 3 target around 1387.
Minor 3 target 1515.
Intermediate 3 target 1552.
Primary 3 target 1582.
Alan, (I’m using pmbull’s Gold chart)
based on your 2:20pm comment, do you think that subminuette c of minute (ii) bottomed w/spike down @ 1328.58 @ 11:30pm EST last night, Or; (ii) ended @ 4:15am 1330.21 (truncated?)?
Thank you.
Thanks Melanie. I am also using pmbull data. I think you are referring to minuette 2 (must have been a typo).
I still have not resolved that issue. The chart that Lara follows did not have a low at 1328.58. But, in any case, it is not important any more as the bottom at 1330.31 is clearly marked. (I do have an alternate in which minuette 2 continues as a combination with an expanded flat as wave c. However, that would have been invalidated at 1353.72, which current price movement did).
As a result, the only wave count is the one that points towards a series of 4th and 5th waves (I have 7 of them in all) to complete up to Primary 3, which could very well be the end of this uptrend.
Thank you…Allen
Yes, I did mean minuette (ii) and your targets are very clearly laid out.
May I assume…Alt. count invalidated @ 1353.72 because ‘b’ would be too large compared to ‘a’?
(I ask because other websites have been looking @ this Alt. also.)
To me, this looks and feels like a ‘3’.
Thanks again
Melanie, you are absolutely correct. The “b” wave of c is larger than 2 times the “a” wave.
SELL signals 5 and 1 minute at 11:14 am for Gold and NUGT.
NUGT bottom of a 3 wave was 9:43 am at 152.20 day low.
Maybe top of a 5 wave at 11:14 am at 162.50 day high?
Wave count anyone for peak or possible retrace now?
Surprises will be to the upside.
Gold is price confirmed already bottomed minuette (ii) is now completed at 1330.31 at 4:16 am as 8:30 am big US news spiked gold up to $1,349 at 9:04 am EST.
“At this stage a new high above the end of subminuette b at 1,342.79 would be strong price confirmation that minuette (ii) is over.
Then price may be in the early stage of a third wave up at five degrees.
If this wave count is correct then upwards momentum should really start to build in the next week.”
13 minute video. Worth it if you have time
GGF Video 07/28: The 175% Advance in Gold Stocks in 5 Months, 22 Days Now Places Us As the 11th Greatest 1st Leg Up in Any Bull Market in Any of the Tangible Assets During the Past 150 Years. In Other Words, it is the Elite of the Elite.
http://www.gannglobal.com/webinar/2016/July/16-07-28-321gold-VideoGrp1.php
I expect that minuette (ii) is now close to completion. At 1,323 subminuette c = 1.618 X subminuette a, this is close to the 0.618 Fibonacci ratio at 1,325.
So now we may have a $2 target zone for this correction to end.
If I’m wrong then my target will be too low. If a small channel is drawn about minuette (ii) then right now price is at the lower edge, finding support.
That channel isn’t drawn on the chart above.
Draw a corrective channel from the start of subminuette a to the end of subminuette b, then place a parallel copy on the end of subminuette a.
At this stage a new high above the end of subminuette b at 1,342.79 would be strong price confirmation that minuette (ii) is over.
Then price may be in the early stage of a third wave up at five degrees.
If this wave count is correct then upwards momentum should really start to build in the next week.
And so now I’m wondering, what could I have wrong here? What else could be happening?
Always it’s wise to be very cautious when your wave count expects such a great move. It seems too often the expectation is not met with price action.
So far the alternate is my best idea of what else could be going on. But I don’t like it. The proportions are horrible.
Sometimes I get ideas after a good nights sleep. Sad but true, I dream of wave counts 🙁
Good luck everybody!
Cheers for the update Lara,get some good sleep ?
Hi Lara. I notice that your chart is slightly different from the one I had from pmbull, but that difference is substantial to the wave count, that’s why I would like to point it out.
At the time when the BOJ released the news, pmbull chart showed gold spiked down to 1328.58 before spiking up to 1343.95. This is highlighted by the oval in the chart appended. That is why I had my wave count posted as such this morning at 12:49 am. I used 1328.58 as wave a. And that is the reason also for Geoffrey’s comments at 11:57 pm ET. This would certainly affect our estimates as to when minuette 2 ends.
I wondered what you were all talking about, a BoJ spike…. Now I see.
Yeah, it does make quite a difference, at least short term if not longer.
It’s a perennial problem with Gold cash data, this difference in data feeds.
I can’t change my wave count to include this though. I have to stick with COMEX data.
Thanks for clearing up my confusion Alan!
“At 1,515 minor wave 3 would reach 1.618 the length of minute wave i. This target fits only with the second higher target for intermediate wave (3) on the daily chart.” –> At 1,515 minor wave 3 would reach 1.618 the length of minor wave 1?
You’re right, thanks. I’ll fix that.
There are 2 possibilities for Minuette 2.
(1) The spike down after the BOJ announcement terminates Minuette 2. The wave count : 1345.70 – 1332.55 – 1340.41 – 1328.58.
(2) The spike down may only be wave a. The wave count : 1345.70 – 1328.58 – (1343.95) – downward c wave.
* I place 1345.95 within brackets because it is still unknown at this point in time whether that ends the b wave.
The only way I know of to resolve this is that option 2 is correct IF prices FALL below 1328.58 in the c wave. Price rise above 1345.95 is no guarantee because Minuette 2 can be an expanded flat.
I am more inclined to believe option 2 is correct because:
(a) The first second wave in a strong third wave environment tends to be time consuming. In the first option it is over too quickly.
(b) I have been caught too often with second waves being just a simple impulse. Usually they are more lengthy.
(c) Personal reason: I can’t trade ETFs in non US trading hours.
Hi Alan
I’m going up to Singapore again mid August for a few days. Do you fancy lunch/coffee/beer to swap notes?
Hi Johno. Most unfortunately, I’ll be out of town the major part of August on a business trip. I’ll still have access to the forum and would still post.
Great analysis Alan, much obliged for your sharing. Although not definitively yet, it indeed looks as though your option 2 might be playing out, which accords with Lara’s hunch in her comment below.
Could minuette ii be over with spike down after BoJ announcement?
It’s possible… but I really would have expected it to break out of the channel that contains minuette (i). It hasn’t done that yet.
Price may still be within subminuette b.
If we see a new high though that would reduce in probability.
Look out for surprises to the upside with a big third wave winding up.
Excellent thanks for the assessment.
I’m working on that assumption because submin (c) reached close to equality with submin (a). Also, Lara’s regular warnings to be prepared for upside surprises should be very relevant at this point.
GDX update