
A correction was expected to end about 1,325.
Price did move lower but only to 1,330 before turning upwards.
Summary: The trend is up. The target remains at 1,582. Corrections are an opportunity to join the trend. Invest no more than 3-5% of equity on any one trade and always use a stop loss on all trades.
New updates to this analysis are in bold.
Grand SuperCycle analysis is here.
Last weekly chart is here.
DAILY ELLIOTT WAVE COUNT
Click chart to enlarge.
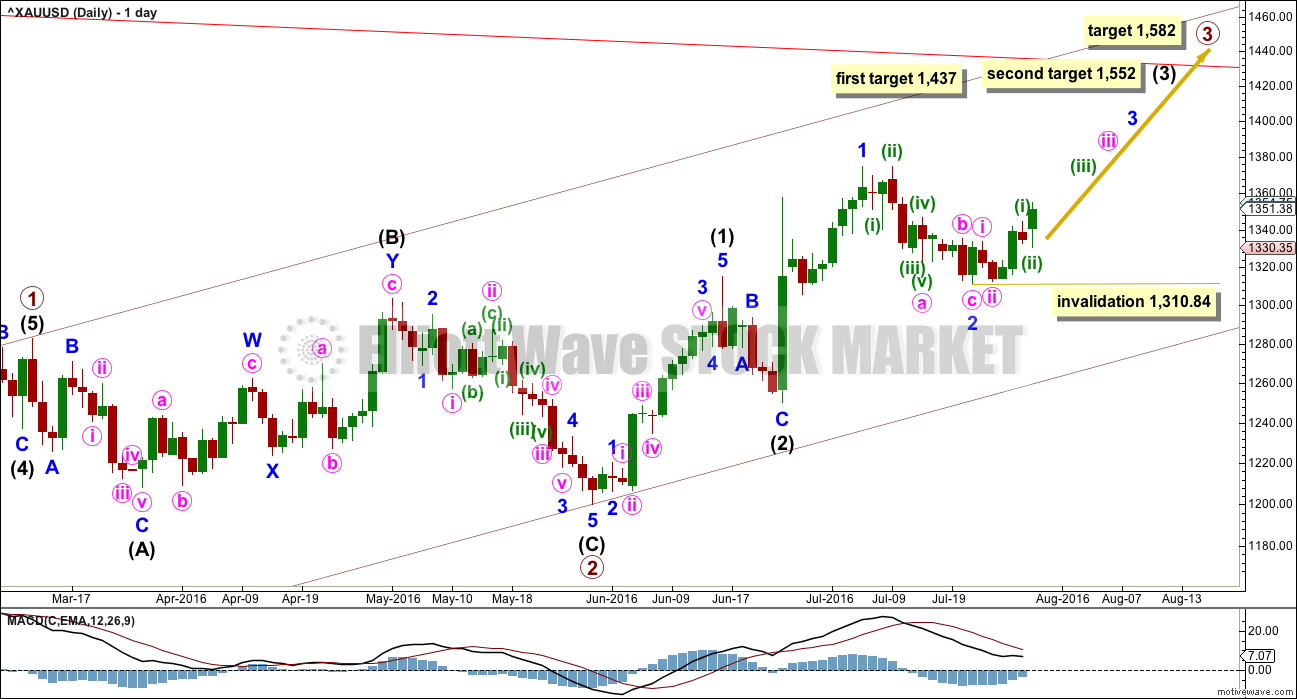
Primary wave 2 is a complete expanded flat correction. Price from the low labelled primary wave 2 has now moved too far upwards to be reasonably considered a continuation of primary wave 2. Primary wave 3 is very likely to have begun and would reach 1.618 the length of primary wave 1 at 1,582.
Primary wave 3 may only subdivide as an impulse.
So far intermediate waves (1) and (2) may be complete within primary wave 3. The middle of primary wave 3 may have begun and may also only subdivide as an impulse.
Within intermediate wave (3), the end of minor wave 1 is moved up to the last high. This fits on the hourly chart although it looks odd here on the daily chart. There was a small fourth wave correction up at the end of minor wave 1 and it subdivides on the hourly chart as an impulse. Minor wave 2 may be a complete zigzag, also subdividing as a zigzag on the hourly chart. If minor wave 2 is over, it would be 0.50 the depth of minute wave i.
No second wave correction may move beyond the start of its first wave below 1,310.84 within minor wave 3.
At 1,437 intermediate wave (3) would reach 1.618 the length of intermediate wave (1). If price keeps going upwards through this first target, or if it gets there and the structure is incomplete, then the next target would be at 1,552 where intermediate wave (3) would reach 2.618 the length of intermediate wave (1).
HOURLY ELLIOTT WAVE COUNT
Click chart to enlarge.
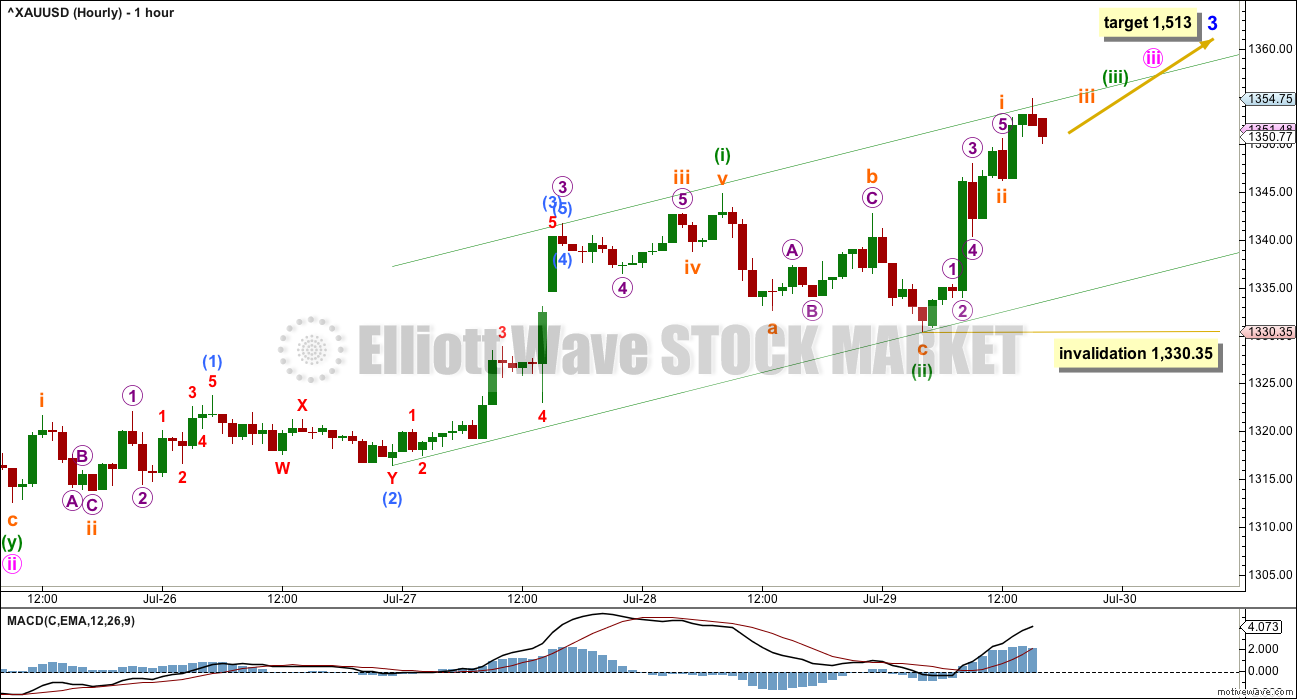
Minute wave iii may only subdivide as an impulse. At 1,372 it would reach 2.618 the length of minute wave i. If this target is wrong, it may be too low. If this target is right, then minute wave v would be a swift strong extension, which is what should be expected.
Minute wave iv may be expected to be very brief and shallow, so that minor wave 3 has a curved look. Gold often exhibits swift strong fifth waves, and this tendency is particularly prevalent for Gold’s third wave impulses. This is what should be expected for the end of minor wave 3 and probably also the end of intermediate wave (3). These impulses look like they are developing a typically curved look for Gold. When the fourth wave corrections higher up arrive, they may be very quick and shallow and not offer good entry points to join the trend except for the most nimble and active traders.
So far, within minute wave iii, the first wave of minuette wave (i) is now complete. Minuette wave (ii) completed as a relatively shallow zigzag with an obvious three wave look to it. Minuette wave (ii) is only 0.45 the depth of minuette wave (i). Because this second wave correction is relatively shallow price may now begin to move more strongly higher early next week as the strong upwards pull of a big third wave forces corrections to now become more brief and shallow.
The green channel here is adjusted to be a best fit. Along the way up, price may find support at the lower edge. When the upper edge is breached, then that may provide support. Expect the upper edge to be breached as the middle of a strong third wave approaches.
Within minuette wave (iii), no second wave correction may move beyond the start of its first wave below 1,330.35. This invalidation point allows for the possibility that my labelling of subminuette waves i and ii, within minuette wave (iii), may be wrong.
At 1,513 minor wave 3 would reach 1.618 the length of minor wave 1. This target fits only with the second higher target for intermediate wave (3) on the daily chart.
Minor wave 3 should have support from rising volume and it should exhibit stronger momentum than minor wave 1.
Intermediate wave (1) lasted a Fibonacci thirteen days. Minor wave 1 lasted a Fibonacci eight days. Minor wave 3 may be expected to last longer, about a Fibonacci thirteen or maybe twenty one days. So far it has lasted only six.
The alternate will no longer be published. It did not have an upper invalidation point, so technically it remains valid, but the structure at the hourly chart level no longer makes sense and the proportion at the daily chart level is now too far out for the right look.
TECHNICAL ANALYSIS
WEEKLY CHART
Click chart to enlarge.
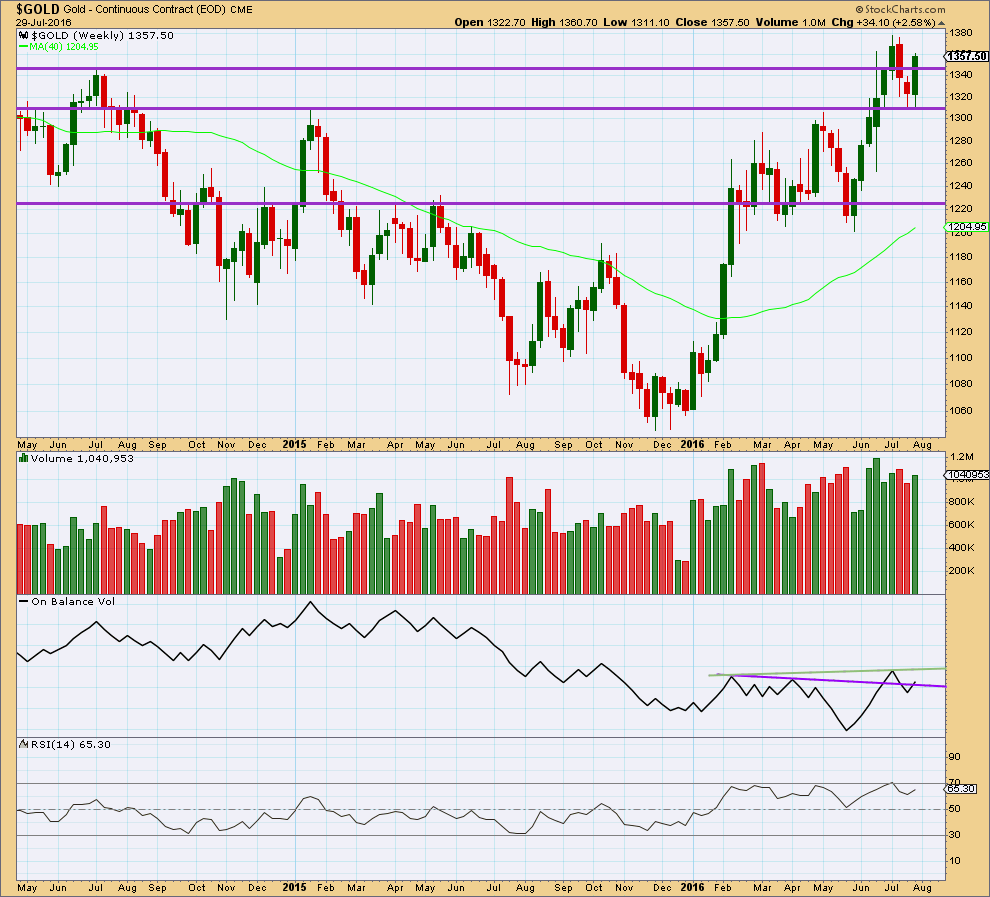
This week completes a bullish engulfing weekly candlestick that has stronger volume than the last week. After a short downwards movement, this is a reversal pattern from down to up or down to sideways.
Price broke above resistance this week about 1,345 and closed above this line. Next resistance would be about the last high about 1,380.
On Balance Volume is giving a bullish signal at the end of this week with a break above the purple trend line. The next line to offer resistance for OBV is the new green line.
RSI is not extreme yet. There is room for price to rise further.
Overall, the weekly volume profile is bullish. Volume increases as price rises and volume declines as price falls. There is no indication yet of an end to this upwards trend at the weekly chart level.
DAILY CHART
Click chart to enlarge.
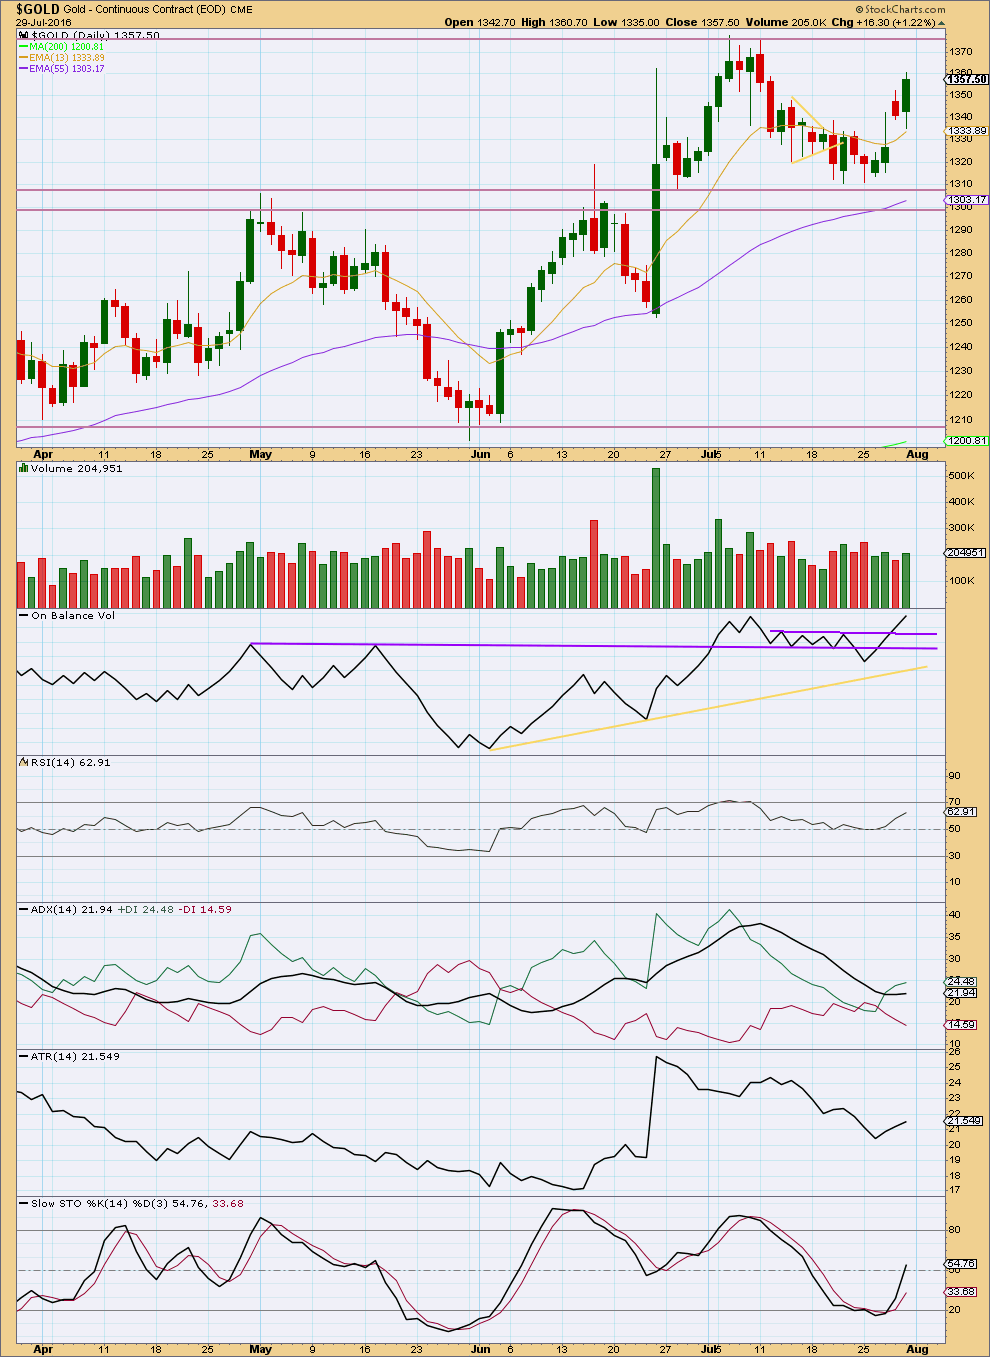
The week ends with a reasonably strong upwards day on higher volume than the prior downwards day. The rise in price for Friday has some support from volume, so it is not suspicious. Downwards movement for Friday found support about the 13 day moving average (this average tends to be fairly useful when Gold is trending).
On Balance Volume is giving a strong bullish signal at the end of this week with a breach of the short purple trend line.
RSI is not yet overbought, so there is room for price to rise further. RSI may remain extreme for reasonable periods of time during Gold’s trends, particularly at the daily chart level. When it exhibits extreme and then divergence with price, then it would be indicating weakness and an approaching end to the trend. That is not the case yet.
For Friday’s session ADX is just beginning to again turn upwards. An upwards trend is indicated. With ADX now much lower, close to 20, there is room for this upwards trend to develop further. The pullback brought ADX down from extreme.
ATR is now more clearly increasing at the end of this week. This trend looks healthy.
Stochastics is neutral. There is plenty of room for price to rise.
This classic technical analysis at this stage strongly supports the Elliott wave count. It looks fairly clear that Gold is in an upwards trend.
This analysis is published @ 07:44 p.m. EST.
Hi Lara,
Since we are in the lower degree of a series of 3rd waves, Subminuette [orange] iii, could the 6 candles following your Subminuette ii (on chart presented @ 3:57pm), be properly counted as a Miniscule 5 wave impulse, of Submicro 1?
1. I ask because wouldn’t each of these 3 wave no matter the degree, tend to ‘stretch’ out?
2. If above is possible, would this likely mean that when the Gold mkt. reopens to European and Asian session, there would likely be a small/shallow correction. By the time USA opens for trading, for all of us ETF traders, we may want to be ready to add to positions very shortly after open once getting a ‘feel’ for the situation?
You are welcome to answer this tonight with your analysis. I’m simply trying to get a very detailed count since no matter what instrument (stocks or futures) traders are using to trade Gold, it looks very close to ‘taking off’.
Thank you
no, because then subminuette i would have a three wave look, the fourth wave would be too time consuming
it looks wrong
I think this is what may be happening. Another first and second wave complete.
That chart indicates that we might also have just completed a micro wave 1 and 2 as well. If that’s the case, its going to be the express elevator really soon now!!!
True, but I’m considering that possibility that it may not be over yet.
I need to spend more time with the charts before I’m fully confident of what I’m going to publish today.
Hello Gold,
What is the current Elliott wave count?
Please elaborate. Thank you.
Likely completing submicro 5 of Micro 1 of Sub-minuette 3?
I hope I’m wrong in this analysis because if I’m right, I’ve to cash out of my longs.
I see subminuette 1 completing at the high of 1355.13.
We are now in subminuette 2 down, a combination.
Wave w completed as a 3-wave zigzag at 1346.28.
Wave x is a triangle, most likely completed at 1349.88 or is finishing its d wave now.
There will be one quick thrust downwards. I’m looking at a probable target of 1339.79, the 0.618 Fib retrace.
Alan, if you’re right then you really don’t have that much of a consolidation ahead of you. Considering that and the observation that Lara’s projection seems to be on track, you might be better off riding it out.
Ok
Worth the read. Similar target to Lara’s EW with TA
https://goldtadise.com/?p=377192#comments
Lara,
I’m curious. How often does this situation occur where multiple wave 3’s happen in a series like this? (Of course, if that’s the way it plays out.)
Pretty much every time a third wave unfolds at intermediate or primary degree.
Because that’s how they begin.
It’s how the impulse of Primary 1 started.
The arrow is where we are in the equivalent point of primary wave 3 now.
Lara,
Good analysis. Thx.
MELT New bear ETF (like DUST, but only -100%)
The Direxion Daily Gold Miners Index Bear 1x Shares seek daily investment results, before fees and expenses, of 100% of the inverse (or opposite) of the performance of the NYSE Arca Gold Miners Index
http://www.direxioninvestments.com/products/direxion-daily-gold-miners-index-bear-1x-shares?utm_campaign=EUFL%20and%20MELT-%20Launch%20Email
Hi Dreamer. Thanks for the information. It is very useful. This ETF provides a good alternative to DUST which is risky for longer term trades, especially as a hedge against the prevalent trend.