
Upwards movement continues as expected for Gold.
Summary: The trend is up. Corrections present an opportunity to join the trend. Expect upwards momentum to increase in coming weeks. The target for this third wave to end remains at 1,582. The middle of it may end about 1,437, but the correction after the middle may be brief and shallow.
New updates to this analysis are in bold.
Last weekly chart can be found here.
Grand SuperCycle analysis is here.
DAILY ELLIOTT WAVE COUNT
Click chart to enlarge.
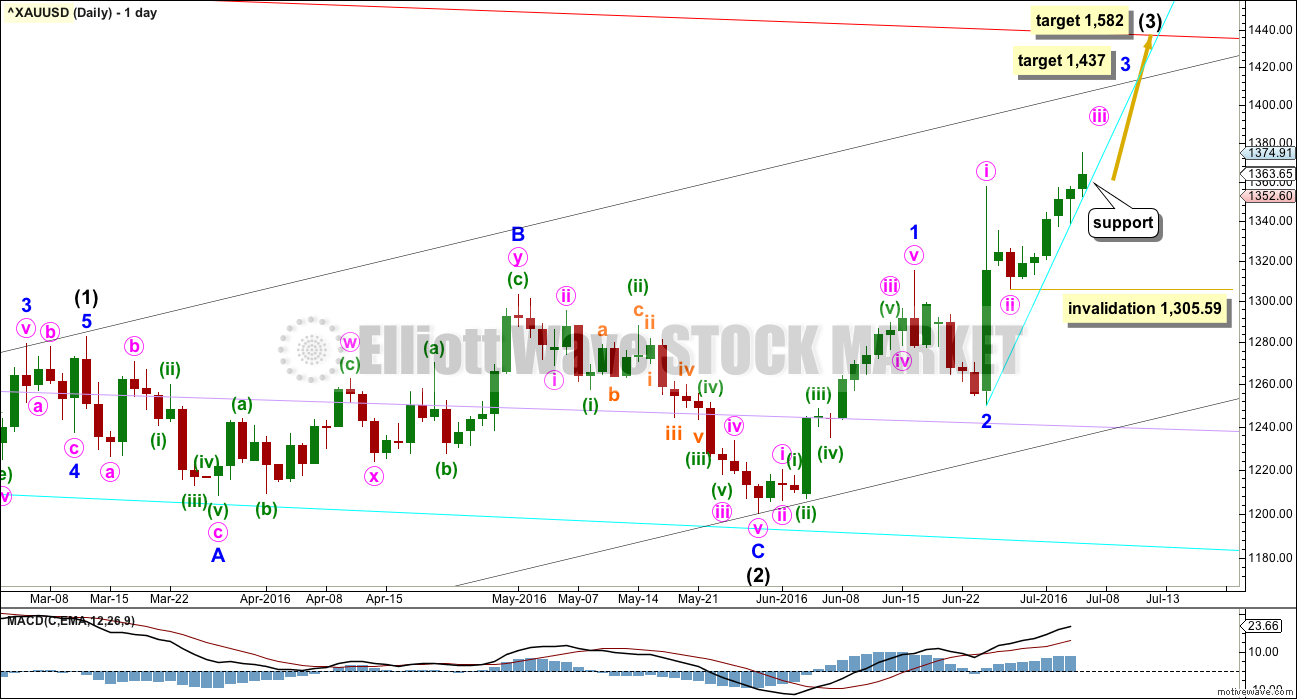
Intermediate wave (2) is a complete expanded flat correction. It is a shallow 0.350 correction of intermediate wave (1) lasting 56 days, just one more than a Fibonacci 55. There is no Fibonacci ratio between minor waves A and C. Minor wave C is a complete impulse.
Minor wave 2 may have been a quick, deep 0.57 zigzag over in just six sessions. If minor wave 3 has begun there, then at 1,437 it would reach 1.618 the length of minor wave 1.
When minor wave 3 is complete, then the following correction for minor wave 4 may be relatively brief and shallow. Intermediate wave (3) may end with a strong blowoff top typical of commodities. This may pull minor wave 4 up forcing it to be over very quickly. For position traders, the target of intermediate wave (3) may be more useful than a target for minor wave 3.
Add a base channel (black lines) to intermediate waves (1) and (2). Draw the first trend line from the low at 1,046.27 on 3rd December, 2015, to the low labelled intermediate wave (2), then place a parallel copy on the high of intermediate wave (1). Along the way up, downwards corrections should find support at the lower edge of the base channel, if they get that low. At this stage, it looks like corrections are shallow and may not reach back down to the base channel. When intermediate wave (3) moves towards the middle, it should break above resistance at the upper edge of the base channel. When that trend line is breached, then it may offer support. A break above a base channel confirms a third wave up.
Within minute wave iii, no second wave correction may move beyond its start below 1,305.59.
At 1,582 intermediate wave (3) would reach 1.618 the length of intermediate wave (1).
Adjust the support line, drawn here in cyan. At this stage, price may now continue to find support here as a third wave up accelerates towards a blowoff top. The top is still at least days away (or maybe weeks).
Intermediate wave (1) lasted 71 days (not a Fibonacci number) and intermediate wave (2) lasted 56 days (one more than a Fibonacci 55). Intermediate wave (3) should be expected to be longer in length and duration than intermediate wave (1). An early expectation may be for it to total a Fibonacci 89 days. So far it has lasted 28 days.
MAIN HOURLY ELLIOTT WAVE COUNT
Click chart to enlarge.
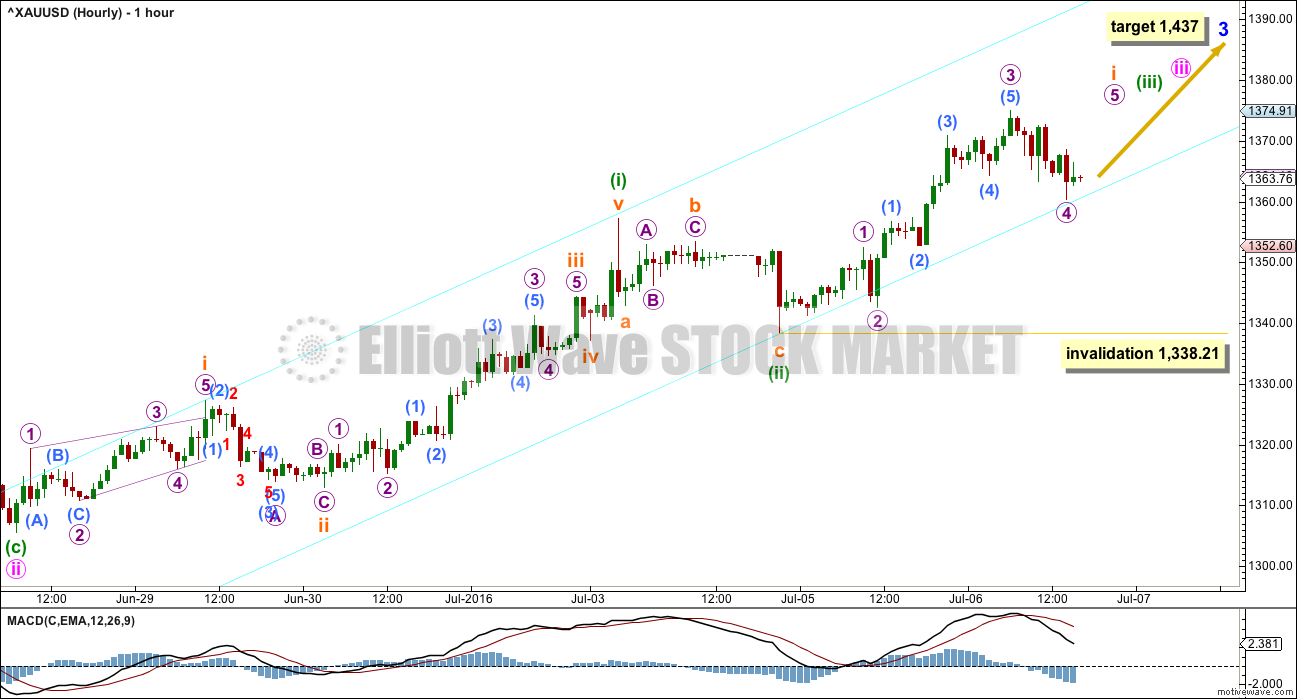
Both hourly wave counts today will show movement from the low labelled minute wave ii.
The target for minor wave 3 remains the same. At 1,437 minor wave 3 would reach 1.618 the length of minor wave 1.
If minute wave ii was very quick as labelled, then minute wave iv may be quicker still. A target is not given for minute wave iii because the following correction for minute wave iv may be too quick to show up on the daily chart.
Minute wave iii may only subdivide as an impulse. Within minute wave iii, minuette waves (i) and (ii) may be complete. Minuette wave (iii) upwards may be underway.
Minuette wave (iii) may also only subdivide as an impulse. Within minuette wave (iii), subminuette wave i may be close to completion.
Price is again finding support at the cyan trend line (here, a channel) and sitting about the same place as the cyan line on the daily chart. Each time price comes down to touch the lower edge of the channel at this stage it represents an opportunity to join the upwards trend.
When subminuette wave i is complete, then a brief correction for subminuette wave ii should unfold lower. It may not move beyond the start of subminuette wave i below 1,338.21.
ALTERNATE HOURLY ELLIOTT WAVE COUNT
Click chart to enlarge.
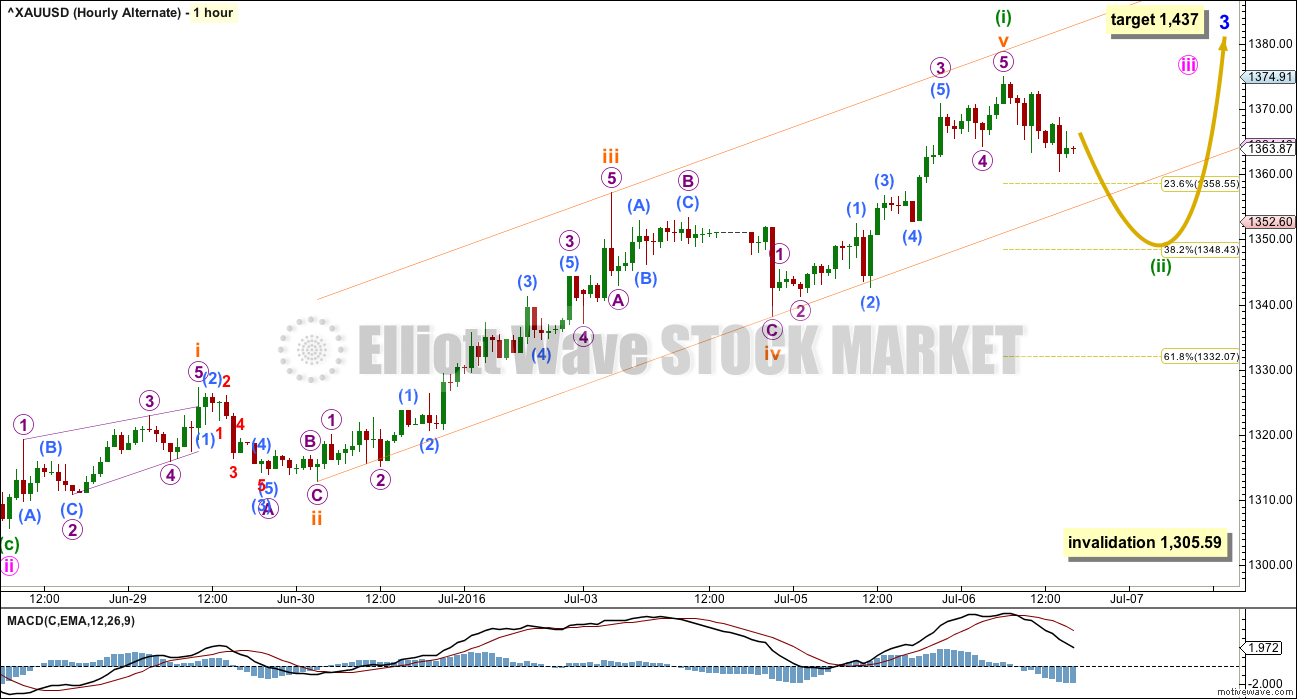
It is possible that only minuette wave (i) is complete within the impulse of minute wave iii. If this is correct, then it is possible that a red daily candlestick or doji may complete for the next session.
Minuette wave (ii) may end at either the 0.382 or 0.618 Fibonacci ratios of minuette wave (i) at 1,348 or 1,332. In this instance, the upper target at 1,348 would be favoured. At this point, in a strong third wave up, the corrections may be expected to be more brief and shallow than normal.
The channel here is drawn about minuette wave (i) using Elliott’s second technique. If price breaks below the cyan line on the main hourly wave count, then consider this alternate. At that stage, it would increase in probability. Look for price to find some support at the lower edge of the orange channel on this alternate wave count chart. Thereafter, it may break through that trend line.
Minuette wave (ii) may not move beyond the start of minuette wave (i) below 1,305.59.
TECHNICAL ANALYSIS
DAILY CHART
Click chart to enlarge.
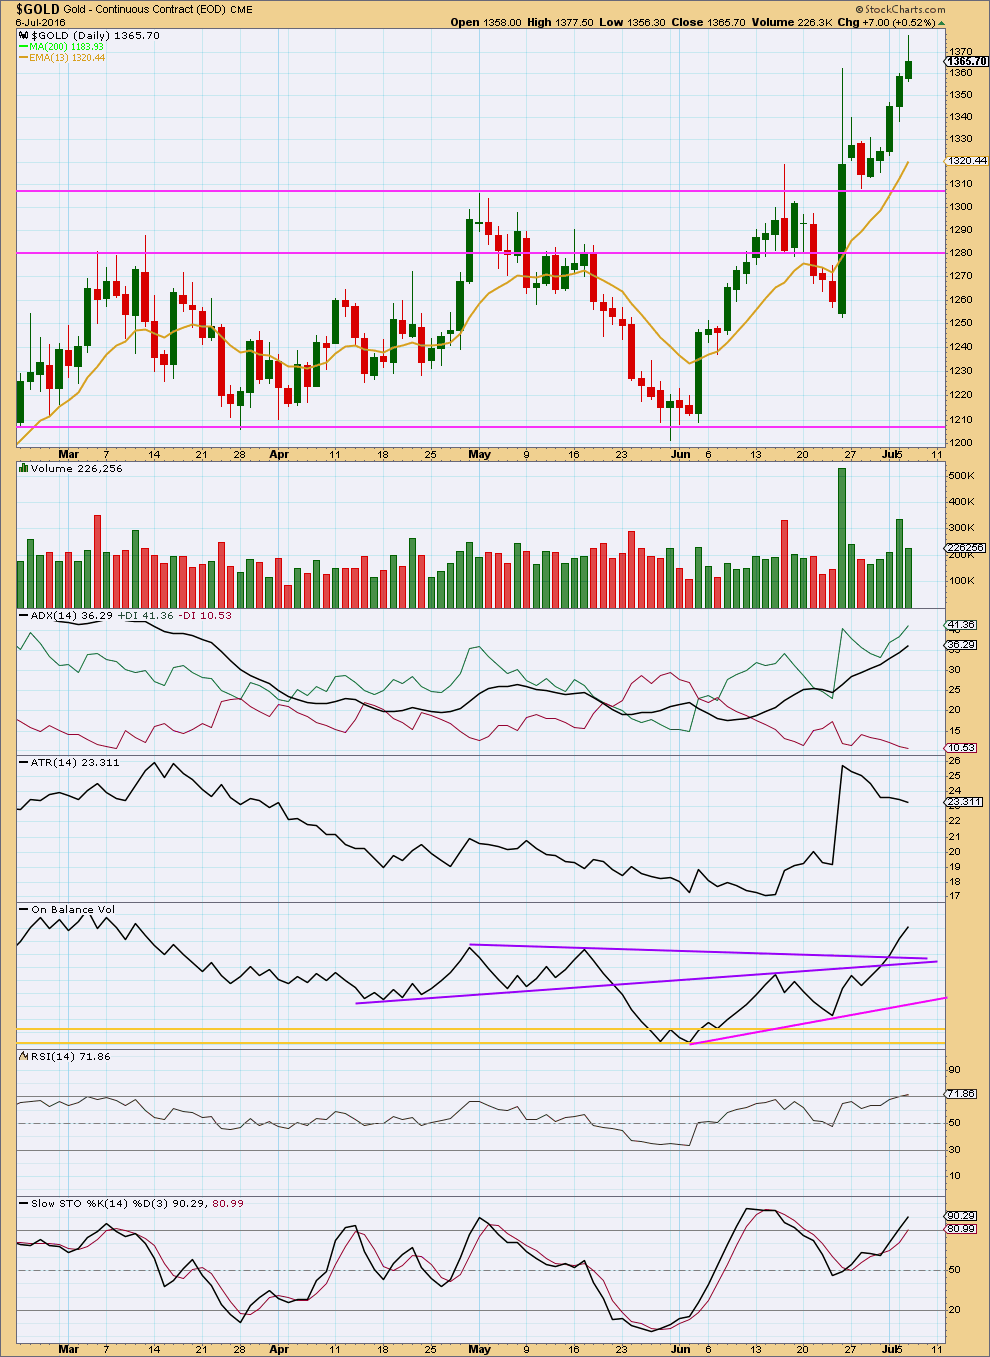
Volume for today’s session was lighter than yesterday, but overall volume is still increasing as price moves higher.
The long upper wick on today’s candlestick is bearish, but overall price is still moving higher.
ADX still indicates an upwards trend is in place. ADX is nearing extreme. The trend may continue yet for a while but signs of exhaustion should be watched for carefully.
ATR is declining, not agreeing with ADX. This may be due to the unusually large range for 24th of June being part of this average.
On Balance Volume is bullish with a break above the two purple lines. There are no upper lines to provide resistance at this stage to OBV. There is no divergence between price and OBV to indicate weakness to this upwards trend.
RSI is only just entering overbought. RSI may remain extreme for several days during a trending market. When it shows divergence, then it would be indicating weakness. There is no divergence today between price and RSI.
Stochastics is overbought, but this oscillator may remain extreme for reasonable periods of time during a trending market. Stochastics still shows some divergence with price between the last two swing highs of today and 24th of June. However, divergence between Stochastics and price is not always reliable. This should be read as a weak bearish signal only.
Overall, the technical analysis picture is still more bullish than bearish. Expect price to find support at the 13 day moving average if a deeper correction unfolds.
This analysis is published @ 07:19 p.m. EST.
Anyone seeing bull flags for the US dollar and a variety of pairs? I know there has been a decoupling but something to consider in the wake of tomorrow’s jobs figures.
Gold wasn’t down all that much today (.4% or so) but GDX was down by over 3% and NUGT was down by over 9%. Should gold fall to 1332, this would represent a further decrease of 2%. Do you think GDX/ NUGT will fall equivalently? Trying to get a gauge on a decent stop loss?
Updated alternate hourly… will be the main hourly wave count today.
So far it looks like minuette (ii) could be over.
But I’ll have an alternate too. If we move the degree of labelling down in this small zigzag it could be the first zigzag of a double to take price lower to 1,332, or it could be wave A of a flat correction, or wave W of a double combination.
Was 1.362.78 high at 1:16 pm the 3rd or 5th wave up from today’s low at 1040?
If 3rd then I’m looking to buy into bottom of the 4th wave.
With gold nearly touching $1,349 earlier this morning and being very close to the .382 fib ratio of $1,348, can gold continue to retrace back down to this level or lower to the .618 ratio of $1,332. It’s made a nice recovery but I can see that doji forming. If so, is this a normal behavior for gold… probabilities of this happening?
FRIDAY, JULY 8
8:30 am US Nonfarm payrolls
It is usually big news when comes to gold.
Stocks rise as investors key in on U.S. economy ahead of Friday’s jobs report –
July 7, 2016 9:51 a.m. ET
http://www.marketwatch.com/story/us-stock-futures-waver-as-focus-turns-from-brexit-to-jobs-report-2016-07-07
Gold slips from two-year high as U.S. jobs picture muddles Fed outlook
July 7, 2016 9:21 a.m. ET
http://www.marketwatch.com/story/gold-slips-from-two-year-high-as-us-jobs-picture-muddles-fed-outlook-2016-07-07
Alternate hourly count – Minuette wave (ii) may end at either the 0.382 or 0.618 Fibonacci ratios of minuette wave (i) at 1,348 or 1,332. In this instance, the upper target at 1,348 would be favoured.
Amazing how often those Alternate charts come into play! Personally, I’m still a little numb from the Brexit vote and the action that had on gold. Here’s to hoping tomorrow’s very important jobs report is neutral to poor. Expectations are that because May’s figures were incredibly poor, June’s figures should be much improved; Risk on mode for S&P, 10 year treasuries to climb, and unfortunately, a hit to gold. Should gold fall to the 0.618 fib ratio/ $1,332, can anyone share the approximate price for GDX. Thanks all and what terrific information shared! So powerful to “know”.
Avi on the power of 3rd waves
To follow up on Ursula’s comment below and a couple of other members who pointed this out… I’ve finally updated the Grand Super Cycle analysis. Now it should make more sense.
Thanks for updating Grand super cycle wave analysis.
Ursula: (If your neck still hurts I can highly recommend physiotherapy
I second this recommondation. My daughter had neck injury from car accident and saw physiotherapyst. pain went away within short time of special excersizes.
Thanks Papudi. I have a local Osteopath, and whatever she does works wonders. I feel much better immediately, and then daily better and better.
That and surfing actually, soothes my soul and gets my Zen back on….. now if the wind would only switch to offshore…
For those worried about being long gold or miners, here’s another look at a large H&S pattern for gold. Chart by FullGoldCrown. As you can see, this pattern took over a year and a half to form and therefore generated sufficient energy for this big move up in Gold.
Sometimes a H&S pattern will “back test” the neckline, but other times, any back test is very weak. I don’t expect much of a back test for this one. Also, note that his “PO” (price objective) is conservative. There is another target about 1,567 based on the “Head”. This target aligns better with Lara’s target for Intermediate 4 @ 1,582.
I think when TA targets align with EW targets, it increases the probability of those targets being met. Now is the time to be bullish gold and miners, just expect some corrections along the way. Good trading to all.
Hi Lara, as I am not an expert in Elliot wave some questions:
Looking at the long term count this move up would be the last one before a majour correction?
(If your neck still hurts I can highly recommend physiotherapy, I am one but a bit too far away from you 🙂
Thank you very much for clarifying
Ursula
I’m not sure what your definition of “major” is, but these are what I see for upcoming corrections based on Lara’s count. For me, Intermediate wave 4 will be the first big correction.
Upcoming corrections:
Minute 4 – Likely shallow and only 2-5 days in length
Minor 4 (target to start 1,437)- Likely shallow and only 5-8 days in length
Intermediate 4 – (target to start 1,582) Could be a deeper correction as Int 2 was shallow. Likely to last more than 55 days
Then at the end of Intermediate 5 (& Cycle wave a), a multi-month correction would start for Cycle wave b.
Hope this helps.
Hi Dreamer,
thank you very much for this. On Lara’s Supercycele it looks like big swings:
http://elliottwavegold.com/2015/05/gold-elliott-wave-technical-analysis-grand-supercycle-8th-may-2015/
Yes, I see the confusion. That chart is over a year old, and the structure has changed since then. You are better off referring to Lara’s updated Weekly chart. I added my own notations to it that align with the targets I provided above. As you can see, we are likely several months away from a large multi-month cycle wave b correction, although the Intermediate wave 4 correction will likely be more than 55 days. Hope this helps.
Wonderful thank you very much, that makes it much clearer. Great chart and explanation 🙂
Seconded. Thank you Dreamer for your assistance!
If I am understanding right we are on the way to b towards >1500, then down to (a) around 750-800 then up to (b) towards 1700. So the multi month correction would be down to (a) ?
or are we not there yet?…
thanks for all help in understanding
Ursula
OK, I think you are still looking at the out of date Grand Supercycle chart. Please refer only to the weekly chart. When Lara determined that the move down over the last 4 years was a double zigzag (w-x-y), that changed things.
The bottom became super cycle (a) olive color. Now we are on our way up to super cycle wave (b) olive color. On the way up, we need to have a 3 wave structure at cycle degree, a-b-c, teal green. We have not yet reached cycle wave a, teal green. We will get there likely late this year at a target to be determined, likely 1,600+.
That’s when the multi month correction for cycle wave b, teal green will start. The expected drop would maybe be 300 points, but it will not make a new low. Then we have a multi-month move up again to complete cycle wave c, teal green, and super cycle wave (b), olive. This move up may even make new all time highs in the case of an expanded flat.
Then, if all this plays out, likely over a year from now, the big drop starts towards grand super cycle wave IV, which will likely take another 4+ years. Hopefully this helps and is not more confusing.
The Best Neck Treatment – I would only have someone who uses the McKenzie Method ever touch my neck or back. I wouldn’t trust anyone else as most may cause harm even chiropractors as mostly want repeat business, meaning forever.
Robin McKenzie is the famous chiropractor Knighted by The Queen of England and his method gets results and not just repeat business.
His method also teaches you how to treat your own neck or back.
https://www.amazon.com/s/ref=dp_byline_sr_book_1?ie=UTF8&text=Robin+A.+McKenzie&search-alias=books&field-author=Robin+A.+McKenzie&sort=relevancerank
Robin McKenzie is a world-renowned physical therapist who has spent the last 40 years perfecting the McKenzie Method. He was named Officer of the Most Excellent Order of the British Empire by Queen Elizabeth II in 1990. In January 2000, the Queen named him to an even higher order, a
Companion of the “NEW ZEALAND” Order of Merit.
McKnenzie just one of many techniques,… I have been a physio since 22 years with many postgraduate and Master degrees,… a good manual therapy trained physiotherapist will know what to do.
Kind regards
Ursula Knecht
MPhty (Sports), BPhty, DPhty, Sports Phty (IAS), Man Ther (Sohier)
GDX is approaching two large gaps on the daily chart from 2013 that have not been filled. Prior volume for these gaps dates all the way back to 2009. These gaps should easily fill as we move toward Lara’s GDX Intermediate 3 target of 36.21, although a quick correction for Minute 4 and then a little bigger one for Minor 4 is expected along the way. Big gains ahead!
Dreamer I really appreciate your charts, thanks.
You’re welcome. Glad you find them useful.
Forget gold, silver is on fire and could hit $25/oz. by the end of 2016
July 6, 2016 4:27 p.m. ET
http://www.marketwatch.com/story/forget-gold-silver-is-on-fire-and-could-hit-25oz-by-the-end-of-2016-2016-07-06?mod=MW_story_top_stories
Silver has seen double the percentage gain of gold since Brexit
GDX inverted H&S has moved higher as expected once the neckline breach was confirmed.
Thanks, Dreamer. Thanks for taking time to explain EW in more detailed to inexperienced EW technician like me. I love the facts that you used traditional TA facts to support the EW analysis. I’ve been using classic TA for trading and investing for a long time. 🙂
You’re welcome. I’m a visual person, so charts always help me.