
Again, upwards movement was expected.
Summary: The trend is up. The target remains at 1,582. Further and substantial confidence may now be had in the trend and targets if price can move above 1,366.87. A new low below 1,310.84 would invalidate the main wave count and confirm a new alternate. At that stage, a target for downwards movement to end would be 1,279.
New updates to this analysis are in bold.
Last weekly charts, and a more bearish weekly alternate, are here.
Grand SuperCycle analysis is here.
DAILY ELLIOTT WAVE COUNT
Click chart to enlarge.
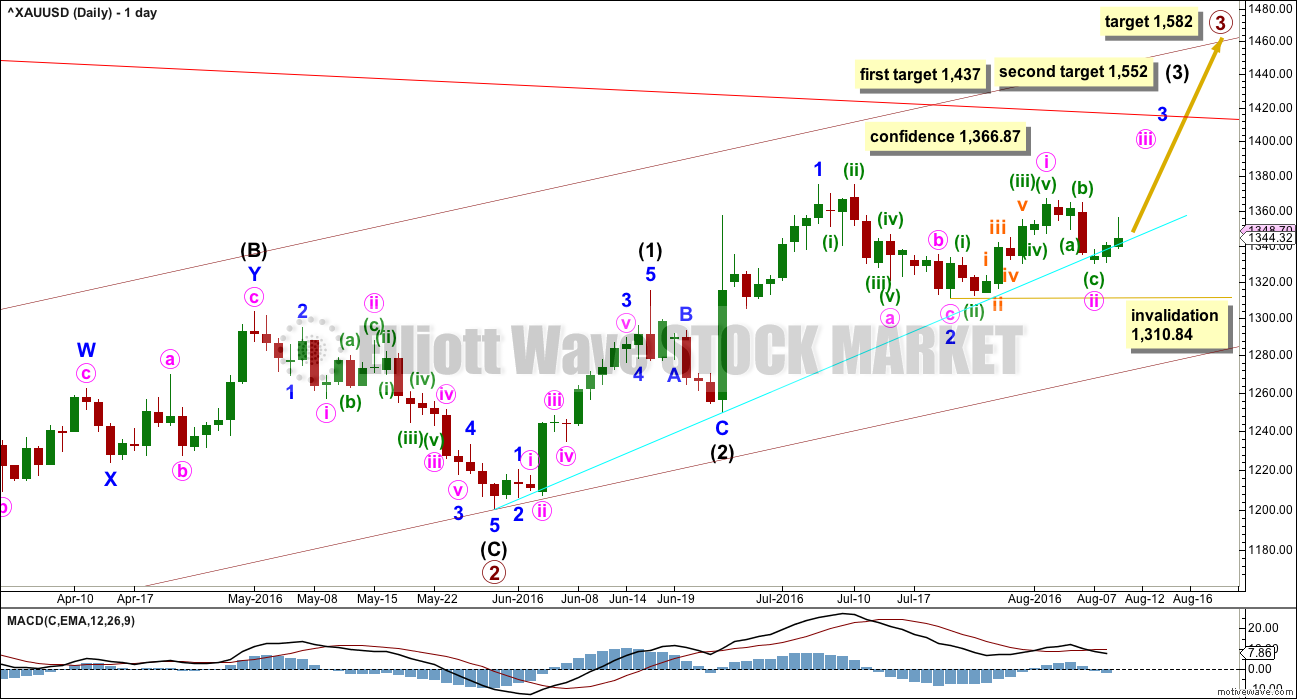
Primary wave 2 is a complete expanded flat correction. Price from the low labelled primary wave 2 has now moved too far upwards to be reasonably considered a continuation of primary wave 2. Primary wave 3 is very likely to have begun and would reach 1.618 the length of primary wave 1 at 1,582.
Primary wave 3 may only subdivide as an impulse.
So far intermediate waves (1) and (2) may be complete within primary wave 3. The middle of primary wave 3 may have begun and may also only subdivide as an impulse.
Within intermediate wave (3), the end of minor wave 1 is moved up to the last high. This fits on the hourly chart although it looks odd here on the daily chart. There was a small fourth wave correction up at the end of minor wave 1 and it subdivides on the hourly chart as an impulse. Minor wave 2 may be a complete zigzag, also subdividing as a zigzag on the hourly chart. If minor wave 2 is over, it would be 0.50 the depth of minor wave 1.
No second wave correction may move beyond the start of its first wave below 1,310.84 within minor wave 3.
At 1,437 intermediate wave (3) would reach 1.618 the length of intermediate wave (1). If price keeps going upwards through this first target, or if it gets there and the structure is incomplete, then the next target would be at 1,552 where intermediate wave (3) would reach 2.618 the length of intermediate wave (1).
The support line in cyan is adjusted today. Draw it from the start of intermediate wave (1) to the end of intermediate wave (2). Downwards corrections may bounce upwards from about this support line.
There may now be four overlapping first and second waves complete: primary, intermediate, minor and now minute. This wave count expects to see an increase in upwards momentum beginning this week.
A new high above 1,366.87 would invalidate the new alternate wave count below and provide price confirmation of this main wave count.
Primary wave 1 lasted 14 weeks and primary wave 2 lasted 12 weeks. Primary wave 3 should be longer in both price and time as it should be extended. It may be about a Fibonacci 34 weeks. So far it has lasted ten.
HOURLY ELLIOTT WAVE COUNT
Click chart to enlarge.
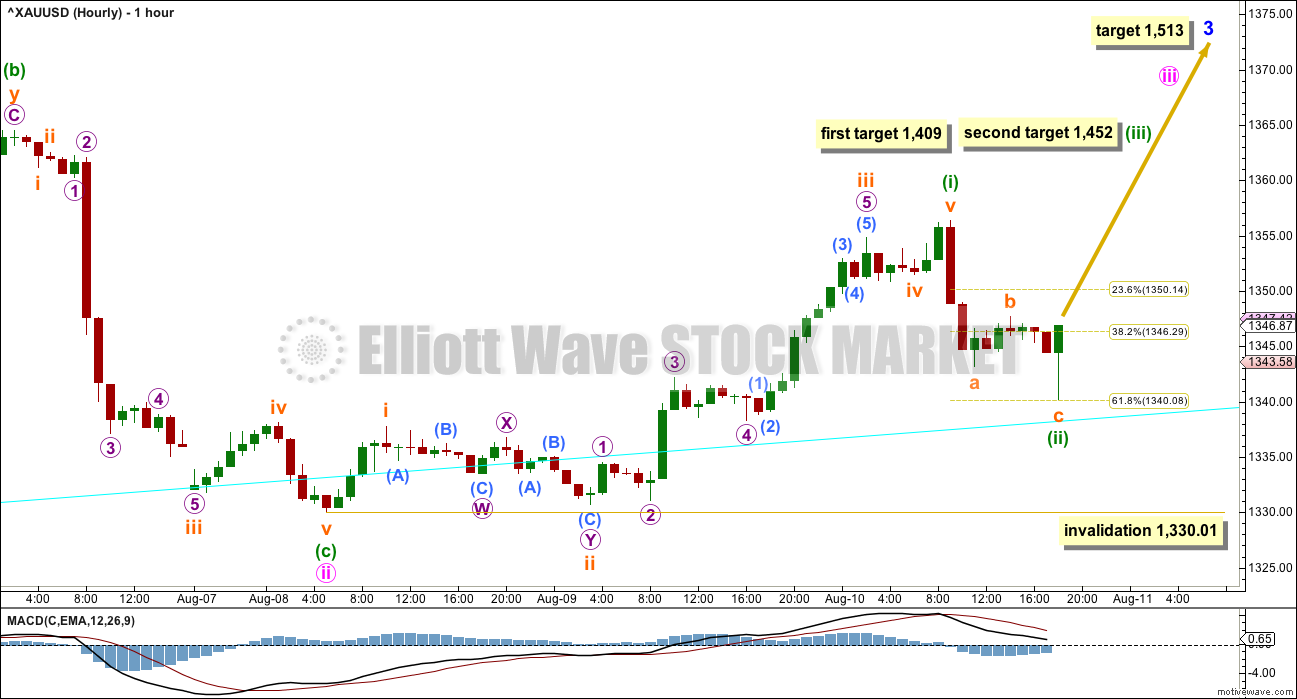
It looks like price is finding support about the cyan support line, not perfectly but close to it.
Minuette wave (i) looks like a complete five wave impulse. This part of the wave count has an excellent fit. Typical of all commodities, within minuette wave (i), the third wave exhibits a fifth wave extension for micro wave 5 of subminuette wave iii.
Ratios within minuette wave (i) are: there is no Fibonacci ratio between subminuette waves iii and i, and subminuette wave v is just 0.06 longer than 0.618 the length of subminuette wave i.
Ratios within subminuette wave iii are: micro wave 3 has no Fibonacci ratio to micro wave 1, and micro wave 5 extension is just 0.32 longer than 4.236 the length of micro wave 1.
Within minuette wave (ii), subminuette wave c is 0.67 short of 0.618 the length of subminuette wave a. The correction so far looks strongly like a three wave movement and it has ended almost right on the 0.618 Fibonacci ratio. It looks very likely to be over there.
A target may now be calculated for the middle of the third wave up. At 1,409 minuette wave (iii) would reach 2.618 the length of minuette wave (i). If price gets to this first target, or when it gets there the structure is incomplete, then the second target would be used. At 1,452 minuette wave (iii) would reach 4.236 the length of minuette wave (i). For the middle of a big extended third wave, this Fibonacci ratio is an entirely reasonable target calculation.
The mid term target for minor wave 3 remains the same. At 1,513 minor wave 3 would reach 1.618 the length of minor wave 1.
THIRD WAVE EXAMPLE – DAILY CHART
Click chart to enlarge.
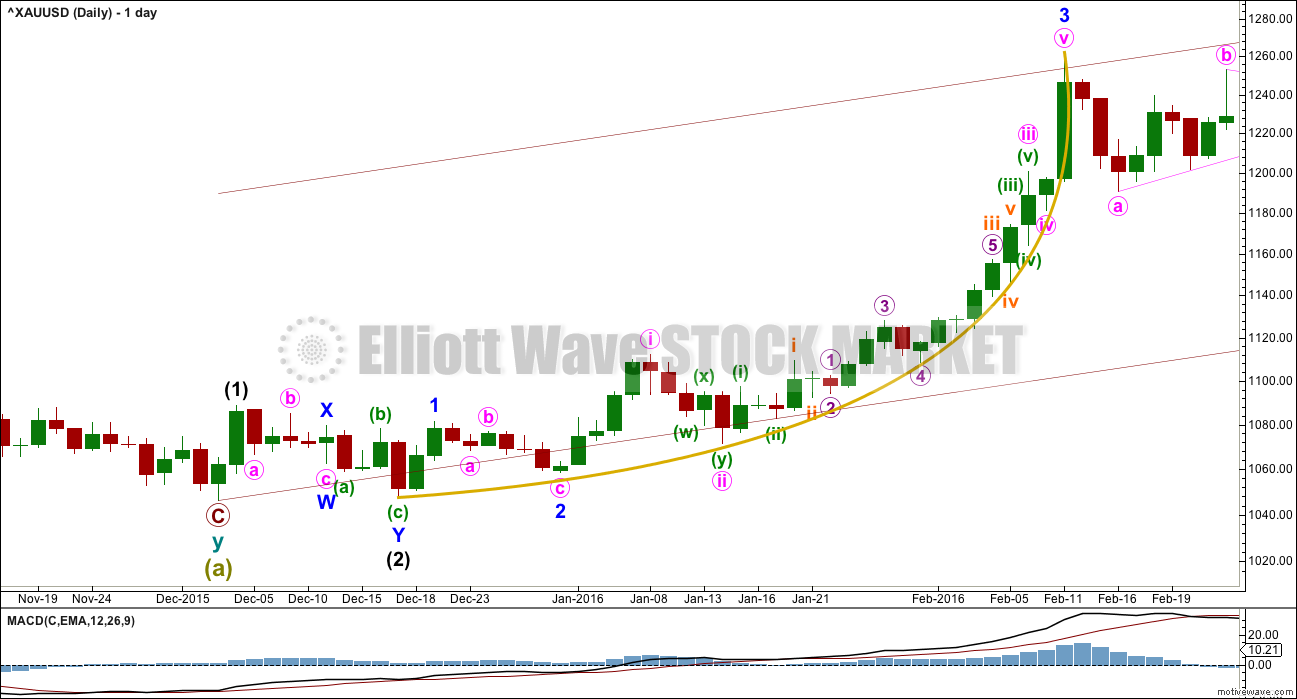
In discussing the curved look to Gold’s impulses, particularly for its third waves, here is an example.
Within primary wave 1, the third wave of minor wave 3 had a strong curved look to it. The impulse begins more slowly and has deep and relatively time consuming second wave corrections: Minor wave 2 was 0.68 of minor wave 1, minute wave ii was 0.76 of minute wave i, minuette wave (ii) was 0.56 of minuette wave (i), and subminuette wave ii was 0.64 of subminuette wave i.
The curved look comes from the disproportion between second and fourth wave corrections within the impulse. Here, minute wave ii lasted 4 days and shows clearly on the daily chart yet minute wave iv was over within one day and does not show up with any red candlesticks or doji on the daily chart.
Momentum builds towards the middle of the impulse, continuing to build further during the fifth wave and ending in a blowoff top. This is typical of Gold and all commodities.
This tendency to blowoff tops and curved impulses is particularly prevalent for Gold’s third waves.
ALTERNATE DAILY ELLIOTT WAVE COUNT
Click chart to enlarge.
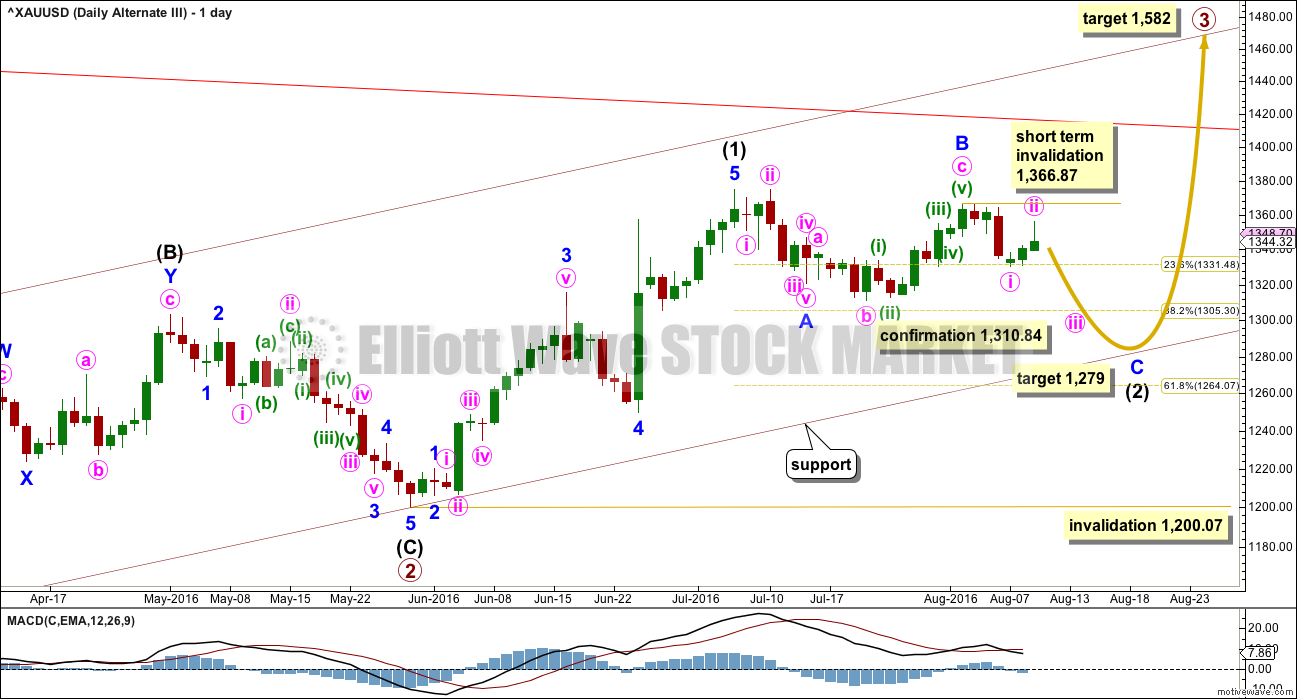
This new alternate is less bearish than yesterday’s alternate.
This wave count is identical to the main wave count up to the end of primary wave 2. Thereafter, what if only intermediate wave (1) ended at the last high?
This movement will fit as a five wave impulse, although it does not have a very good look on the daily chart. This reduces the probability of this wave count.
If intermediate wave (1) was over at the last high, then it may have lasted 27 days. So far intermediate wave (2) may have taken 25 days and would still be incomplete. The proportions of this part of the wave count look slightly better than the main wave count.
There is a problem now with structure on the hourly chart within minor wave C. Minute wave i would have to be complete. It will fit on the hourly chart, but it does not have a good look as a five and looks better as a three on the hourly and daily chart levels. This slightly reduces the probability of this wave count.
Within minor wave C, minute wave ii may not move beyond the start of minute wave i above 1,366.87.
At 1,279 minor wave C would reach 1.618 the length of minor wave A. Price may end downwards movement when it finds support at the lower edge of the maroon base channel drawn about primary waves 1 and 2.
Intermediate wave (2) may not move beyond the start of intermediate wave (1) below 1,200.07.
TECHNICAL ANALYSIS
WEEKLY CHART
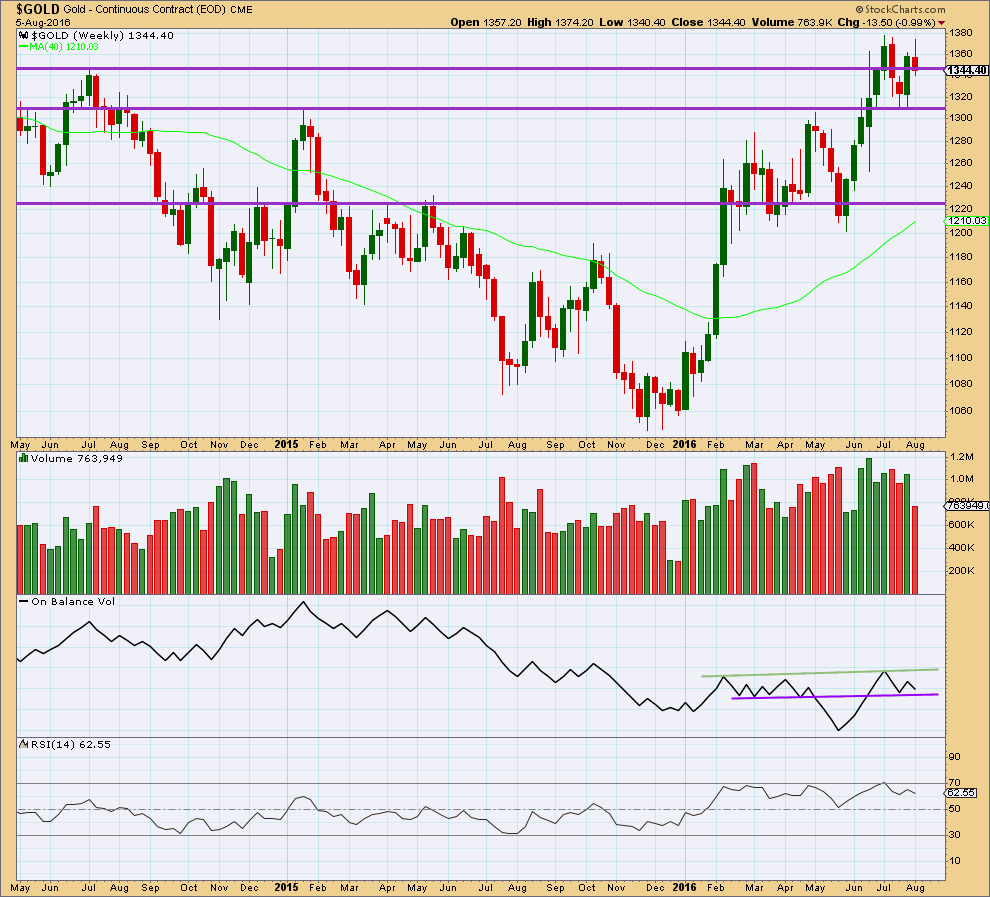
Click chart to enlarge.
The week before last completed a bullish engulfing candlestick pattern supported by stronger volume than the prior downwards week. Last week made a new high, then completed a red candlestick on lighter volume. Overall, the fall in price last week is not supported by volume at the weekly chart level. Last week looks to more likely be a corrective movement than a new trend.
On Balance Volume is still relatively bullish above the purple trend line, which is redrawn at the end of last week. A break below the purple line would be bearish. A break above the green line would be bullish.
RSI is not extreme. There is room for price to rise or fall.
DAILY CHART
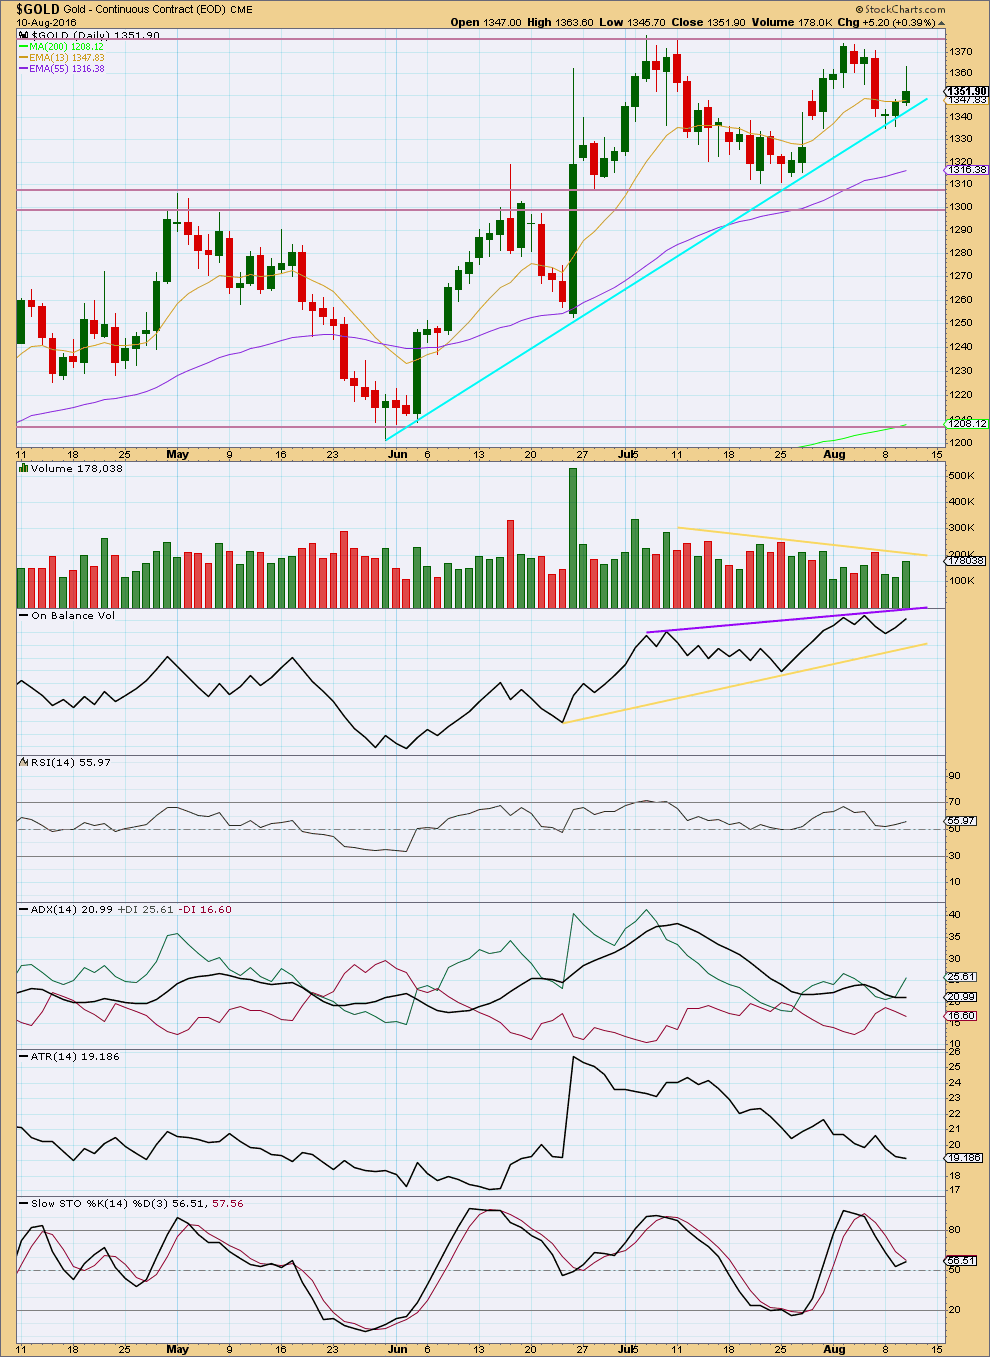
Click chart to enlarge.
From the last high on 2nd of August, volume increased as price fell. The fall in price was supported by volume.
Now price is rising on increased volume. Volume for Wednesday’s session shows a reasonable increase, so there is support for this rise in price. The volume profile now has some bullishness to it, ameliorating some concerns in yesterday’s analysis over bearish volume.
It looks like price is range bound between resistance about 1,375 and support about 1,305. ADX has been mostly declining since 12th of July and price has overall moved sideways within this range. ATR has also been declining during this period, This supports ADX in expecting the market is consolidating. Volume is declining as price moves sideways.
It is the upwards day of 8th of July, during this big consolidation, that has strongest volume suggesting an upwards breakout is more likely than downwards.
It should be expected during a consolidation that price will swing from support to resistance and back again. Stochastics may be used to indicate when one swing ends and the next begins. At this stage, Stochastics is returning from overbought and is now about neutral. A downwards swing may be expected to continue until Stochastics reaches oversold and price reaches support about 1,305 at the same time.
Price swings during a consolidation do not move in straight lines, and support or resistance may be overshot yet price returns back to within the consolidation. This is one reason why consolidations are so difficult to trade. The final expected swing never eventuates, as finally price breaks out of the consolidation. This is another reason why consolidating markets are difficult and more risky to trade than trending markets.
ADX today shows a very slight increase. An upwards trend may be returning. This needs to be a little clearer for confidence. ATR is still declining, indicating a consolidating market.
RSI is close to neutral. There is room for price to rise or fall.
Trend lines on On Balance Volume are redrawn. A break above the purple line would be a bullish signal. A break below the yellow line would be a bearish signal.
This analysis is published @ 07:07 p.m. EST.
There is some serious option activity in the GDX arena. A trader today bought 10K March 35 calls at 3.05 per contract. These calls are out of the money so that is over 3 million in pure option premium. This trader is betting on a roughly 23% pop in GDX over the next seven months. Very bullish indeed. The pay-off is a cool million for every dollar that GDX rises above 38.05. Interestingly enough, the last time GDX traded above 38 was in March of 2013….
Mind blowing bet. I hope he wins.
I think this may be happening this morning. I will need to recalculate targets for minuette (iii).
When the channel about minuette (ii) is breached that would add confidence to the view that it’s over.
The proportions between minuette (i) and (ii) still look good; minuette (i) lasted 52 hours, so far minuette (ii) has lasted 30 hours.
What does still look reasonably clear is the upwards wave of minuette (i) looks like a five wave impulse, and the downwards move of minuette (ii) so far looks strongly like a three.
If this hour can close with a lower wick and lighter volume then I’d place bets that it’s over. If volume rises and the candle doesn’t have a long lower wick then more downwards movement before it’s done.
Whew. My jinx of the second waves being a combination instead of a simple zigzag recurred.
Minuette 2 is a combination 1357.37 – 1340.17 – 1353.42 – ?
The drop should be over now at 1335.84.
The target was:
1335.82 at 0.786 Fib retrace of Minuette 1
1336.22 where subminuette c = subminuette a
Thanks Alan for the count.
A nice reaction so far off the 78.6% fib
There’s still a nagging doubt in my mind.
The low of 1335.84 could still only be micro 3 of subminuette c/y.
After the rise (targeting 1340), there will still be one more drop targeting 1333 – 1335. Hope I’m wrong.
Any wave counts after this sudden drop to 1335.84 at 3:18 pm?
Gold was only this low at 9:00 am tuesday
Gold just dropped hard and fast $5 to 1336.43 at 3:15.
Could that be the bottom of minuette (ii)?
Afternoon low 1340.67 at 3:01 pm
Morning low 1340.17 at 1:21 am low minuette (ii).
NUGT dropping more from 2:30 down to now 169.02 still above market low of 168.31 at 9:36 am
Perhaps we are still in Minuette (ii), now in Subminuette {orange} ‘c’ of Minuette {green] (ii). At this point, it would make sense that this is now a retracement of Minuette (i); OR Lara’s ALT takes place.
Was just thinking the same thing…
Another significant data release tomorrow morning at 8:30; PPI and Retail Sales.
Macy’s and Kohl’s both reported better than expected numbers giving rise to the thought that overall, retail sales figures could surprise tomorrow. Auto sales were strong in July but energy was soft so it will come down to the consumer figures.
I really think that this was the reason for gold selling off since 11:00 today; US Dollar gained traction as well.
Should the numbers from the data be favorable, we’ll be right back to September rate hike discussions and gold will pull back.
Even if the Fed doesn’t pull the trigger in September, it’s the possibility that they can and the significant difference between what the market is expecting.
Looking forward to Lara’s interpretation of this afternoon’s wave count.
Technicals look weak for third wave up. Would be concerned correction is continuing. Although miners made a new high gold’s high was less than yesterday and now things are rolling over.
Subminuette i peaked at 11:02AM and likely bottom for Subminuette ii at 12:27 PM or slightly lower yet?
12:27 low could also be Micro A of subminuette ii. If so, a Micro B up and a Micro C to follow down?
Sorry but minuette (ii) ended at 1:21 am at 1340.17 and this intraday correction is still dropping and not sure how close it may get to 1340?
Wouldn’t be surprised if we see another deep retracement (61.8% or more).
This correction may have ended at 12:15 low?
Any wave counts or comments?
High at 11:02 ET- subminuette 1?
Yes and in a sizable 5-3-5 intraday correction since then 1353.42 at 11:02 am high.
How low might this correction drop today?
May have just ended?
Is the ending target for minuette 1 still 1368 – 1369? If so, what do you think is expected in minuette 2. Entry to add?
Don’t have a number however any good low today. As close to 1,340.17 as it goes.
Just to be clear, I believe Lara’s count has minuette 1 and 2 complete, and now we are in minuette 3, no?
Yes now in minuette (iii) as minuette (ii) ended at Tuesday low.
So… it looks like the spike appeared on COMEX data then disappeared.
Johno has a plausible explanation below.
Unfortunately at the time these things happen you can never be sure what it is… in my case it will disappear about 10 minutes after the analysis is published. Worse luck.
Anyway, price moved lower to about the same point… slowly. Now looks like it may be turning up. Draw a channel about the downwards zigzag, it’s now been breached convincingly by upwards movement. It looks still like the low is in place… most likely.
I’m off to sleep now to dream of waves…. and hopefully to awake tomorrow to nice profits.
No waves in the ocean for me for a few days 🙁 An onshore mess it is. Silver analysis coming up tomorrow.
Likely the low for subminuette ii at 1:21 AM Or re-test a bit lower?
Low for Minuette (ii) instead
I’m also not seeing the spike down to 1340, but it showed the current spike downed to 1343.3 at 1:20am E.T. on my platform.
Different platforms may have different gold feeds and prices.
TOS Think or Swim was always higher than pmbull.com so I just used pmbull.com if I needed a more exact gold price.
http://www.pmbull.com at all time frames shows 1,340.17 and at 1 minute time frame shows it at 1:21 am.
Lara. Your 6:16 pm comment tonight on yesterday’s analysis is hilarious in a good way. It gave me lots of laughs thanks for sharing. I’ve been laughing a lot every time I think of it even an hour later.
“next thing I know price spikes down to 1,340, I have to redo the chart….”
LOL
Sometimes analysing this market when it’s moving… is kinda like trying to play whack-a-mole with a hydra….
Not easy.
Not easy at all.
There is another plausible explanation for the spike down to 1340ish.
Lara is clearly clairvoyant; she foresaw the drop a few hours before it actually happened.
IF that was true…she would be so rich as to not have to mess with this motley crew…..lol
I think laras desktop showing her the future..Lolzzzz
LOL! Or she is one of the ‘bad guys’ in which case we’ll all be rich!
Yes Alan. That’s it.
I’ve let my secret slip… I have a magic update for MotiveWave that shows me the future…..
…I wish.
Lara, see whether they have a crystal ball function.
I did ask. Sadly the answer is no.
I know a new low below $1310.84 will confirm alt, but a new low below $1330 will be a strong early indication the alt is in play. Anyone who follows Ira epsteins swing line study will understand a new low below $1330 will return gold to ‘no trend’ from an uptrend.
Great analysis lara..
But why im unable to see that last down spike candle on hourly chart anywhere on any streaming platform ??
Yaa im sure i may be not seeing proprly.
Thank you
I’m not seeing it anywhere either.
Not visible on mine either.
FWIW I have read from a reasonably credible source, that spikes such as this, that are visible only on some platforms, are the result of a single trade that takes place at the outlying price. It happens with the S&P as well. Very often, price then follows up to or down to the spike level. It’s a signal by the ‘bad guys’ to their friends. Expect a price move to the end of the spike and then reversal.
Take it with a pinch of salt. We shall see.
Interesting. Wonder if we might see this play out with a C wave down. Out of curiosity, who would these “bad guys” be, and what makes them sinister?
In this case, presumably the bullion banks. I don’t believe the gold price is managed day to day but there is plenty of evidence of interventions at key points. If you know nothing about it, then google gold price manipulation or go to gata.org
Looks like c wave in progress now. Let’s see if it finds support near $1340 this time.
James, you were looking for the missing hour of gold info.
pmbull.com everyday has a 1 hour gap in gold price feed from 5:00 to 6:00 pm.
That 1 hour gap is 5 days a week forever.