
A correction was expected to end about 1,339 before upwards movement resumed.
The correction ended at 1,340.1. Thereafter, upwards movement continues as expected.
Summary: The target for the main wave count remains at 1,582. Substantial confidence in the main wave count may now be had if price can move above 1,366.87. A new low below 1,310.84 would invalidate the main wave count and confirm an alternate. Prior to that, a new low below 1,334.06 would shift probability from the main to the alternate wave count. A target for downwards movement to end would be 1,279.
New updates to this analysis are in bold.
Last weekly charts, and a more bearish weekly alternate, are here.
Grand SuperCycle analysis is here.
DAILY ELLIOTT WAVE COUNT
Click chart to enlarge.
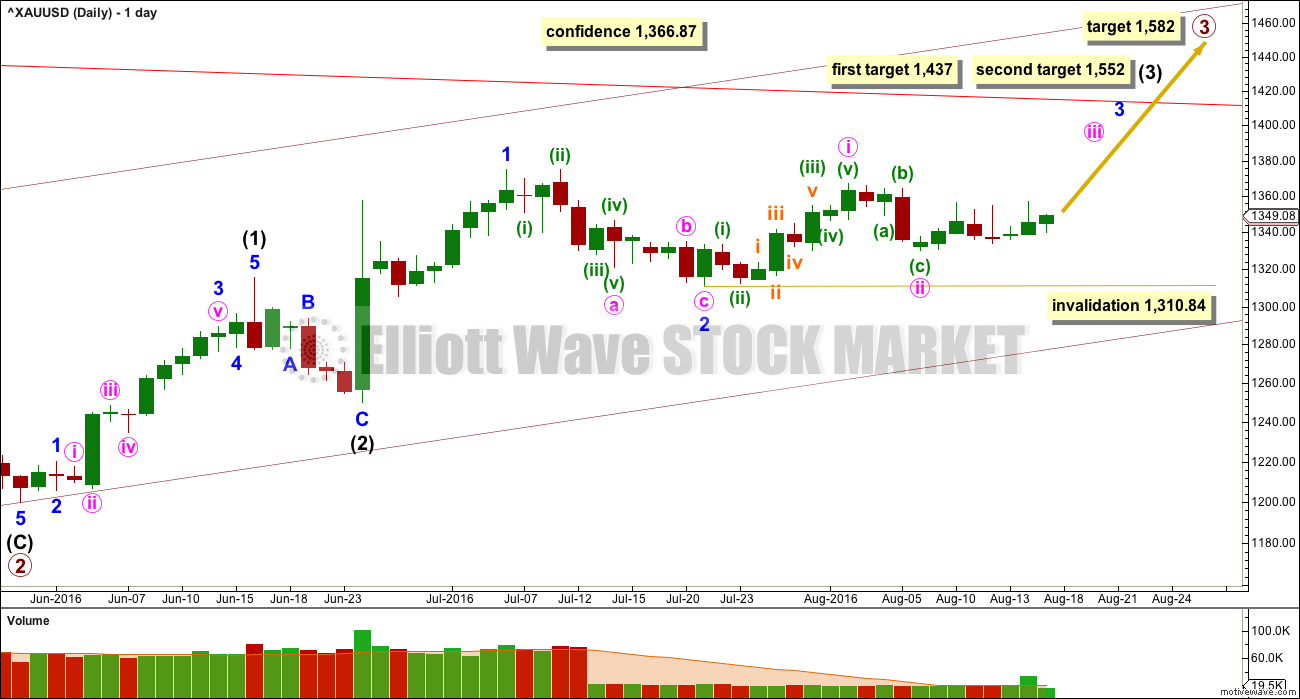
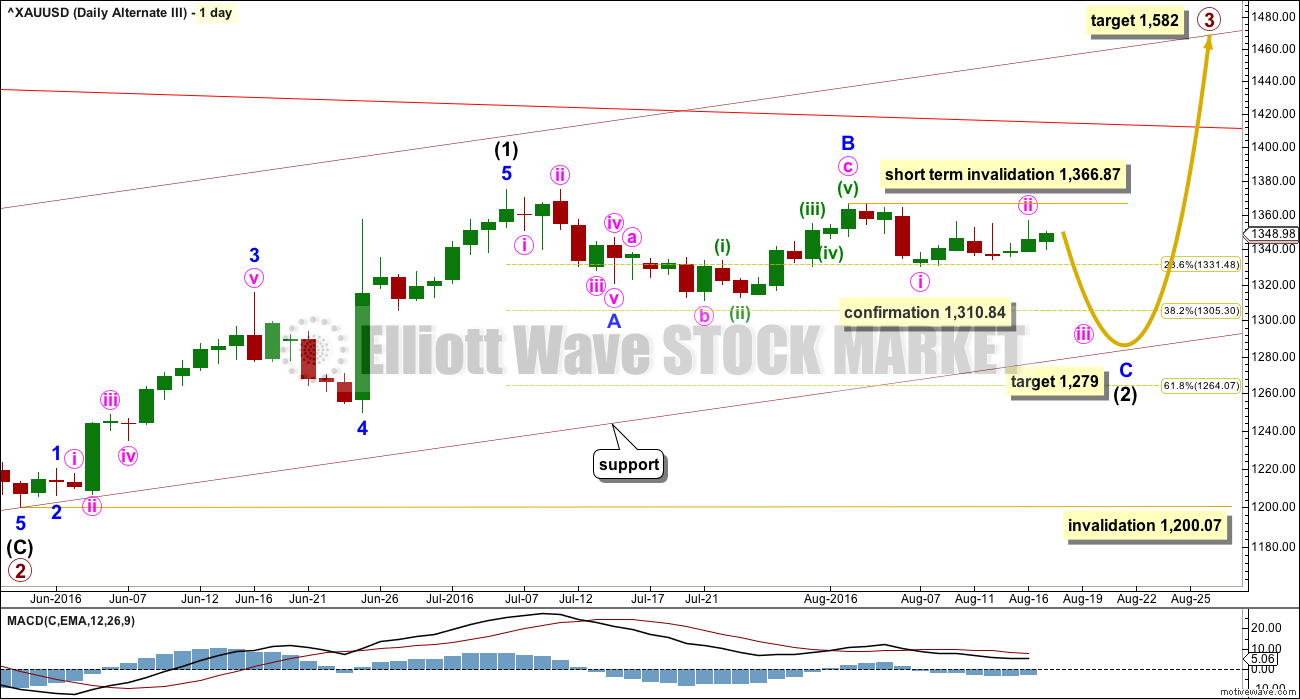
Primary wave 2 is a complete expanded flat correction. Price from the low labelled primary wave 2 has now moved too far upwards to be reasonably considered a continuation of primary wave 2. Primary wave 3 is very likely to have begun and would reach 1.618 the length of primary wave 1 at 1,582.
Primary wave 3 may only subdivide as an impulse.
So far intermediate waves (1) and (2) may be complete within primary wave 3. The middle of primary wave 3 may have begun and may also only subdivide as an impulse.
Within intermediate wave (3), the end of minor wave 1 is moved up to the last high. This fits on the hourly chart although it looks odd here on the daily chart. There was a small fourth wave correction up at the end of minor wave 1 and it subdivides on the hourly chart as an impulse. Minor wave 2 may be a complete zigzag, also subdividing as a zigzag on the hourly chart. If minor wave 2 is over, it would be 0.50 the depth of minor wave 1.
With overall sideways movement now for the last seven days, it looks entirely possible that minute wave ii may not be over. Sideways movement may be a corrective structure for an X wave to join two zigzags in a double. Minute wave ii may yet move a little lower to complete as a double zigzag.
Minute wave ii may not move beyond the start of minute wave i below 1,310.84. This is the final risk to any long positions entered here or which members may still be holding.
At 1,437 intermediate wave (3) would reach 1.618 the length of intermediate wave (1). If price keeps going upwards through this first target, or if it gets there and the structure is incomplete, then the next target would be at 1,552 where intermediate wave (3) would reach 2.618 the length of intermediate wave (1).
There may now be four overlapping first and second waves complete: primary, intermediate, minor and now minute. This wave count expects to see an increase in upwards momentum. On the hourly chart, there are now two more first and second waves complete: minuette and subminuette. The increase in upwards momentum should be imminent.
A new high above 1,366.87 would invalidate the alternate wave count below and provide price confirmation of this main wave count.
Primary wave 1 lasted 14 weeks and primary wave 2 lasted 12 weeks. Primary wave 3 should be longer in both price and time as it should be extended. It may be about a Fibonacci 34 weeks. So far it has lasted ten.
FIRST HOURLY ELLIOTT WAVE COUNT
Click chart to enlarge.
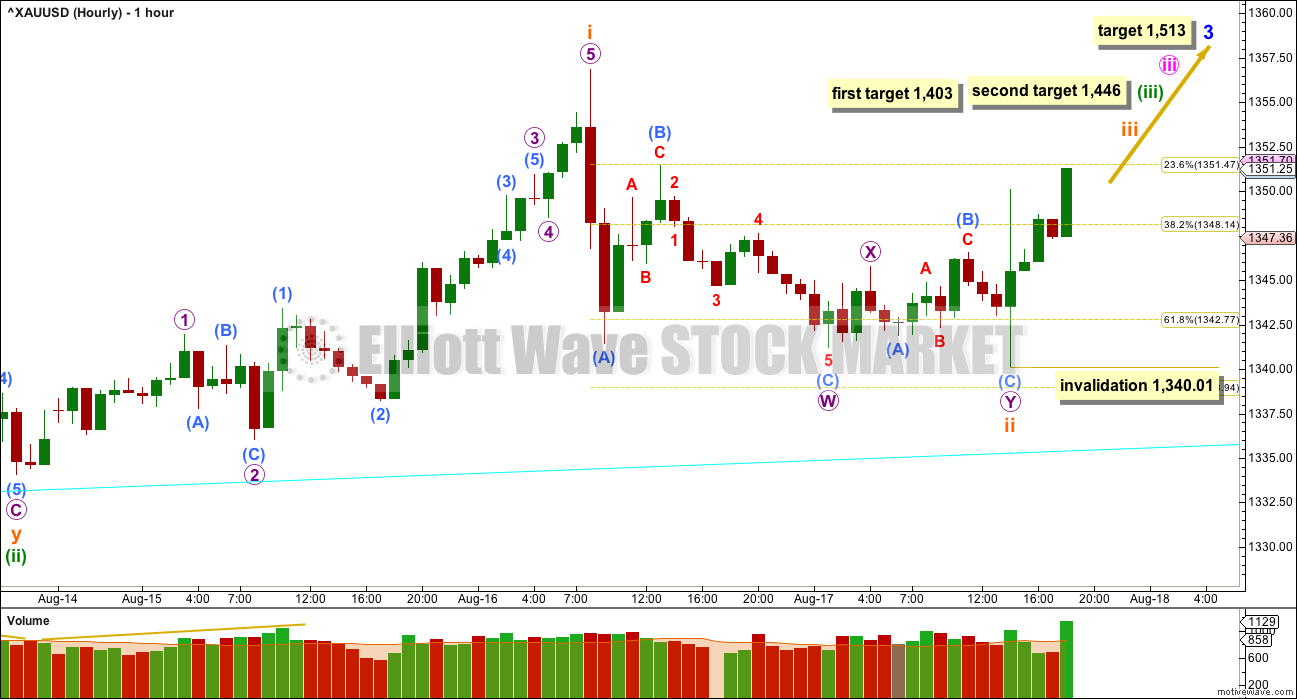
At 1,403 minuette wave (iii) would reach 2.618 the length of minuette wave (i). If price keeps rising through this first target, or if when it gets there the structure is incomplete, the second target would be used. At 1,446 minuette wave (iii) would reach 4.236 the length of minuette wave (i).
The target for minor wave 3 remains the same. At 1,513 minor wave 3 would reach 1.618 the length of minor wave 1.
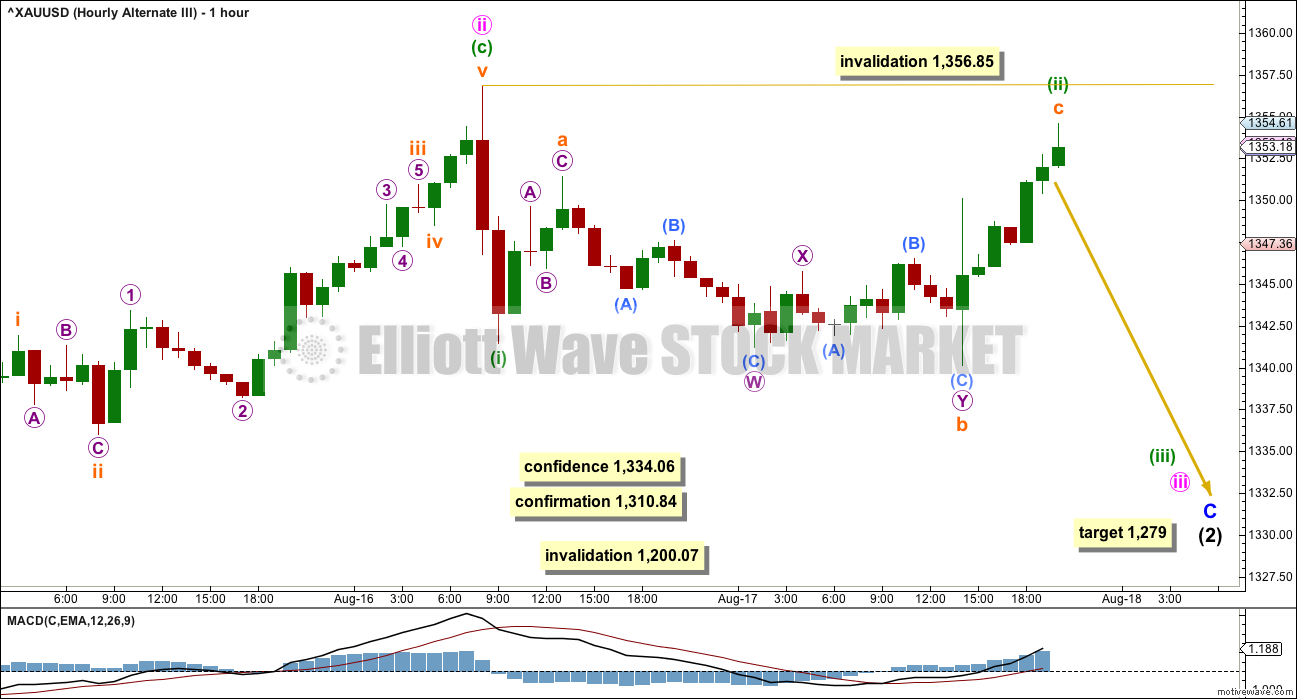
The structure of subminuette wave ii is problematic here, so a second hourly chart is provided. If subminuette wave ii is over, then it may subdivide as a double combination: zigzag – X – flat. Within the zigzag of micro wave W, the subdivisions of submicro wave (C) do not fit well. This will fit as a five wave impulse on the five minute chart, but it looks strongly like a three wave movement on the hourly chart. This is problematic.
However, it still looks most likely that subminuette wave ii is complete. The proportion between subminuette wave i lasting 41 hours and subminuette wave ii lasting 30 hours looks good, and the depth at over the 0.618 Fibonacci ratio sees this small correction most likely over here.
Within subminuette wave iii, no second wave correction may move beyond the start of its first wave below 1,340.01.
If price does move below 1,340.01, it should not be by much or for long. If 1,340.01 is breached, then use the second hourly wave count below.
This first hourly wave count expects now to see an increase in upwards movement with support from increased volume and an increase in momentum. So far that looks like what may be happening from hourly volume data at the time of publication. A new high above 1,356.85 would see the second hourly wave count invalidated and provide confidence in this first hourly wave count.
SECOND HOURLY ELLIOTT WAVE COUNT
Click chart to enlarge.
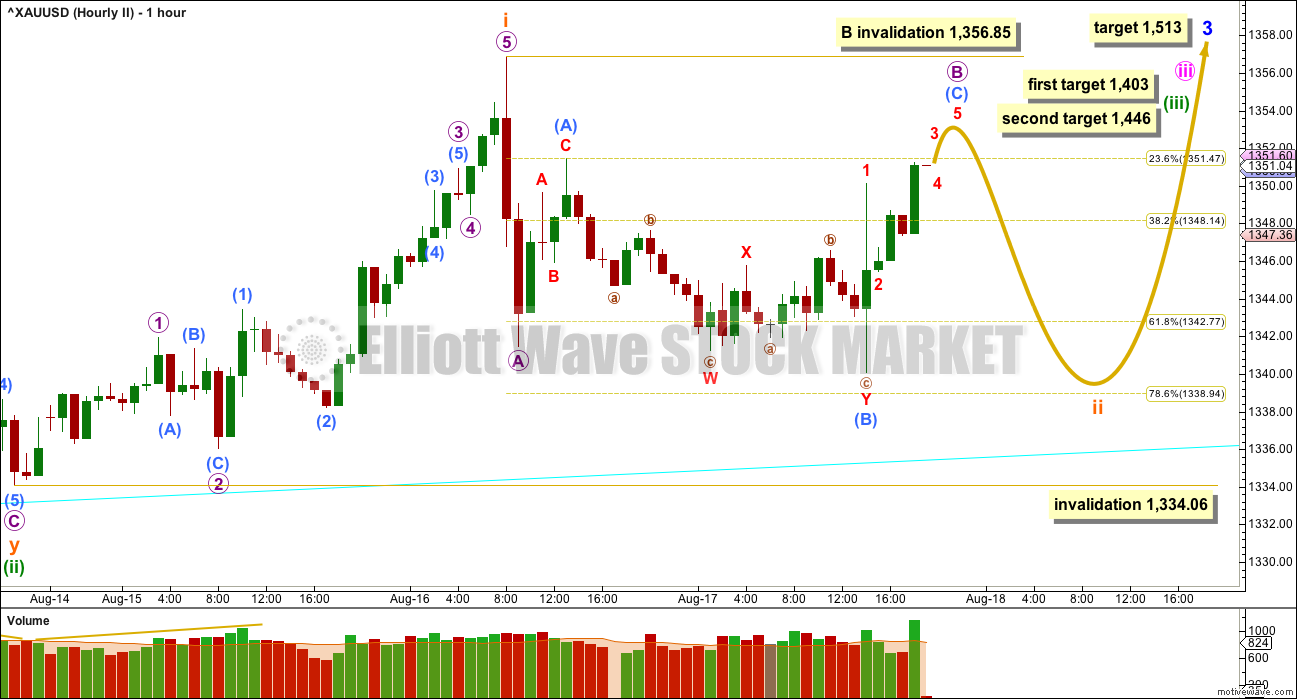
It is also possible that subminuette wave ii is an incomplete zigzag.
Within this structure, micro wave A subdivides as a five wave impulse. Micro wave B may not move beyond the start of micro wave A above 1,356.85.
Micro wave B may be an incomplete expanded flat correction, and within it submicro wave (C) must subdivide as a five wave structure and should move above the end of submicro wave (A) at 1,351.44 to avoid a truncation and a very rare running flat.
Within micro wave B, the subdivisions here of submicro wave (B) as a double combination have a neater fit than this price movement on the first hourly wave count. For this reason, this second idea must be seriously considered. The risk to long positions today must remain at 1,334.06.
When submicro wave (C) is a complete five wave structure, then another deep pullback for micro wave C should unfold. This may show up on the daily chart as a red daily candlestick or a doji. It would be very likely to end at least slightly below the end of micro wave A at 1,341.45 to avoid a truncation.
Subminuette wave ii may not move beyond the start of subminuette wave i below 1,334.06.
THIRD WAVE EXAMPLE – DAILY CHART
Click chart to enlarge.
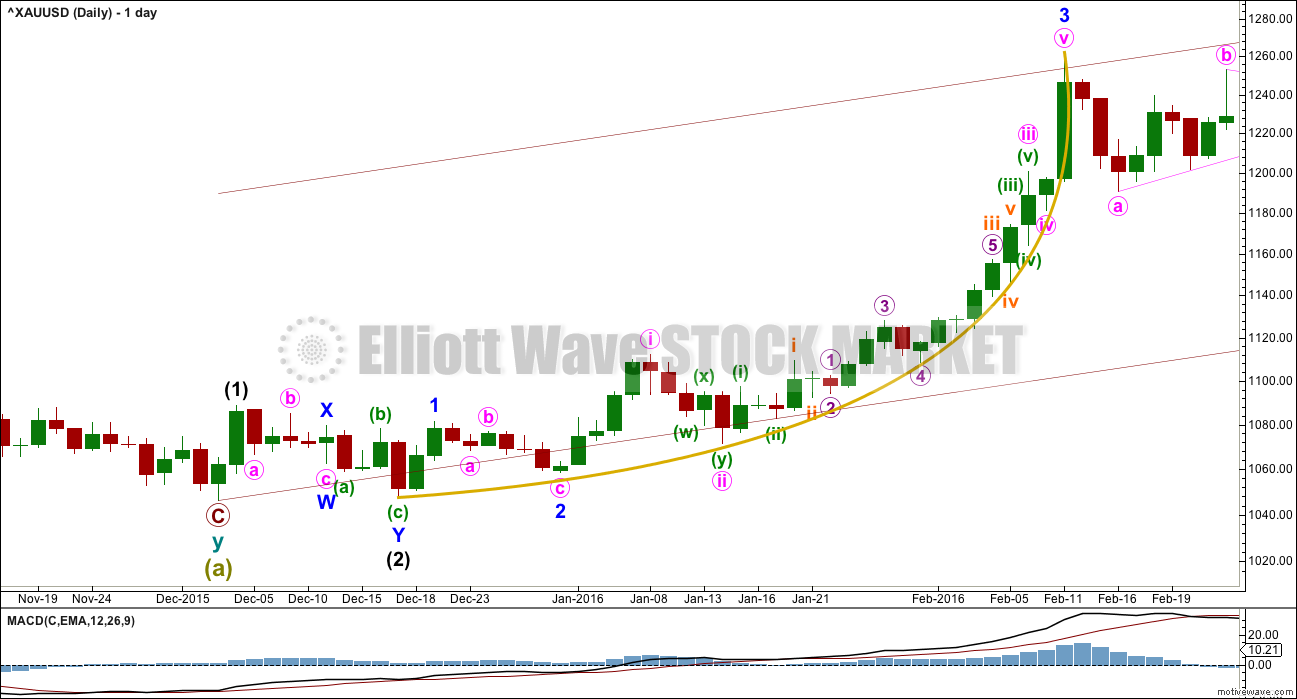
In discussing the curved look to Gold’s impulses, particularly for its third waves, here is an example.
Within primary wave 1, the third wave of minor wave 3 had a strong curved look to it. The impulse begins more slowly and has deep and relatively time consuming second wave corrections: Minor wave 2 was 0.68 of minor wave 1, minute wave ii was 0.76 of minute wave i, minuette wave (ii) was 0.56 of minuette wave (i), and subminuette wave ii was 0.64 of subminuette wave i.
The curved look comes from the disproportion between second and fourth wave corrections within the impulse. Here, minute wave ii lasted 4 days and shows clearly on the daily chart yet minute wave iv was over within one day and does not show up with any red candlesticks or doji on the daily chart.
Momentum builds towards the middle of the impulse, continuing to build further during the fifth wave and ending in a blowoff top. This is typical of Gold and all commodities.
This tendency to blowoff tops and curved impulses is particularly prevalent for Gold’s third waves.
ALTERNATE DAILY ELLIOTT WAVE COUNT
Click chart to enlarge.
This wave count is identical to the main wave count up to the end of primary wave 2. Thereafter, what if only intermediate wave (1) ended at the last high?
This movement will fit as a five wave impulse, although it does not have a very good look on the daily chart. This reduces the probability of this wave count.
If intermediate wave (1) was over at the last high, then it may have lasted 27 days. So far intermediate wave (2) may have taken 30 days and would still be incomplete. The proportions of this part of the wave count look slightly better than the main wave count.
There is a problem now with structure on the hourly chart within minor wave C. Minute wave i would have to be complete. It will fit on the hourly chart, but it does not have a good look as a five and looks better as a three on the hourly and daily chart levels. This slightly reduces the probability of this wave count.
Within minor wave C, minute wave ii may not move beyond the start of minute wave i above 1,366.87.
Minor wave C must be a five wave structure. So far within it minute waves i and ii would be complete. Minute wave iii downwards should be underway.
At 1,279 minor wave C would reach 1.618 the length of minor wave A. Price may end downwards movement when it finds support at the lower edge of the maroon base channel drawn about primary waves 1 and 2.
Intermediate wave (2) may not move beyond the start of intermediate wave (1) below 1,200.07.
ALTERNATE HOURLY ELLIOTT WAVE COUNT
Click chart to enlarge.
In order to make a reasonable judgement of each Elliott wave count, it is at this stage important to see how each wave count sees recent structure at the hourly chart level.
Within minute wave iii, no second wave correction may move beyond its start above 1,356.85. A new high above this point at this stage would invalidate this alternate at the hourly chart level, but not the daily chart level. That would add confidence to the main wave count.
Minor wave C must subdivide as a five wave structure. If price makes a new low below 1,334.06, then the probability of this alternate would increase. It would be confirmed with a new low below 1,310.84.
If price moves below 1,310.84, then expect more downwards movement for a deeper pullback to end about 1,279. Look also for price to find support at the maroon channel on the daily chart. The target at 1,279 may be a little too low; the maroon trend line may stop price before it reaches the target.
TECHNICAL ANALYSIS
WEEKLY CHART
Click chart to enlarge.
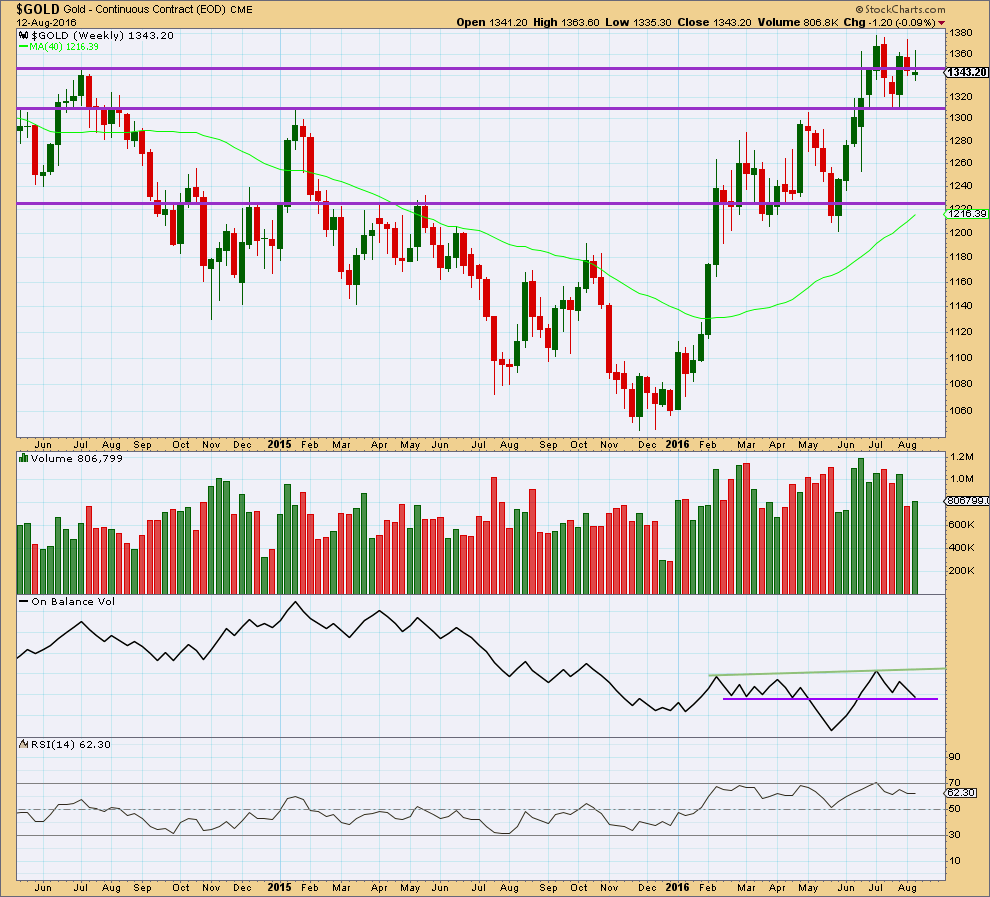
Last week completes a lower high and a lower low. The week closed slightly above the open and the candlestick is green but not by much. Overall, last week looks corrective. A slight increase for a green week gives slight support to a bullish wave count.
If the lower purple line on On Balance Volume is drawn carefully across 7th of March and 18th of April, then it was touched at the end of last week. This trend line has been weakened with OBV breaking below and then returning above it, but it still has some technical significance. A break below the purple line would be a bearish signal but a relatively weak one. A break above the green line would be a bullish signal.
RSI is not extreme. There is room for price to rise or fall.
DAILY CHART
Click chart to enlarge.
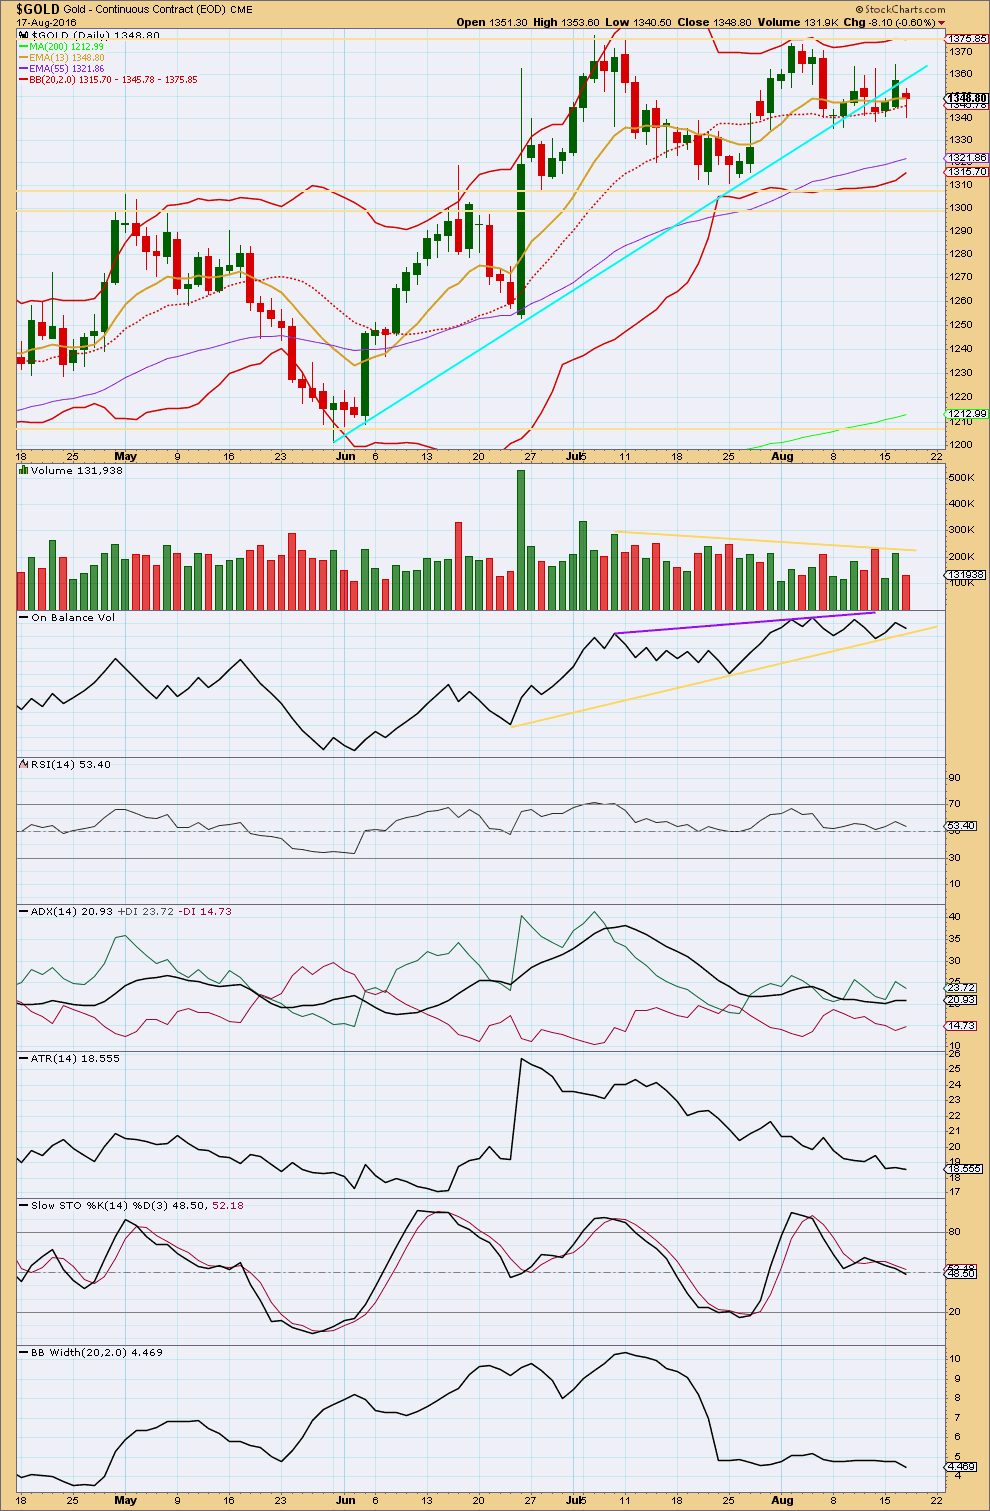
StockCharts data shows a lower low today where BarChart data shows four days in a row with higher lows. This classic analysis will be done on StockCharts data only.
Today completes a red candlestick with clearly lighter volume. The fall in price is not supported by volume and is more likely a counter trend pullback than the start of a new downwards trend at this stage. GLD volume data (as a base line for gold volume) shows three days in a row of rising price with rising volume, a bullish volume profile. The conclusion from both sets of data is the same: the short term volume profile looks to be bullish at this stage.
Overall, price is still range bound with resistance about 1,375 and support about 1,310 – 1,305. Volume and ATR are declining as price continues overall sideways, exactly as should be for a consolidation. A break out above 1,375 or below 1,305 on a day with stronger volume is required to indicate a resumption of a trending market.
Price is swinging from resistance to support and back again during this consolidation. At this stage, a range bound trading approach to this market would expect a continuation of a downwards swing, to end only when price finds support about 1,310 – 1,305 and Stochastics is oversold at the same time.
Trading range bound markets is more risky than trading clearly trending markets. Price can overshoot resistance and support yet return to within the range. The final expected swing from price never comes as it breaks out and starts trending again. Trading range bound markets is advised for only the most experienced traders.
On Balance Volume short term remains bullish while it finds support at the yellow trend line. A break below the yellow line would be a bearish signal. A break above the purple line would be a bullish signal.
RSI is close to neutral. There is room for price to rise or fall.
ADX today is flat. There is no trend indicated at this stage.
Bollinger Bands continue to remain constricted, as would be expected for a consolidating market.
During this consolidation, it is still the upwards day of 8th of July that has strongest volume suggesting an upwards breakout is more likely than downwards. The next strongest day would be the downwards day of 25th of July, and after that an upwards day of 21st of July.
This analysis is published @ 08:50 p.m. EST.
Hi Lara,
as Gold is not offering much action at this stage and Oil is blowing up. Would it be possible to just let us know which wave count might be most likely?
Or in other words, where can we most likely expect it turning south again?
Regards
Ursula
For US Oil at this stage: the wave count there sees Oil in a B wave within a B wave.
That is a market to avoid from an EW POV.
There are far too many alternate possibilities at this time with Oil for me to have any confidence at all on what Oil is going to do.
While Oil has been up for six days now in a row, it could just as easily reverse and move down for several days in a row.
The wave count is at a point there where there are too may possibilities open.
B waves can be quick sharp zigzags, or they can be complicated time consuming choppy consolidations. And even at this stage I cannot tell you with any reasonable probability which one this is likely to be. It could equally be either.
I’m not making any Oil trades at this time for that reason.
Of all the waves, B waves within B waves within larger corrections as this is right now for Oil, are the absolute worst.
I know it looks good, and it’s moving up to the target on the main wave count, but I simply cannot be confident of any calls right now for Oil.
Thank you very much Lara
The chart I posted last night (my time) didn’t work. The channel was breached, that was micro 2. Which ended very close indeed to the 0.618 Fibonacci ratio of micro 1.
This is today’s hourly wave count so far.
Lara,
Based on your extensive experience in counting Mini, Sub-micro and Micro waves,
1. would you say sub-micro Waves (3)’s have clear sub-divisions for miniscule waves? Compared to Sub-micro (1)’s and (2)’s
2. Above chart, after Micro 2 , would 2nd candle peak be sub-micro (1) and the 5th candle low would be the low for sub-micro (2)?
3. At 2:26 PM peak was for miniscule 1 of sub-micro(3) of Micro 3?
TIA, Lara
In the last third wave impulse up for Gold at intermediate degree, which ended the middle for minor 3 with a blow off top on 11th February and can be seen on the Third Wave Example – Daily Chart, micro waves 2 and 4 can be seen, but not the submicro waves within micro wave 3.
However, this third wave is starting out slower, probably because it’s bigger. So we may see even lower degree corrections show up within it. I’d expect micro waves to show up (and micro 2 is showing today) and I’ll not be surprised at all if submicro shows up.
In reply to question 2:
I haven’t put labels on that price movement next because I have not made a conclusion as to what that may be. So far it looks rather corrective, I”m concerned that micro 2 may not be over.
Question 3: I’ll add minuscule labels to submicro (3) of micro 1 in the chart today. That will show the answer visually.
Lara,
” I’m concerned that micro 2 may not be over.”
Nicely called Dec. Futures GCZ made a lower low at 8:33 PM. Thx.
The MACD for both Gold and NUGT/GDX are bullish now in 1,3,5,15,39, 78 and 195 minutes time frames.
Thanks for the heads up Richard!
2:26pm Gold notches 2-week high on expectations Fed will lift rates slowly.
(Of course Elliott Wave is the real reason)
Why oil prices just stampeded into bull-market territory, Up more than 20%
Aug 18, 2016 1:44 p.m. ET
OPEC output freeze talk, U.S. supply fall, weak dollar fuel rally
http://www.marketwatch.com/story/oil-prices-charge-into-a-bull-market-2016-08-18?mod=MW_story_top_stories
Any idea when gold might hit the 1365 – 1368 target area before the bigger drop back down towards 1345 and above 1,340.01 if that target still applies?
Just good to know on when to sell miners whether before the close or Friday.
It sure feels good to see cheap prices again for NUGT lately since I wasn’t holding overnight and just buying cheap each day and better buying in the days after a hard multiday bottom since the direction is back up instead of down.
As they say, a rising tide lifts all boats. So trade with the trend instead of against it, less surprises.
NUGT peaked at $182.37 on Friday then dropped 3 days in a row down to a low Wednesday of $145.11, a drop of 20.4 %. The sentiment of miners investors dropped from a very high percentage bullish down to a sentiment low in bullish percentage after 3 brutal days of getting burnt.
Once hurts, then twice bitten twice shy, then three times miners losing money in a row and even more hesitate to jump back in.
Remember that sentiment is the herd mentality a slow building process from the bottom and the rush only comes in at the end closer to the peak in sentiment.
Today gold opened up only $10 to $15 over Wednesday’s low and miners hard bottom.
From the open gold and miners both dropped for an hour with NUGT dropping about $7, which makes investors hesitate to buy.
Only at 12:30 pm did gold start moving up without dropping every half hour.
Gold and miners moved from 12:40 to 2:26 and almost back up to their day high at the open.
Just because gold is back up the miners don’t move back up they lag behind gold when moving up from a bottom.
Gold bottomed on December 3rd.
Miners bottomed January 16th.
However miners picked up momentum and raced past gold about 3 to 5 times the percentage increase of gold within a month.
So there is nothing wrong when miners lag behind gold from a hard bottom it also has to do with the risk factor being higher in miners versus gold so sentiment moves slower.
Today is the fifth consecutive day that USD index is down, and we’ve failed to break above gold 1355 range. I don’t know how much weight to put on this fact, but it does worry me a little about the gold bullish scenario… Anyone concerned about this?
Be patient gold and miners will move up.
Yes, it concerns me too. This environment should be great for gold, and yet no movement.
Likely sub-micro (2) over at 10:37AM, in sub-micro (3) of Micro 3 now?
Did a 4th wave up just bottom at 10:35 am at 1,347.50 beginning a larger wave up to the target zone of 1,365ish?
Richard, following from my count with 1346.16 being miniscule 2, 1347.50 was the second wave of miniscule 3, that is, nano 2.
Hmm,
No pre-market smack down today… I wonder what’s going on?
It has so far done them no good. I think that is the real story here. They could be gathering strength for another smack-down. The outcome every single time is that the smart money steps in and buys the hell out of it. I suspect that is why things are relatively quiet- folk are waiting for the banksters to give ’em a better entry price…. 🙂
pmbull.com trend lines
I figured out how to get the pmbull.com trend lines to show up and stay, which have nothing to do with software or resolution.
On the top right corner of your monitor, the ZOOM button – or + can effect the trend lines appearing or disappearing.
At 100% they show up, however less than or more than 100% and the trend lines usually disappear.
Richard,
1. Chrome- I am finding same- works Only on100% (good for you for figuring out)
2. Firefox- for me, any magnification works, although it is notorious for crashing.
3. Bravo- so far can’t even bring the chart up. Waiting to speak w/my technicians.
Thanks
Yes Melanie we finally solved the mystery of the disappearing trend lines.
Now we can make Million$.
My brother only uses 100% on pmbull that is why he had the trend lines but I only figured it out by fluke last night, better late than never.
A quick update for Gold. Another impulse up is close to completion. It should be followed by another second wave down. Which, if this wave count is correct, should offer another opportunity to join the trend.
The channel about micro 1 is working well so far. Sub micro (3) is just 0.04 longer than equality with sub micro(1). At 1,368 sub micro (5) = 0.618 X (1). That’s a reasonable target for micro 1 to end.
After a new high above the end of sub micro (3) a subsequent breach of the small light blue channel would indicate micro 2 has arrived. Draw a Fibonacci retracement along the length of micro 1. If micro 2 gets down to the 0.618 Fibonacci ratio then that may be a good entry point. Risk is still just below 1,334.06 because of the second wave count. Stops should be set just below that point.
Do not invest more than 3-5% of equity on any one position. Always use a stop!
I could be wrong. This wave count could be invalidated. If it is then cut losses short when the market proves you / me / us wrong.
Good luck everybody! I’ll be back in the morning.
Your morning our afternoon.
LOL
Yes. And that chart didn’t work did it 🙁
The expected submicro4 has entered the territory of submicro1,what is the change needed in this wave count now ?..
Any comment please
Lara.
Could the point you have labelled submicro 3 instead be the start of submicro 3 itself, that is, it is miniscule 1?
As labelled, submicro 3 is less than 1 times submicro 1 which means micro 1 is a contracting diagonal, quite a rare structure.
The other possibility I consider is to move the whole structure of micro 1, including the change I suggested, up one degree. It would then be at subminuette 3 level.
Great…can you map it on a chart and show it alan
Attached graphic for suggested amendment to submicro 3.
The other possibility suggested is to shift the structure beyond subminuette 2 in the graphic above, up one degree.
Note: Lara, in the interest of expediency, I made the suggested changes over your original picture. Hope you don’t mind.
I made a ballpark estimate. If the price structure is at Lara’s labelling (together with my suggested amendment), then minuette 3 would end at the higher target of 1446.
If the structure is shifted up one degree as per my second suggestion, then minuette 3 would end at 1403.
By the way, with my suggestion, miniscule 2 just ended at 1346.16. It was a beautiful abc correction. If this is correct, price would begin to move up from here, targeting 1365ish.
GDX close up. If this is correct, a strong move up should begin
That looks like a really good wave count, thank you very much for sharing Dreamer!
The correction you’ve labelled minute ii overlaps back into minor 1 price territory. Which means it can’t be a fourth wave, and if an impulse is continuing upwards it must be another second wave as labelled.
The implication is stronger upwards movement ahead.
Thanks Lara. I appreciate your comments on my counts.
Thanks for sharing your chart, Dreamer! I appreciate it!! 🙂
Another look at GDX showing the overhead resistance and possible neckline that GDX needs to break above
GDX may have just completed an expanded flat for Minute wave 2
Chart watchers say the US Dollar is on the verge of unraveling
http://www.marketwatch.com/story/chart-watchers-say-the-dollar-is-on-the-verge-of-unraveling-2016-08-17