
Downwards movement was expected.
Again, price moved overall sideways to complete a very small daily Gravestone doji.
Summary: Price should move a little lower to complete a five wave impulse. The short term target is at 1,315. If price breaks below 1,310, then a target for downwards movement to end is at 1,279. The longer term trend is still upwards. Corrections are an opportunity to join the trend.
New updates to this analysis are in bold.
Last weekly charts, and a more bearish weekly alternate, are here.
Grand SuperCycle analysis is here.
DAILY ELLIOTT WAVE COUNT
Click chart to enlarge.
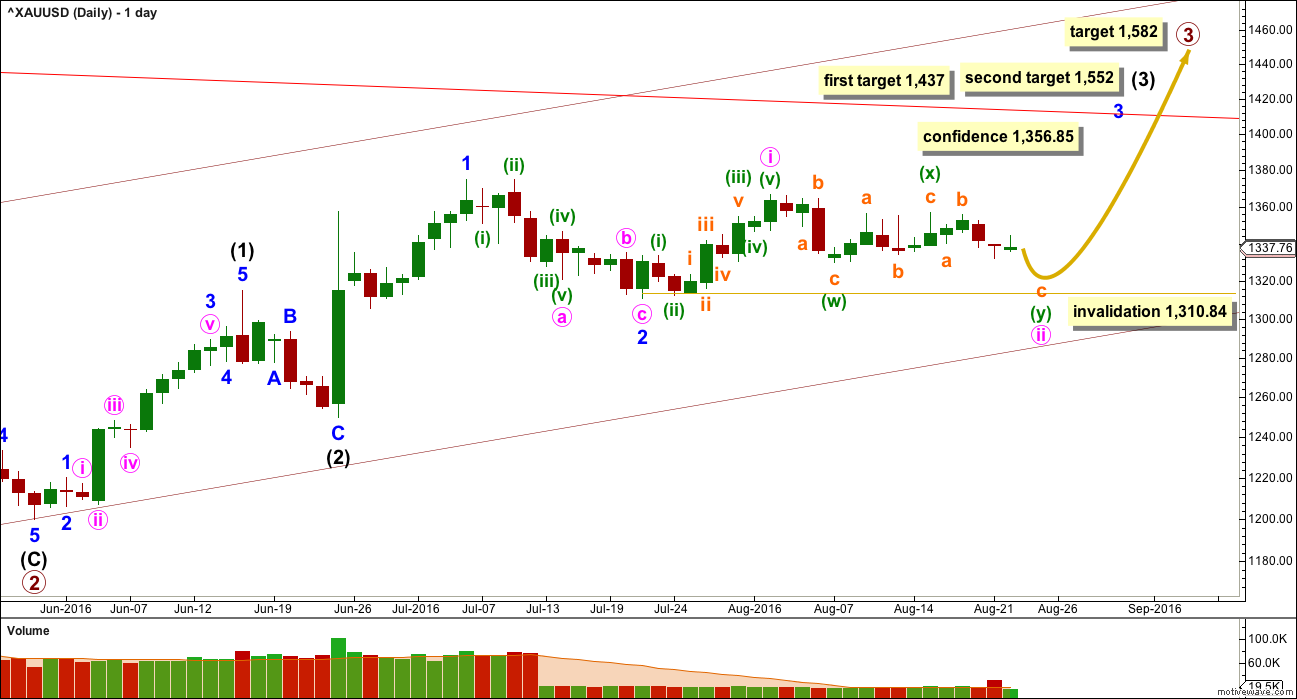
Primary wave 2 is a complete expanded flat correction. Price from the low labelled primary wave 2 has now moved too far upwards to be reasonably considered a continuation of primary wave 2. Primary wave 3 is very likely to have begun and would reach 1.618 the length of primary wave 1 at 1,582.
Primary wave 3 may only subdivide as an impulse.
So far intermediate waves (1) and (2) may be complete within primary wave 3. The middle of primary wave 3 may have begun and may also only subdivide as an impulse.
Within intermediate wave (3), the end of minor wave 1 is moved up to the last high. This fits on the hourly chart although it looks odd here on the daily chart. There was a small fourth wave correction up at the end of minor wave 1 and it subdivides on the hourly chart as an impulse. Minor wave 2 may be a complete zigzag, also subdividing as a zigzag on the hourly chart. If minor wave 2 is over, it would be 0.50 the depth of minor wave 1.
Minute wave ii is incomplete. It may be subdividing either as a double combination or double zigzag. Within the second structure in the double, labelled minuette wave (y), the structure is incomplete.
Minute wave ii may not move beyond the start of minute wave i below 1,310.84. This is the final risk to any long positions entered here or which members may still be holding. At this stage, I have chosen to close long positions, taking a little profit. I will wait for minute wave ii to be over before entering again.
At 1,437 intermediate wave (3) would reach 1.618 the length of intermediate wave (1). If price keeps going upwards through this first target, or if it gets there and the structure is incomplete, then the next target would be at 1,552 where intermediate wave (3) would reach 2.618 the length of intermediate wave (1).
A new high above 1,356.85 would invalidate the alternate wave count below and provide price confirmation of this main wave count.
Primary wave 1 lasted 14 weeks and primary wave 2 lasted 12 weeks. Primary wave 3 should be longer in both price and time as it should be extended. It may be about a Fibonacci 34 weeks. So far it has lasted eleven.
HOURLY ELLIOTT WAVE COUNT
Click chart to enlarge.
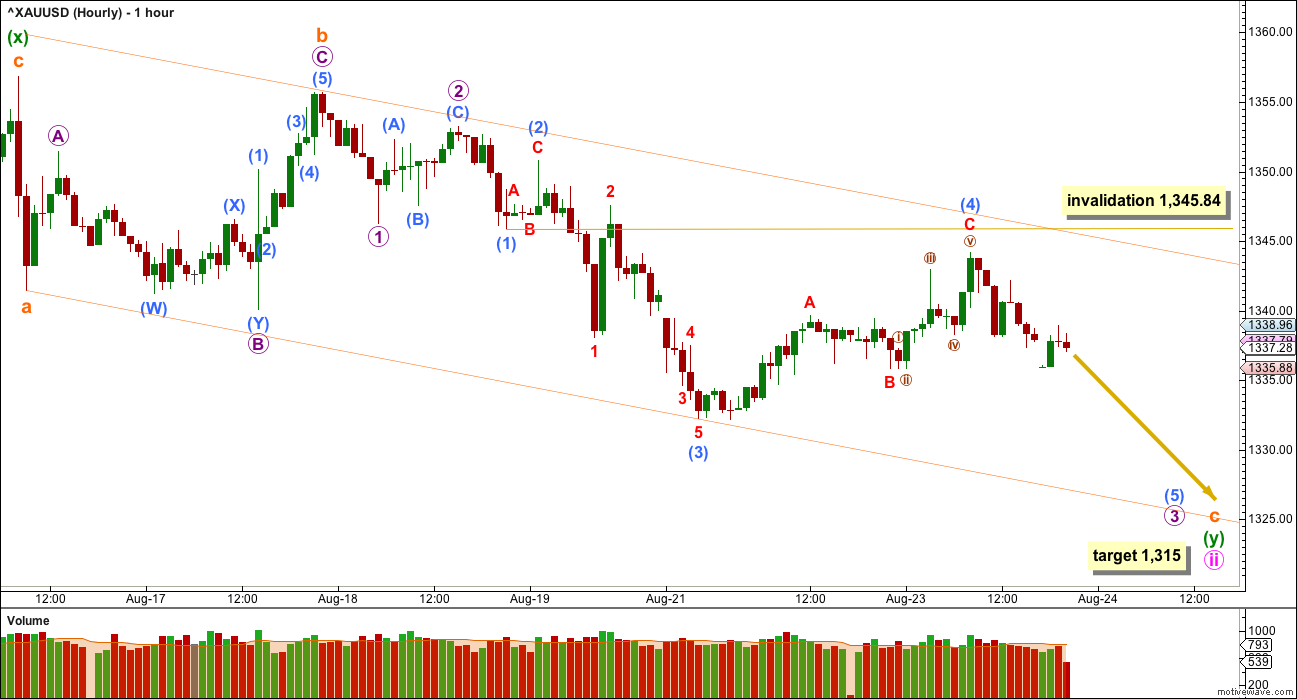
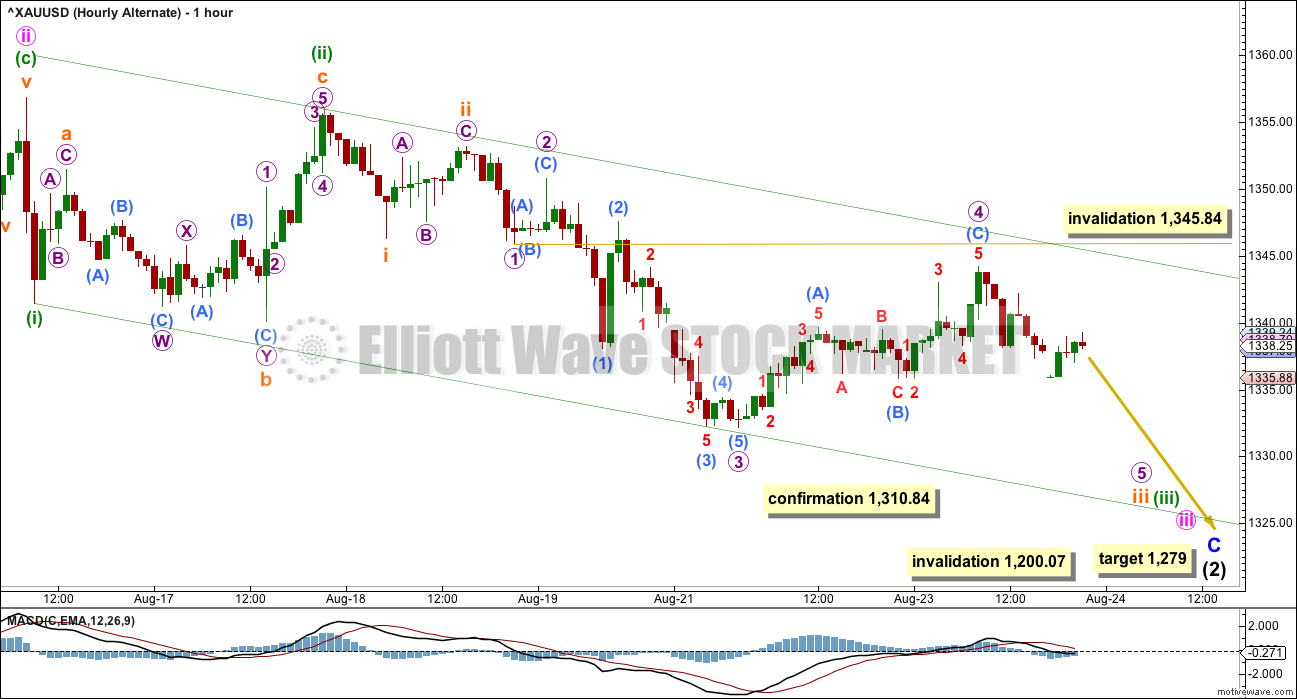
Minute wave ii fits as either a double combination or a double zigzag. The first structure in the double (seen on the daily chart) fits as a zigzag labelled minuette wave (w). The double is joined by a three in the opposite direction labelled minuette wave (x), which fits perfectly as a zigzag.
The second structure in this double may be either a zigzag or a flat correction. Subminuette wave a may be seen on the five minute chart as either a three (a quick zigzag) or a five.
At 1,315 subminuette wave c would reach 2.618 the length of subminuette wave a. Subminuette wave c must subdivide as a five wave structure. It is not a diagonal. It is unfolding as a more common impulse. Within subminuette wave c, the structure looks to be incomplete.
I have spent some time today on the five and one minute chart levels to see if the structure of subminuette wave c could be a complete impulse. There are not enough brief fourth wave corrections just before the last low to see the structure complete. The conclusion at this stage is that it is most likely incomplete, that price needs to move lower.
If this wave count is invalidated short term with a new high above 1,345.84, then my labelling of subminuette wave c as incomplete would be wrong. Invalidation of this hourly wave count by upwards movement would indicate that minute wave ii is over and a third wave up should then be underway.
THIRD WAVE EXAMPLE – DAILY CHART
Click chart to enlarge.
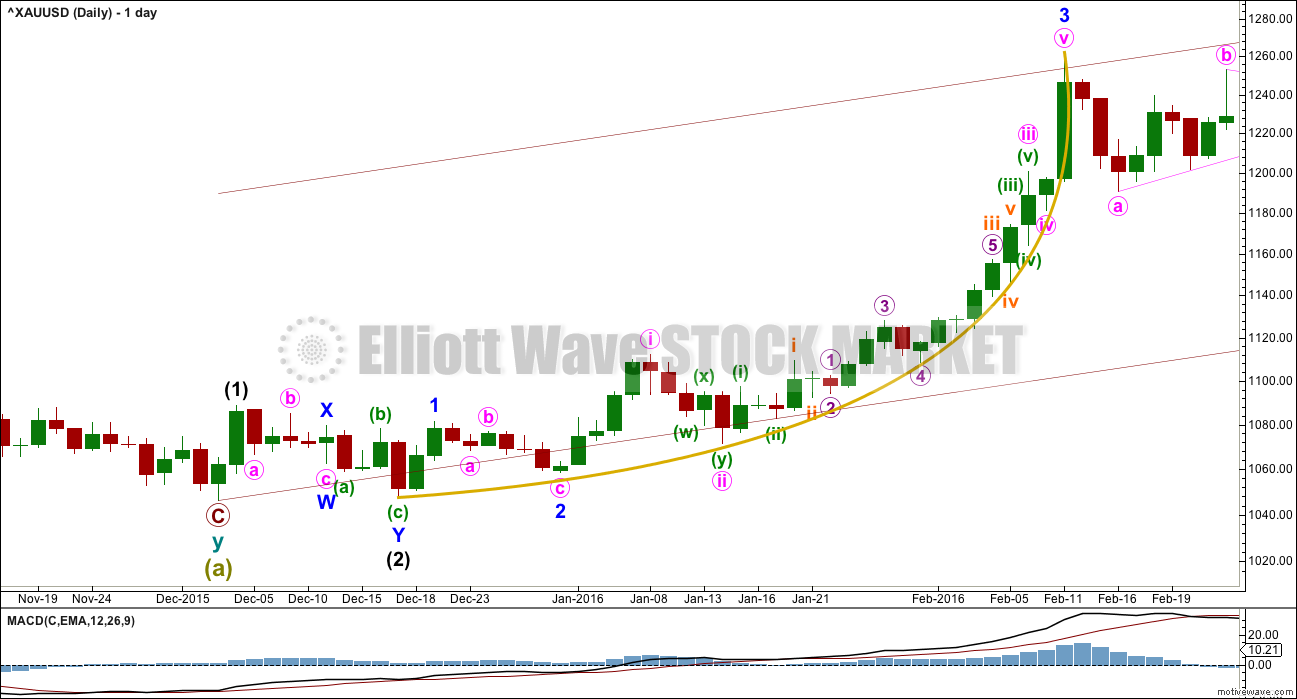
In discussing the curved look to Gold’s impulses, particularly for its third waves, here is an example.
Within primary wave 1, the third wave of minor wave 3 had a strong curved look to it. The impulse begins more slowly and has deep and relatively time consuming second wave corrections: Minor wave 2 was 0.68 of minor wave 1, minute wave ii was 0.76 of minute wave i, minuette wave (ii) was 0.56 of minuette wave (i), and subminuette wave ii was 0.64 of subminuette wave i.
The curved look comes from the disproportion between second and fourth wave corrections within the impulse. Here, minute wave ii lasted 4 days and shows clearly on the daily chart yet minute wave iv was over within one day and does not show up with any red candlesticks or doji on the daily chart.
Momentum builds towards the middle of the impulse, continuing to build further during the fifth wave and ending in a blowoff top. This is typical of Gold and all commodities.
This tendency to blowoff tops and curved impulses is particularly prevalent for Gold’s third waves.
Notice also how this third wave began with a series of overlapping first and second waves. When third waves extend, which is very common, this is very often how they begin. When that happens, they convince us the market will not move strongly and the wave count must be wrong, and they do that right before the trend moves clearly with increasing momentum and volume.
ALTERNATE DAILY ELLIOTT WAVE COUNT
Click chart to enlarge.
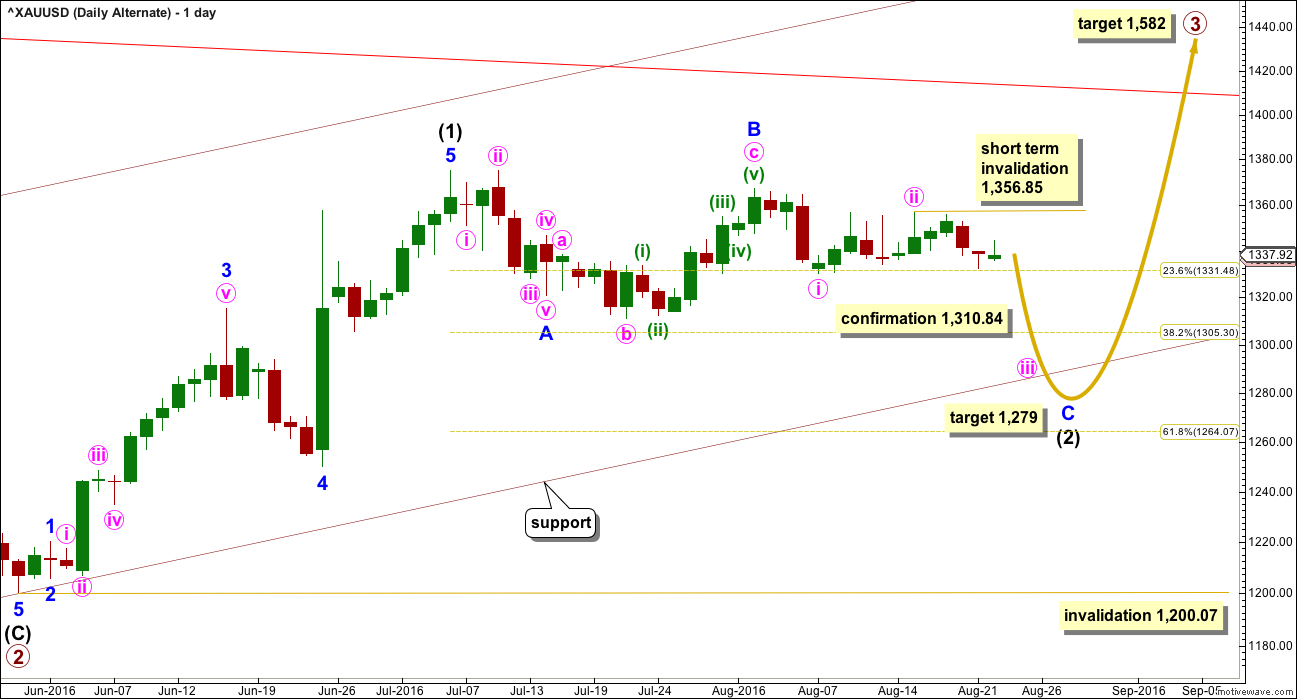
This wave count is identical to the main wave count up to the end of primary wave 2. Thereafter, what if only intermediate wave (1) ended at the last high?
This movement will fit as a five wave impulse, although it does not have a very good look on the daily chart. This reduces the probability of this wave count.
If intermediate wave (1) was over at the last high, then it may have lasted 27 days. So far intermediate wave (2) may have taken 34 days and would still be incomplete. However, the hesitancy with the last five days of overall sideways movement does not look like a third wave down at minute degree. For this reason this alternate still is judged to have a lower probability than the main wave count today.
Within minute wave iii, no second wave correction may move beyond the start of its first wave above 1,356.85.
At 1,279 minor wave C would reach 1.618 the length of minor wave A. Price may end downwards movement when it finds support at the lower edge of the maroon base channel drawn about primary waves 1 and 2.
Intermediate wave (2) may not move beyond the start of intermediate wave (1) below 1,200.07.
ALTERNATE HOURLY ELLIOTT WAVE COUNT
Click chart to enlarge.
In order to make a reasonable judgement of each Elliott wave count, it is important to see how each wave count sees recent structure at the hourly chart level.
Within minuette wave (iii), the structure looks to be incomplete. This part of downwards movement is essentially seen in the same way for both wave counts, only the degree of labelling differs. Both see an impulse unfolding lower.
Minor wave C must subdivide as a five wave structure. If price makes a new low below 1,334.06, then the probability of this alternate would increase. It would be confirmed with a new low below 1,310.84.
If price moves below 1,310.84, then expect more downwards movement for a deeper pullback to end about 1,279. Look also for price to find support at the maroon channel on the daily chart. The target at 1,279 may be a little too low; the maroon trend line may stop price before it reaches the target.
TECHNICAL ANALYSIS
WEEKLY CHART
Click chart to enlarge.
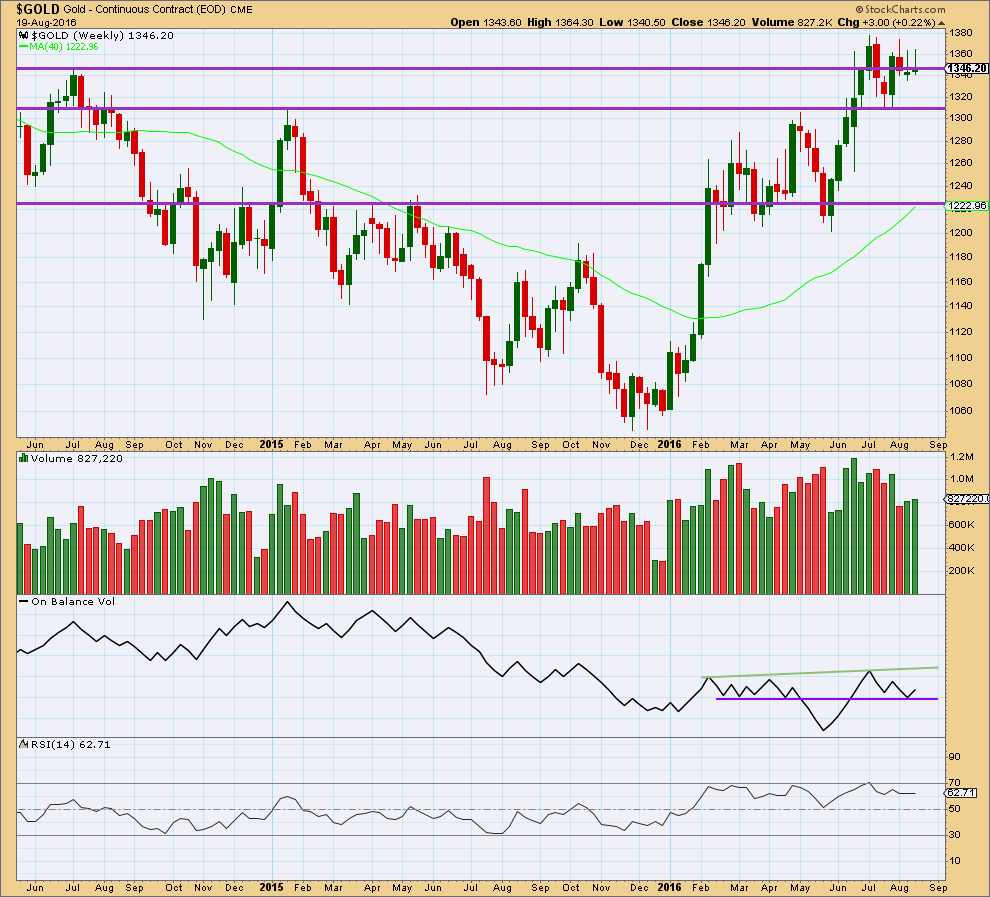
Two green weekly candlesticks in a row come now with a small rise in volume. Volume for both weeks is stronger than the prior downwards week. Short term, at the weekly chart level, the volume profile looks bullish.
Last week completes a weekly candlestick with a higher high and a higher low than the week before. Overall, price has moved upwards last week.
It is concerning for the main wave count that both of these last two weeks have long upper wicks on the candlesticks. These wicks are bearish and indicate caution. For this reason please manage risk carefully. The alternate wave count is possible and illustrates the risk currently to long positions.
On Balance Volume last week has moved up from the lower purple trend line. This is a reasonable bullish signal week.
RSI is still not extreme. There is room for price to rise.
DAILY CHART
Click chart to enlarge.
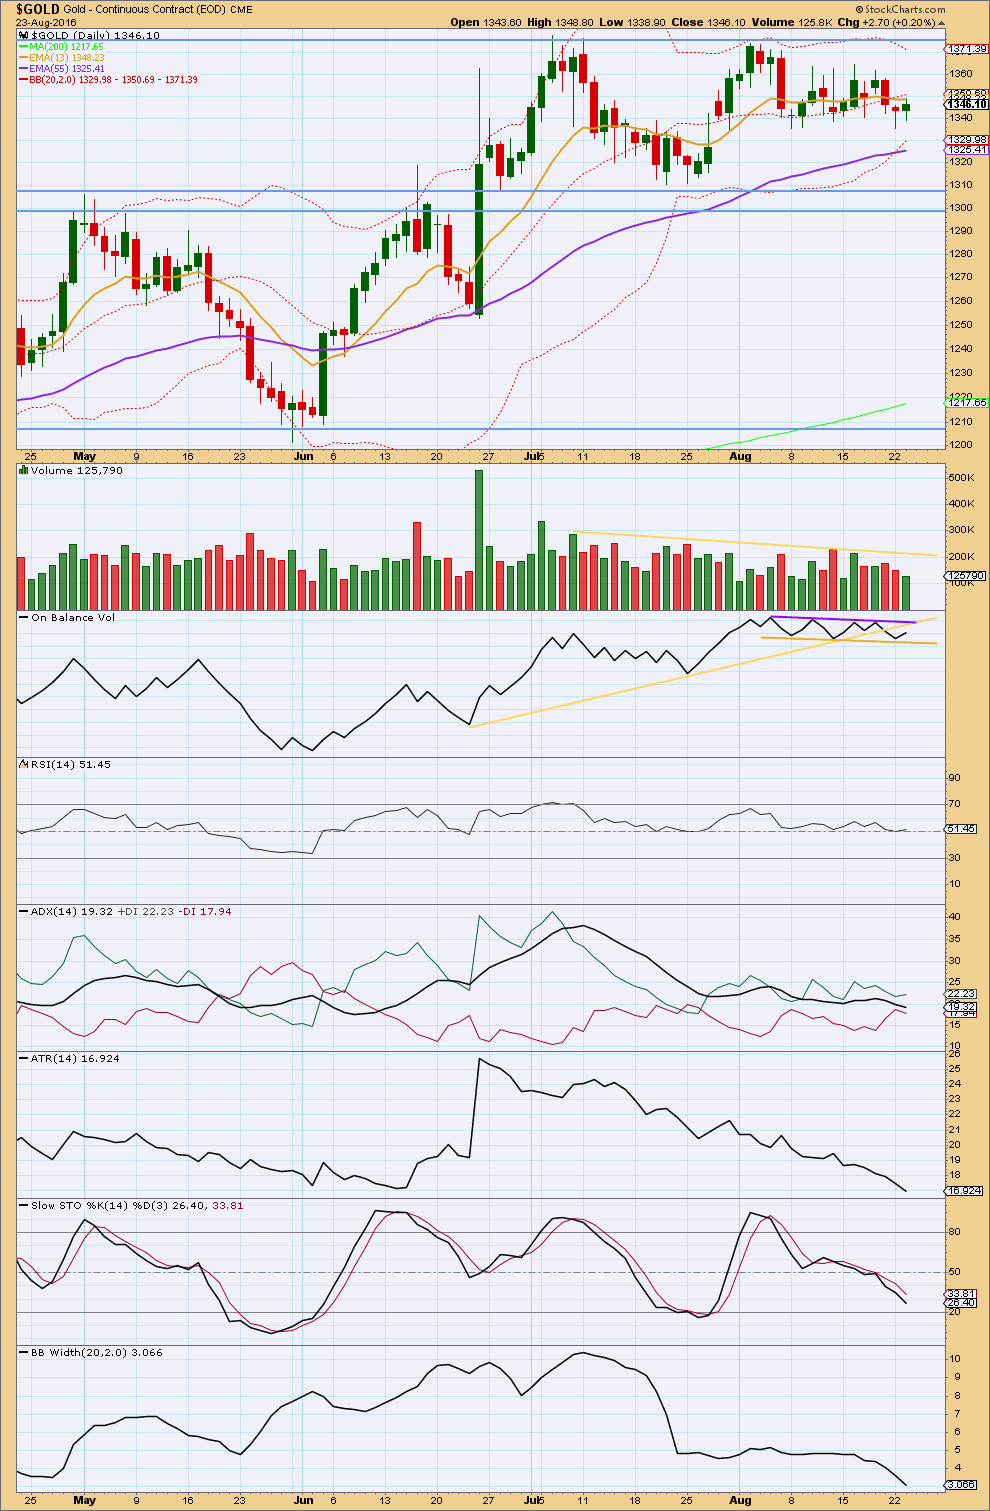
Price is range bound with resistance about 1,375 and support about 1,310 – 1,305. The consolidation began after the last wave up ended on 6th of July. During this consolidation, it is an upwards day of 8th of July which has strongest volume. The second strongest day was the downwards day of 25th of July, and the third strongest day was the upwards day of 21st of July. An upwards breakout from this consolidation is slightly more likely than downwards.
While price is moving sideways, volume is declining and ATR is declining and ADX is declining. Bollinger Bands are tightly contracted. This is all typical of a consolidating market.
Price has made slightly higher high and slightly higher low in the last 12 days. Volume is declining further as price is very tightly constrained. This consolidation looks now to be very mature; the breakout should be very close.
ADX is indicating the market is consolidating. It has not indicated a trend change: the +DX line remains above the -DX line. If a trend returns here, it should be upwards.
RSI is neutral. There is plenty of room for price to rise or fall.
Stochastics is now very close to oversold. If it reaches oversold and price finds support at the same time, then an end to a downwards swing would be expected and the start of another upwards swing.
On Balance Volume gave a bearish signal with a break below the more steeply sloping yellow line. A new support line is drawn today on OBV. With OBV tightly constrained now within this small channel, a breakout may indicate a direction for price to break out. OBV will be watched closely.
This analysis is published @ 09:49 p.m. EST.
Well, finally. Finally Gold is moving down to the target.
I was rather nervous about this prediction yesterday, and so spent considerable time on the five and one minute charts. I’m relieved to see that time wasn’t wasted today.
By my counting of this move down so far it needs one final fourth wave for micro 4 (main hourly) and then a final low for micro 5. That would complete the structure.
The channel looks like it is working pretty well.
I am still yet to count submicro (5) within micro 3. I need time on the five minute chart to do that. So this chart will just leave that question unanswered, for now.
Sorry folks this quick update is just after NY close.
Lara, another amazing analysis of yours. Your many cautions were appreciated as well. Good that you already sold with a profit as overnight sentiment dropped hard as sellers sensed the bigger gold direction change. Then the herd effect in miners investors kicked in even more from 1:00 to 3:00 pm in a panic rush for the exits.
Gold futures fall 1.2% closing below its 50-day moving average for the first time since June 7. The top gold miners ETF (GDX -7.00 %) drops hard down to day low of $26.85 the lowest price since July 25th and trades well below its 50-day moving average of $29.09 and is on pace for its first four-day losing streak since early November.
NUGT drops over 21%, down over $20 down to 105.25 day low.
Absolute bloodbath.
Today panic selling in miners kicked in.
Ooops… GDX penetrated 27.45. I bet it hits lots of stops. We might be in expanded minor 2? Looking forward to Dreamers update….Thanks! 🙂
Gold ETF Hits 4-Week Low Ahead Of Fed; Gold Mining Stocks Pounded
http://www.investors.com/etfs-and-funds/etfs/gold-etf-hits-4-week-low-ahead-of-fed-gold-mining-stocks-pounded/
“Some sell-stop orders were triggered in the futures market after key near-term technical support levels were breached,” Wyckoff of Kitco said. “Also, the outside markets are in a bearish posture for the precious metals on this day, as crude oil prices are lower, and the U.S. dollar index is higher.”
In an email to IBD, Wyckoff noted that while gold prices are in a near-term downtrend, the trend over the past year “suggests the path of least resistance will remain up, until a bearish technical signal occurs.” A close below the 50-day Wednesday for GLD and GDX “would be more significant,” he said.
FRIDAY, AUG. 26
10 am Janet Yellen speech, Jackson Hole
This Friday’s Janet Yellen speech in Jackson Hole may be more important than usual as some world financial leaders will be there.
It appears that for every opinion in one direction, there’s an opposing opinion that supports the other direction. CNBC offers articles that state there will be no interest rate hike in September, but also publish another article that indicates that this is the perfect goldilocks moment to do so. Hmmmm?
Regardless of the rhetoric and the technicals/ charts, I believe gold’s direction will be dictated by the next set of economic data. We have GDP being released on Friday prior to Yellen’s speach and another very important jobs data release scheduled for next Friday. Expectations are that Yellen may be more hawkish with her comments due to the couple of months of good economic data released in order for the market to adjust their low 26% expectation for a September 21st rate hike. A solid GDP report and another good Jobs report will provide more fuel for a September rate hike. Even if they don’t raise in September (which I doubt that they will do because inflation is lacking), gold may only get a temporary pop at that point (9/21) because the rate hike probabilities for December will only increase. Anyway, just sharing some thoughts to stimulate conversation. Looking at today’s GDM price, and the price of GDX compared to Dreamer’s charts (thanks so much for those!!!), and Lara’s target for gold to decline further, it appears that DUST has the curved look to it on the daily that we had hoped we’d see for gold.
From last two weeks these news are flashing around about dumping of gold worth in billions and trillions.
What does such kind of moves suggests ??
Is it that the big whales sitting out there are actually bearish or is it that they are fooling the market sentiment ?
And how should we look at these moves ?
I think it means that the hugely bullish gold sentiment this year is becoming more bearish and the big gold increase since December 3rd four year bear gold bottom and skyrocketed price in miners since mid January may drop much more before Friday clarity from the FED speech or even Monday from the world reaction.
On the whole that action gave a perfect shape to the hourly chart with micro 3 on subminutte c.
Now i think we will see brief micro 4 than a strong n swift micro 5 to end subminutte c.
I will be looking to buy arnd 1315 with sl just below 1310
Somebody just decided to dump $1.5 Billion worth of gold…perhaps the beginning of the last leg down?
http://www.zerohedge.com/news/2016-08-24/someone-just-puked-15-billion-notional-gold
Absolutely predictable. The objective is to shake as many weak hands as possible out of long positions ahead of a sharp move higher. These kinds of moves are the result of massive sales in the futures market and have nothing whatsoever to do with reality. While it is true that many retail traders might response to the idiocy about possible rate hikes, what we are seeing is deliberate price suppression engineered by central banks. Their efforts will ultimately prove futile. Next support level at 100 DMA.
I think the big question would be will traders consider this is a dip buying opportunity or trend change? It’s impossible to predict, but Lara already gave us a plan: “Summary: Price should move a little lower to complete a five wave impulse. The short term target is at 1,315. If price breaks below 1,310, then a target for downwards movement to end is at 1,279. The longer term trend is still upwards. Corrections are an opportunity to join the trend.” Good luck!
Dreamer you have became a champion of GDX wave counts…hats off..
Its impossible to predict these markets but projections made by you on gdx is just great.
Lara will be proud and happy now..you are easing her burden on gdx counts. 🙂
Thanks James. I swing trade the miners, usually NUGT and DUST, so spending the time to try and figure out the most probable counts really helps me. I certainly don’t have her skills, but she is a good teacher, so I’m learning as I go. I find that I learn more by actually practicing and not just reading.
I know members would prefer to see GDX analysis from Lara, but we all realize that her time is limited. She has been generous to give us GDX updates every month or so. Hopefully my work helps as I certainly don’t want to mislead anyone. So please feel free to let me know if you see better counts ?
PS – I always do my analysis on GDX and then convert my buy/sell targets to NUGT/DUST as applicable as I think doing analysis on leveraged ETF’s is generally not accurate.
So here’s an hourly update to the daily GDX count that I shared yesterday.
Minute 2 may be completing as an expanded flat with Minuette wave c nearing completion. If this count is correct, I think the move down should end in the next couple of days, likely between 28 & 28.50. It looks good so far.
I do have some reservations about this count due to the breach of the daily channel, but until it gets invalidated below 27.45, it’s still my main count. Good luck trading!
GDX moved down again today and found support at the 50 MA.
The move down was supported by a small increase in volume, but the volume trend is still declining.
OBV also continued lower. Stochastics is entering oversold, but has yet to turn upwards. More down is likely.
That’s a tired looking correction…. nearly over?
I’m thinking it will end this week as the important Janet Yellen speech is on Friday at Jackson Hole. There’s little clarity or rest for weary Fed beat reporters, as the markets look towards the main event this week in Jackson Hole.
Markets watching Yellen at Jackson Hole for hike hints but Rabobank says admitting the Fed won’t hike poses shocking risks
Leslie Shaffer | @LeslieShaffer1
Sunday, 21 Aug 2016 | 9:12 PM ET
CNBC.com
http://www.cnbc.com/2016/08/21/markets-watching-yellen-at-jackson-hole-for-hike-hints-but-rabobank-says-admitting-the-fed-wont-hike-poses-shocking-risks.html
Personally, I don’t think the Fed. would raise the rate before the election. I don’t think they like to influence or alter the economy by raising rate… . 2 cents
I agree, they won’t raise; but they want (need) to make everyone think that they might. I think rates will stay low for a very long time. There’s too much debt out there. Citizens and governments won’t be able to pay their debt if rates rise too much. It’s a big ponzi game. At some point in the future it will get ugly, but who knows when? These things can take longer than expected to play out.
Yup, that’s why it’s pointless to guess when the Fed would raise rate. It’s much better to trade by focusing on price (technicles) rather than news or fundamentals.
Yes, I think its close. Maybe an expanded 5th wave at Micro degree as I show above. We’ll know this week!