
All three daily Elliott wave counts remain valid.
The invalidation / confirmation point may now be moved lower today.
Summary: Some more downwards movement next week looks most likely, to about 1,279. If this target is wrong, it may be a little too low. In the short term, a new high now above 1,330.01 would be confirmation that the correction is likely over and the next wave up has begun.
New updates to this analysis are in bold.
Last weekly charts are here.
Grand SuperCycle analysis is here.
DAILY ELLIOTT WAVE COUNT
Click chart to enlarge.
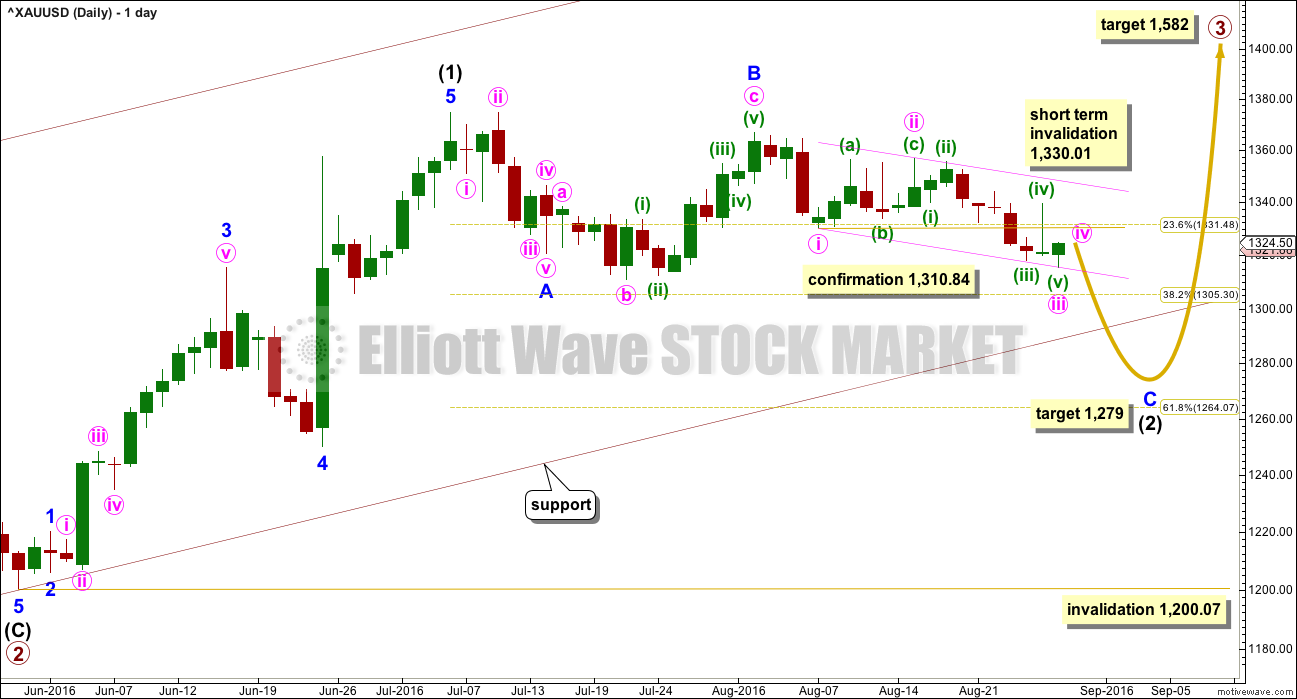
Primary waves 1 and 2 are complete. Thereafter, this wave count differs from the two alternates.
This main wave count will expect primary wave 3 to be longer than primary wave 1. Because this is very common, this is the main wave count and it expects the most common scenario is most likely. At 1,582 primary wave 3 would reach 1.618 the length of primary wave 1.
Only intermediate wave (1) so far is complete within primary wave 3. Intermediate wave (2) may be close to completion. It may find support at the lower edge of the base channel drawn about primary waves 1 and 2. Intermediate wave (2) may not move beyond the start of intermediate wave (1) below 1,200.07
Primary wave 3 may only subdivide as an impulse.
Minute wave iv may not move into minute wave i price territory above 1,330.01. If price moves above 1,330.01 in the short term, then it may also be possible that minute wave iii is not over. No second wave correction within minute wave iii may move beyond the start of its first wave above 1,356.85. A new high above 1,356.85 would invalidated any continuation of minute wave iii and provide further confidence to the alternate wave count.
At 1,279 minor wave C would reach 1.618 the length of minor wave A. Price may end downwards movement when it finds support at the lower edge of the maroon base channel drawn about primary waves 1 and 2.
Intermediate wave (2) may not move beyond the start of intermediate wave (1) below 1,200.07.
Primary wave 2 lasted 56 days (one more than a Fibonacci 55). So far intermediate wave (2) is more brief in duration. It has lasted 38 days and may be just a few days away from completion.
Draw a small channel about minor wave C, using Elliott’s technique, and copy it over to the hourly chart.
HOURLY ELLIOTT WAVE COUNT
Click chart to enlarge.
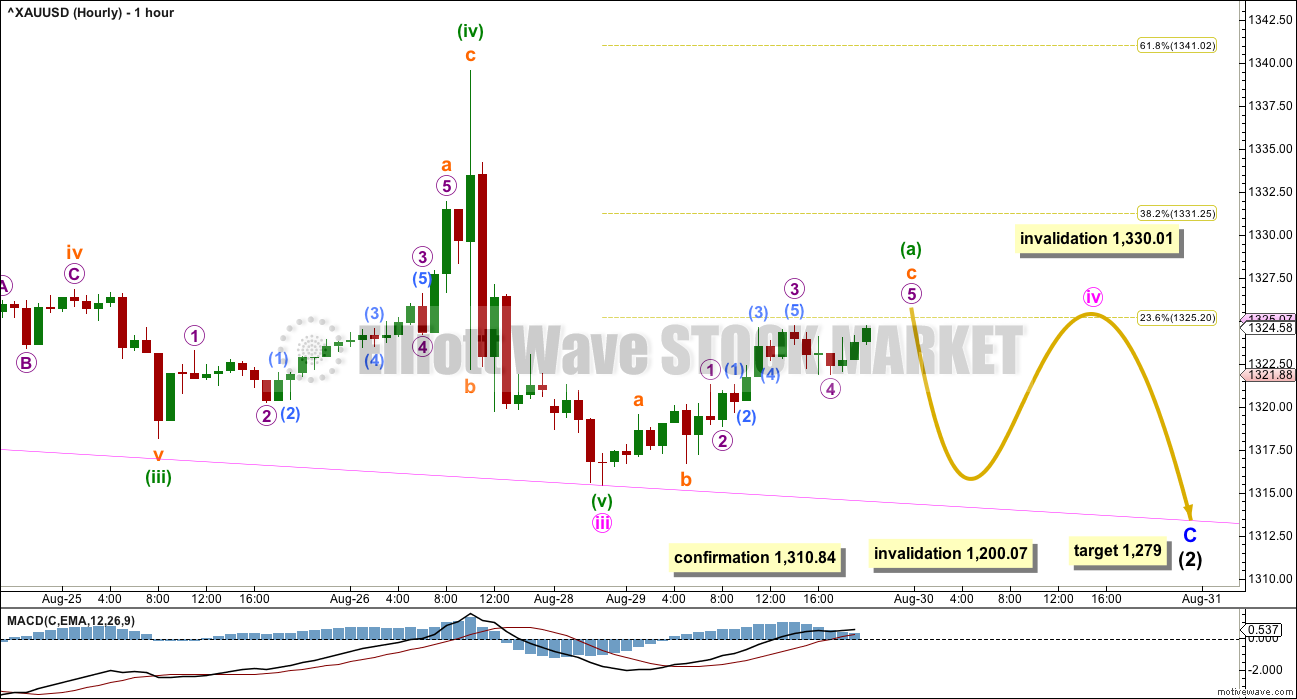
Minor wave C must subdivide as a five wave structure. This wave count would be confirmed with a new low below 1,310.84.
Minor wave C still needs more downwards movement. Within minor wave C, minute wave iii is now complete. Minute wave ii was a deep zigzag, so to exhibit alternation minute wave iv may be a more shallow sideways structure and would most likely be a combination, flat or triangle. Minute wave iv may not move into minute wave i price territory above 1,330.01.
When minute wave iv is over, then the target may be calculated at minute degree also. At that stage, it may change or widen to a zone. If it changes, it may be moved upwards.
ALTERNATE DAILY ELLIOTT WAVE COUNT
Click chart to enlarge.
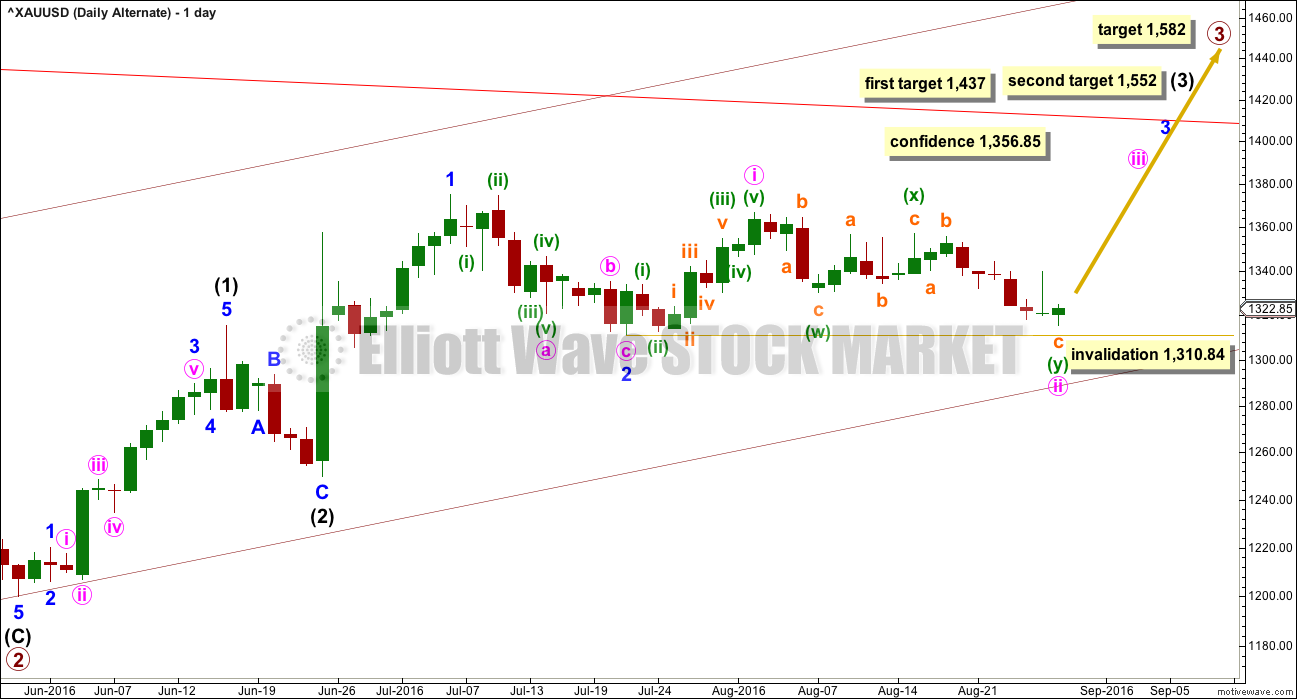
The duration of minute wave ii now gives this wave count the wrong look. Lower degree second waves should be more brief in duration than second waves of a higher degree. Here, minute wave ii has lasted 19 days, minor wave 2 lasted 11 days, and intermediate wave (2) lasted 6 days.
At 1,437 intermediate wave (3) would reach equality in length with intermediate wave (1). At 1,552 intermediate wave (3) would reach 1.618 the length of intermediate wave (1).
Minute wave ii may not move beyond the start of minute wave i below 1,310.84.
A new high above 1,356.85 would add further confidence to this wave count. At that stage, alternate ideas for the main wave count would be invalidated.
ALTERNATE HOURLY ELLIOTT WAVE COUNT

Click chart to enlarge.
A final fifth wave down would still be required for this alternate wave count. Upwards movement for Friday’s session will not subdivide as a five; it fits only as a three because of the deep spike labelled sub micro wave (B).
Friday’s session would have to be another fourth wave correction for this alternate.
After a slight new low, then this alternate wave count would expect upwards movement.
A new high above 1,339.48 is required for confidence in this wave count. At that stage, a third wave up at four degrees should be expected to be in the very early stages.
ALTERNATE III DAILY ELLIOTT WAVE COUNT
Click chart to enlarge.
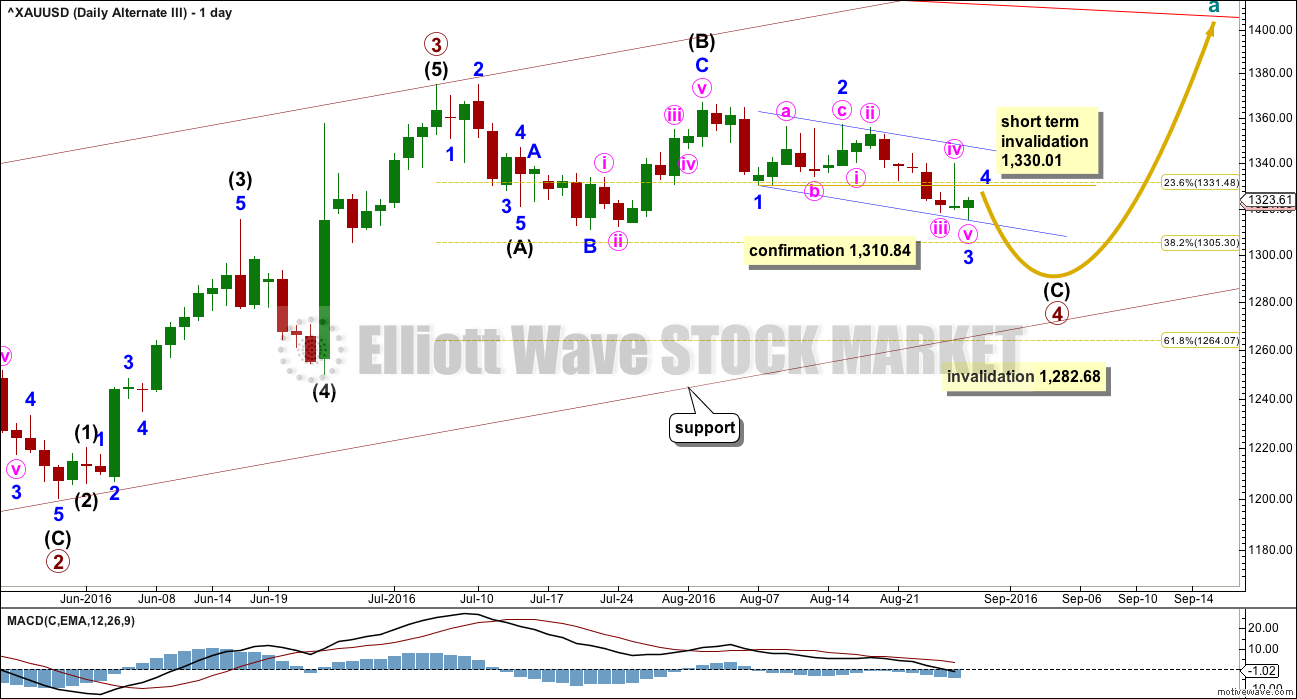
It is possible that primary wave 3 is over and shorter than primary wave 1. Primary wave 3 shows stronger momentum and volume than primary wave 1 (see technical analysis weekly chart).
If primary wave 3 is over, then the current consolidation for Gold would be primary wave 4.
Primary wave 2 was a relatively shallow 0.35 expanded flat correction. Primary wave 4 may be unfolding as a deeper zigzag which would exhibit perfect alternation.
Primary wave 4 may not move into primary wave 1 price territory below 1,282.68.
Primary wave 5 would be limited to no longer than equality in length with primary wave 3, so that the core Elliott wave rule stating a third wave may not be the shortest is met. Primary wave 5 would have a limit of 174.84.
This wave count expects more downwards movement to complete a five wave impulse for intermediate wave (C) in the same way as the main wave count expects a five wave impulse down to complete minor wave C. Only the degree of labelling differs; this wave count is one degree higher.
The hourly chart would be exactly the same except for the degree of labelling.
It is also possible that primary wave 4 may be a regular contracting triangle. If sideways movement continues in an ever decreasing range, then that idea would be published. At this stage, a zigzag looks more likely because the subdivisions have a slightly better fit.
TECHNICAL ANALYSIS
WEEKLY CHART
Click chart to enlarge.
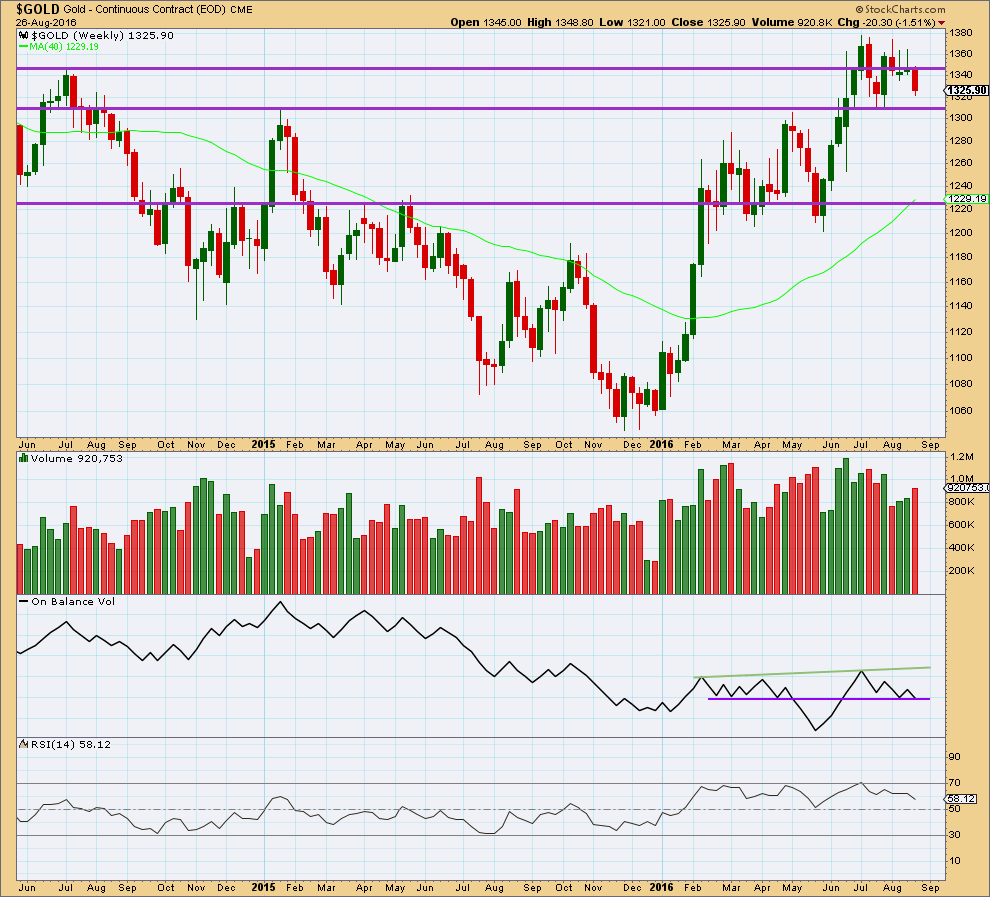
A strong downwards week with an increase in volume supports the main and alternate III wave counts. Overall, volume is still declining and price remains range bound.
The prior two green weekly candlesticks had long upper shadows which was bearish.
Price may find some support about 1,310.
On Balance Volume at the end of last week has come down to find support at the purple trend line. This may help to stop price falling much further.
RSI is not extreme. There is some hidden bullish divergence with price and RSI: RSI has made a lower low below the low of 25th of July but price has made a higher low. This indicates some weakness to this downwards movement. It is more likely to be a smaller correction than a sustainable trend.
DAILY CHART
Click chart to enlarge.
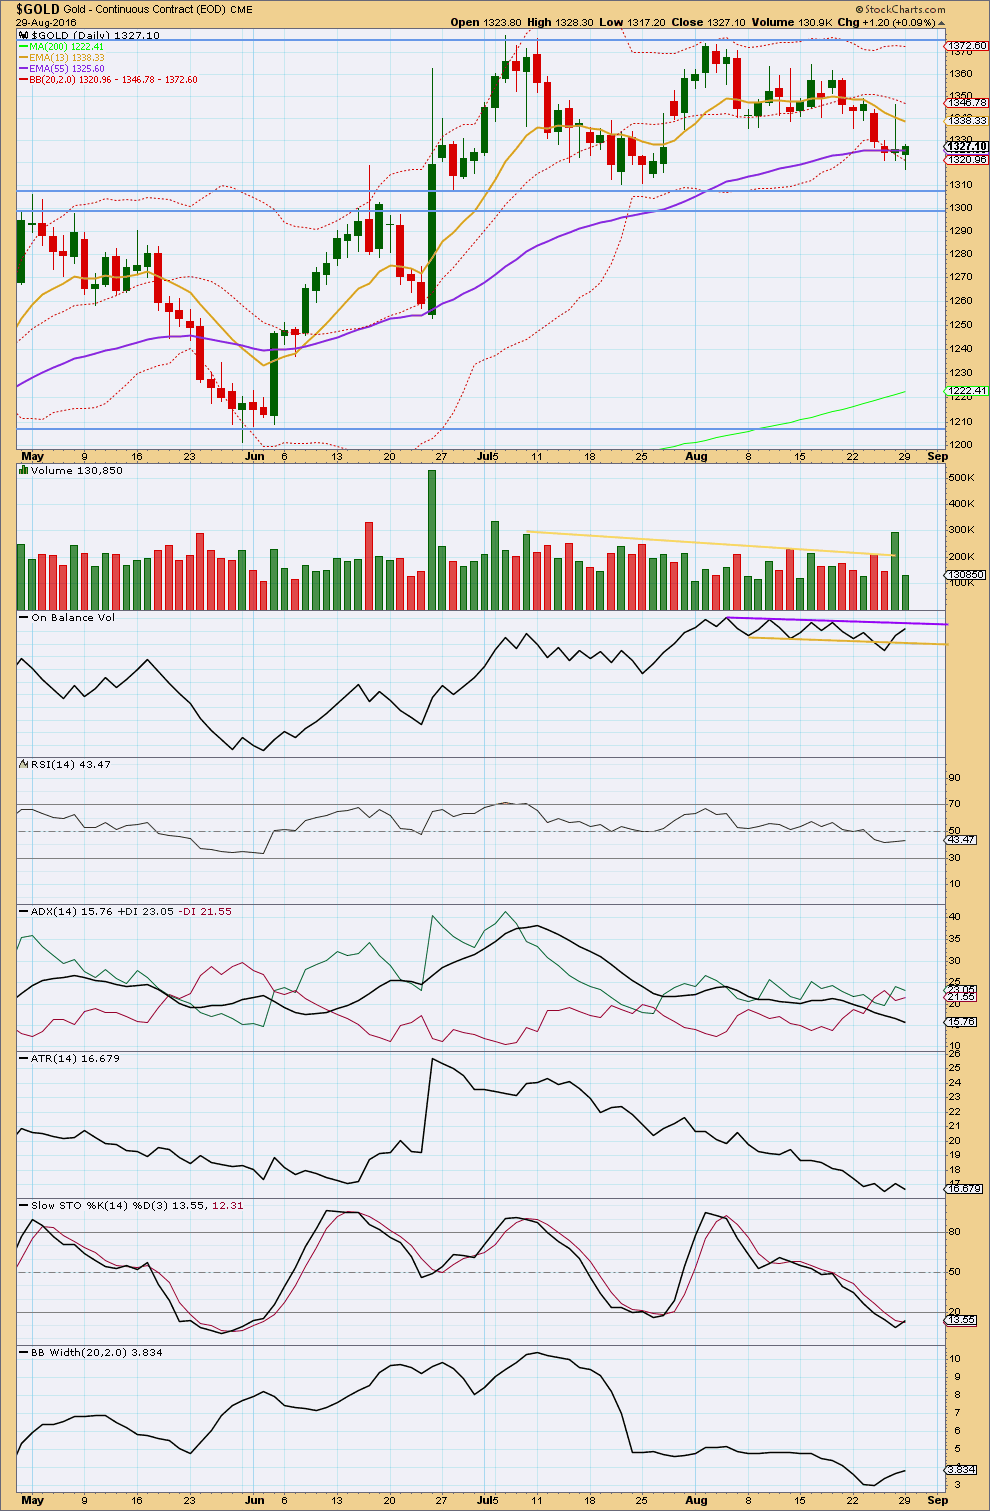
Overall, price remains range bound with resistance about 1,375 and support about 1,310 – 1,305. This range bound period began back on 7th of July. During this range bound period, it is the two upwards days of 8th of July and 26th of August which have strongest volume suggesting an upwards breakout is more likely than downwards. This supports all three Elliott wave counts.
The long lower wick of today’s candlestick is bullish as is the colour. However, the decline in volume is bearish; this upwards movement for Monday is not supported by volume, so it is more likely a counter trend movement (within a small downwards swing within the larger consolidation) than the start of a more sustainable upwards swing.
The 55 day moving average may provide some support here.
On Balance Volume may find resistance at the purple line. This may assist to halt the rise in price. A break above the purple line would be a reasonably strong bullish signal.
RSI is not extreme. There is room for price to rise or fall. There is no divergence today between price and RSI to indicate weakness.
ADX continues to decline and the +DX and -DX lines are whipsawing about each other. ADX indicates this market is not trending. ATR agrees as it too continues overall to decline.
Stochastics is oversold. Price has not yet reached support at 1,310 though, so a little more downwards movement from price may be expected before this downwards swing is over. This approach expects the same movement next as the main Elliott wave count.
Bollinger Bands are widening now for three days in a row. A trend may be beginning to return. If it is, then it would be down. However, this contradicts ADX and ATR.
Overall, the decline in volume for Monday suggests a little more downwards movement ahead for price to find support about 1,310 – 1,305 to end this downwards swing.
This analysis is published @ 09:16 p.m. EST.
[Note: Analysis is public today for promotional purposes. Member comments and discussion will remain private.]
The lower this move goes the more likely minute iv is over and was more brief than expected. That is possible.
So far minuette (b) is 1.78 X minuette (a). It’s now longer than the common range, but less than the maximum convention of 2X.
At 1,305.95 minuette (b) would be 2 X minuette (a). Below this point the idea that downwards movement is a B wave should be discarded. At that stage minute v would be confirmed as underway.
That’s the problem with expanded flats for fourth waves. They can have long B waves, and when they make new price extremes it’s impossible to tell if the move is a B wave or if the correction was over and the move is the fifth wave.
To Dreamer and Richard,
If Elliott Wave International (I also get their STU by Steve) is suggesting that a Primary B wave in Gold MAY have ended, and Primary C down is beginning, might the following be playing out in Both gold and GDX:
1. I believe Dreamer is noting Lara’s Daily ALT. wave count fr. Aug 26th, Invalidated @ 26.17 as of today.
2. Could we now be in (1) of Primary C, w/(2) coming as a retrace Up, therefore if one holds any GDX/Gold, etc. that is about the best opportunity one will get to recoup some/all and get out.
I would like your takes on this. I am Not saying this is going to happen, but it does follow Lara’s ALT., Tim Wood (Cyclesman.net) see a final important Season Low/9yr low coming. McClellan suggests a similar take.
I’d appreciate your feedback. Thanks
The problem from an EW perspective is if super cycle (b) is over that means super cycle (a) absolutely must be counted as a five. It cannot be seen as a three.
Because (b) is < 0.9 X (a), so the minimum for a flat is not met. And the problem with that idea is this chart. See the gross disproportion between cycle II and primary 2: cycle II lasted 6 weeks, primary 2 lasted 39 weeks. If a base channel was drawn about cycle I and II then the whole of the following wave down would sit above that base channel. It has absolutely the wrong look. This is the only way I can count super cycle (a) down as a five and meet all EW rules.
My conclusion is this wave count is highly likely to be wrong.
Which means the current bull run for Gold is highly likely to be not over yet.
But as always, this is a probability not a certainty. And it’s my judgement based upon my analysis.
Awesome EW analysis, Lara! It’s quite unbelievable that cycle II is so much shorter than primary 2. Unreal lol Yr EW knowledge is just brilliant! 🙂
Melanie, I pulled up a chart that I had from the last EWI open house in April. I can post this since it was free to the public at that time. Based on your post, I made a note where it sounds like EWI thinks we are currently.
Personally, I think it’s too early to say the Gold bull is over. I think the fact that Miners were strong enough to get above their “Magee Bear Market Trend line” is a sign of strength, but it’s problematic that Gold has yet to breach it’s Magee Bear Trend line.
Regardless of where we are in the big picture, I do think that GDX (and Gold) are very close to a healthy bounce. I will post a GDX chart later.
Dont know why now everyone is posting such a devilsome bearish charts. Guys cool down and hold your nerves. Gold is in a bull trend for now and we are expecting it to bottom soon. So hold right at the right time and sit tight.
Yes. The recent spike in bearish comments may therefore portend near term countertrend relief rally.
🙂
It may well do
James, I agree with you. Like our member Verne said this correction move intends to eliminate most of the leveraged hands. Bull trend would remain after this wash out….
http://www.mcoscillator.com/learning_center/weekly_chart/major_cycle_low_upcoming_in_gold/
McClellan Mkt. Report written May , 2016: an 8Yr Cycle for Gold w/final 13.5mo. Season low coming sometime late fall 2016/possibly into 2017.
Hi Melanie, you seem to do a lot of research. Thanks for posting some of your findings.
I captured a screenshot from this article and made a couple of notes. My takeaway is that the upcoming cycle low does not have to be a lower low for gold. If you look at the example I highlighted from the last bull, you can see that a lower cycle low can sometimes be a higher low for gold. I think its too early to throw in the towel on the gold bull.
Hedge Funds Are Betting on Gold. Should You?
Elliott Wave International – August 30th
I wanted to share a portion of Steve Hochberg’s gold coverage from last night’s Short Term Update:
In [Gold], the normal pattern of Large Speculators, a group mainly comprising hedge funds, is to increase their net-long bets in futures and options as the prices rise. The Commercials, the insiders, do the opposite. When these cohorts do not adhere to their typical patterns, it’s a signal to pay close attention to the wave structure. As gold has declined the past month, Large Specs have inched their positions higher, instead of their normal pattern of selling. This is bear-market behavior. Large Specs appear so sure that gold will continue to advance that they are buying into weakness. Remember, this group of traders usually makes their largest wrong-way bets at significant gold trend reversals. It’s compatible with what we’ve been saying here and in EWFF, with respect to gold’s prospects.
Now gold is testing Lara’s 1,310.84 invalidation/confirmation point for 4 charts.
pmbull day low 1309.59 at 3:28 pm in play since July 21st
Gold is hitting bottom trend lines in pmbull multiple small time frames.
I think it is most likely that minute iv is continuing sideways. This wave down to a new low today is most likely minuette (b).
Minute ii lasted 6 days. It would be possible but less likely for minute iv to be over in one day. It would be more likely for minute iv to take a few days (maybe a Fibonacci three or five?) so that the proportions between these two corrections look right on the daily chart.
So far minuette (b) is 1.34 X the length of minuette (a). It’s still within normal range of 1 to 1.38.
Minuete iv may be an expanded flat (very common structures) or a running triangle. Or a combination.
I made a mistake by holding NUGT option since mid august with expiration mid october. Is anyone has an Idea who trade NUGT if we can make it back by the end of september. Based on Tim Wood there another lows on gold form end of september all a way through october down to 1200 Thanks
GDX just invalidated the main count. I think GDX is close to completing the A wave of a 3 wave corrective structure down. NUGT may get up to 26-28 or so as GDX moves up for a B wave, then GDX/NUGT go lower to finish the correction. Just my 2 cents. The GDX channel breach warned of a significant correction. Good luck.
Hello Dreamer,
It would be so helpful to see your charts.
Thank you so much!
Thanks a lot Dreamer!
Hi Slava,
I’m not quite understanding your email. I am very familiar w/Tim Wood. Are you telling us that Tim is suggesting the following:
1. Gold should come into a final Season cycle low to create a ‘9yr. cycle low’ in gold sometime Late Sept OR Late Oct. (sounds like he’s Not sure whether it’s going to be end Sep OR end Oct??), 2016 at about the 1200 level, then gold should recover from that level?
2. Did Tim actually quote the level of about 1200?
Thank you…Melanie
Hi Melanie. This date has been in his letters for at list 3 months. I was honestly a sceptic after he a little missed his numbers on Brexit time. But who new. It was irregular event. Thats was a reason why I ignore his lows on gold in august and bought stupid options calls on NUGT. But it looks like its going his way to 1279. Now here is what the latest later (dated on august 28) says :
The timing band for the next intermediate-term cycle low runs between September 23rd and November 11th.
Do I missed something or don’t understand something? Please help.
If its so, than how far Gold can rebound for 20 days from current lows? and than drop to 1200? If his right, its not going to move anywhere , will just side trade for 20 days. I don’t think we are going to have any bearish news before elections and I don’t see the driver for gold to make another rally.
And its not a final lows. Sorry
Gold just dropped to a day low of Lucky # $1313.13 at 1:04 pm invalidating Lara’s bullish hourly alternate below 1315.42 and confirming Alan’s count below 1315.09.
I’ll be looking for Alan’s target of 1299 – 1301 to end this correction for intermediate wave (2).
Lara’s video mentioned – “A few more days of sideways movement before a final spike down.”
Could we be getting the final spike now a few days early?
No, I don’t think so. Minute ii lasted 6 days, I don’t think minute iv would be over in just one day.
I think this is wave B (or X) within minute iv.
From the pivot point perspective….
The reason I did not post earlier is that I suspected that Minute 4 was brief and ended at the high of 1325.56.
It does look like this scenario is becoming more and more real. The drop so far will then be minuette 1 of Minute 5. It would yield a target of 1298.92 calculated at Minor C level, and 1301 at Minute 5 level. This wave count is invalidated with a high above 1325.56 and confirmed with a low below 1315.09 (the low of Minute 3).
Alan
Your gold high of 1325.56 was at 8:14 pm and Lara finished this analysis at 9:16 pm and Lara’s main hourly chart shows minuette (a) as unfinished and she mentioned minuette (b) may even make a new low before minuette (c) moves up to finish minute iv.
pmbull shows Sunday 9 pm gold low was 1315.09 and shows today low at 1315.42.
I’ve made 3 profitable and quick trades in NUGT since the open and looking to make more, however your count showing minute 4 as over and gold in minute 5 heading for about 1298.92 has me concerned about any more NUGT trades today. Maybe I’ll stop while I’m ahead and recheck things, thank you.
Richard.
What you quoted from Lara makes sense.
There is still the possibility that with a new low below 1315.09 (currently at 1313.13, where minuette B is slightly more than 1.15 times minuette A), Minute 4 becomes an expanded flat. That leaves the option open for minuette C to end at 1327.60 (1.382 of A) or 1330.07 (1.618 of A).
No reason to expect the “entity” dumping a billion worth of Gold contracts into the futures market at a time since July will not revisit that theme. Someone is short an awfully large quantity of the metal. I was mistaken in assuming myself to be the only contrarian buying these spikes down ( the miners). What if the longs don’t capitulate and we go straight to a fifth wave blow-off top from here? To have any hope of dislodging the leveraged long positions the short-sellers absolutely have to take out the 1300.00 level.There is going to be an awful lot of pain for somebody if they cannot make that happen. I suspect even if they manage to temporarily achieve a sub 1300 print it will be quickly bought. My positions in the miners are long term trades so I am not too concerned about the near and mid-term price action. Apparently there may be others of the same mind. It is starting to look like there are enough folk buying the metal without leverage so as to make the typical smack-down tactics less effective. Very interesting situation.
Hey Verne
Thought this was an interesting article from the past (2001) for you
http://www.gold-eagle.com/article/lessons-london-gold-pool
Thanks for the link Marc. Market makers are expecting the miners to go higher. Covered calls against my long positions are getting filled at way better than the current bid- a dead give-away…
Only question is when? Now or December which some are suggesting for time of next rate increase after the election.
Interesting interview with only “expert” in 2015 who saw gold hitting $1370 thus far in 2016.
http://www.kitco.com/news/2016-08-30/Rate-Hikes-Could-Help-Gold-Just-Like-Last-Time-Martin-Murenbeeld.html
I’m looking to buy into Lara’s minuette wave (c) wave this morning for the move up to end minute wave iv. Minuette wave (b) may or may not make a new low first.
Likely 8:14PM high was Minuette (a) and at 8:52AM low was Minuette (b) and now in Minuette (c) towards 1326 under Primary Count? Any ideas?
Lara just a thought. You are mentioning the support zone lying between 1305-1310$ but dont you think that it should move upside a bit to 1310-315 as it was tested more than thrice now and was holded. Than what is the point of sticking to the support which was before this new support area ? Another thing that if 1310 is broken our EW count expects price to atleast test 1285 zone so in other words 1310 is the last support for alternate count. My point is to ask you is it not correct to call the support area in between 1310-1315 rather than 1305-1310
And please change my name to jimmy thers another james also here 🙂
Okay. I’ll look and think about this again. I suspect you’re right.
With 1,315 giving way today I’m going to stick with my original estimation of support at 1,310 and 1,305.
1,310 is pretty close to the low of 1,311.10 on 25th of July. And 1,310.70 low of 21st of July. and 1,308.20 of 28th of June.
Support is where price has repeatedly found support or resistance in the past, so looking left at the chart I see 1,310 and 1,305.
1,305 goes back further, to May 2014.
The point of sticking to support (and resistance) of prior areas is… that is likely going to be a congestion area for future. As far as I’m aware, that’s how you determine where future support and resistance will be.
Very interesting situation in the gold market. The big Gold smackdown we saw recently ( some think it was the Swiss banksters dumping the futures contracts) was supposed to dislodge the so called trend-followers and speculators AKA hedge funds. The fact is the so-called Commercials on the other side of the trade holding short positions have never been able to unwind those trades without help from the banksters. Guess what happened the last few weeks? Yep…the long increased their net long positions. The price decline we saw ordinarily would have seen far more long futures and options contracts being unwound. All the talk about how bearish the COT data has been the past few months would have implied that situation could not have become more extreme. Well it has, and if Gold stays above 1300.00 there are going to be some very nervous folk out there….and they should be! 🙂