
The main Elliott wave count has been confirmed with a new low below 1,310.84.
Summary: Some more downwards movement this week looks most likely, to about 1,279. If this target is wrong, it may be a little too low. A new high now above 1,330.01 would confirm downwards movement as over and a third wave up as just beginning.
New updates to this analysis are in bold.
Last weekly charts are here.
Grand SuperCycle analysis is here.
DAILY ELLIOTT WAVE COUNT
Click chart to enlarge.
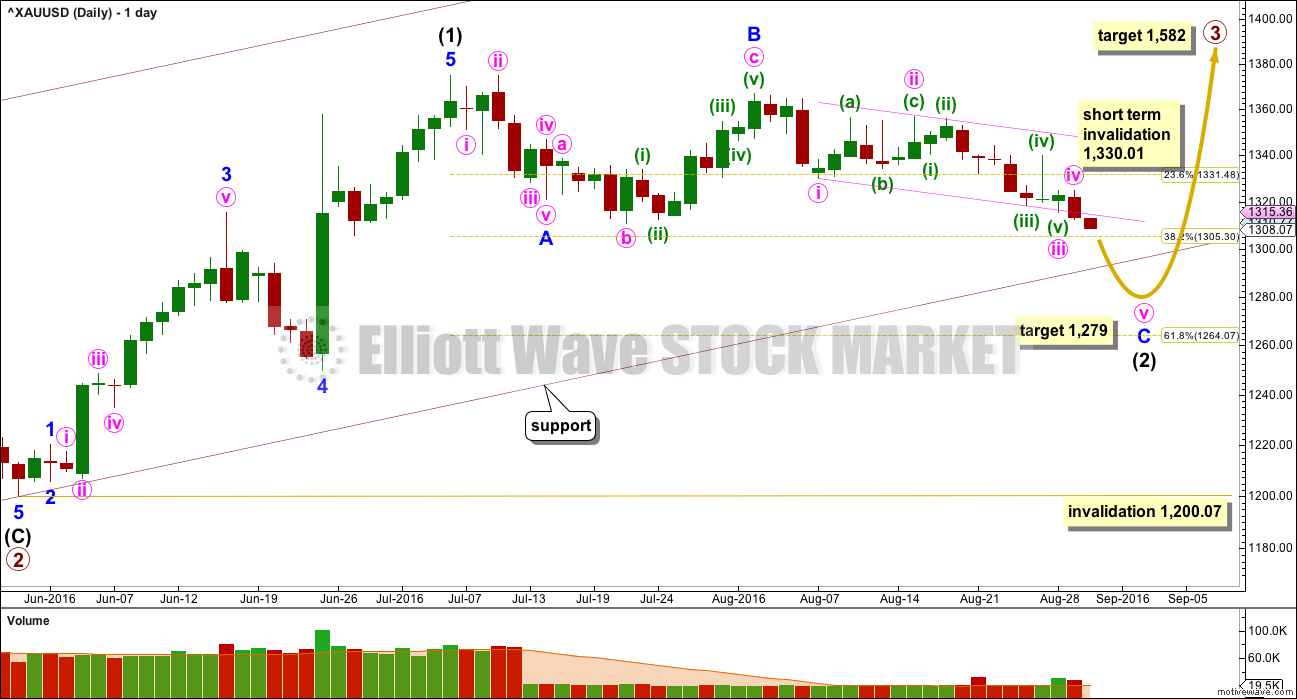
Primary waves 1 and 2 are complete. Thereafter, this wave count differs from the two alternates.
This main wave count will expect primary wave 3 to be longer than primary wave 1. Because this is very common, this is the main wave count and it expects the most common scenario is most likely. At 1,582 primary wave 3 would reach 1.618 the length of primary wave 1.
Only intermediate wave (1) so far is complete within primary wave 3. Intermediate wave (2) may be close to completion. It may find support at the lower edge of the base channel drawn about primary waves 1 and 2. Intermediate wave (2) may not move beyond the start of intermediate wave (1) below 1,200.07
Primary wave 3 may only subdivide as an impulse.
Minute wave iv may not move into minute wave i price territory above 1,330.01.
At 1,279 minor wave C would reach 1.618 the length of minor wave A. Price may end downwards movement when it finds support at the lower edge of the maroon base channel drawn about primary waves 1 and 2. Because this target at 1,279 would expect an overshoot of the lower edge of the base channel, the target may be too low. Support at the base channel may not allow price to move this low.
Intermediate wave (2) may not move beyond the start of intermediate wave (1) below 1,200.07.
Primary wave 2 lasted 56 days (one more than a Fibonacci 55). So far intermediate wave (2) is more brief in duration. It has lasted 39 days and may be just a few days away from completion.
Draw a small channel about minor wave C, using Elliott’s technique, and copy it over to the hourly chart.
At this stage, it is just possible to see a complete structure for minor wave C downwards. A new high above 1,330.01 at any stage short term could not be a continuation of minor wave C, so at that stage minor wave C would have to be over. A new high above 1,330.01 would tell us now that intermediate wave (2) should be over and intermediate wave (3) upwards should be underway.
HOURLY ELLIOTT WAVE COUNT
Click chart to enlarge.
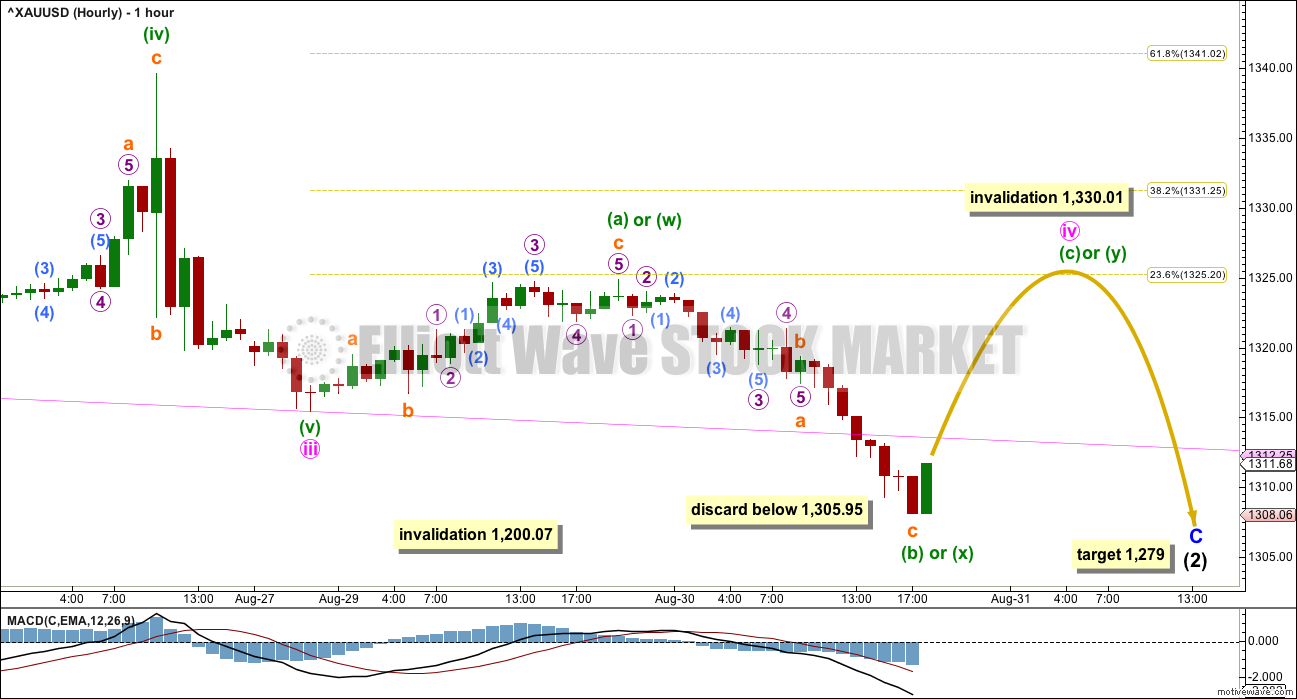
Minor wave C must subdivide as a five wave structure.
Minor wave C is unfolding as an impulse. The question today is whether or not minute wave iv within it is complete.
Minute wave ii was a deep 0.73 zigzag lasting six days. Given the guideline of alternation, minute wave iv would most likely be a very shallow sideways flat, combination or triangle. To have good proportion with minute wave ii, it is likely that minute wave iv will last at least three or four days, if not longer.
Within flats, combinations and triangles, the first wave subdivides as a three. This would now be a complete zigzag for minuette wave (a) or (w).
Within expanded flats and running triangles, minuette wave (b) may make a new price extreme beyond the start of minuette wave (a). The new low today may be part of minute wave iv. There is no maximum limit for X waves within combinations; they too may make new price extremes beyond the start of W waves.
If minute wave iv is a flat correction, then it would be an expanded flat. These are very common structures. The normal range for minuette wave (b) would be 1 to 1.38 the length of minuette wave (a), at 1,315.42 to 1,311.82. Minuette wave (b) is now longer than the common length. There is no rule stating a maximum limit for B waves within flat corrections, but there is an Elliott wave convention which states that when the potential B wave is longer than twice the length of the potential A wave the idea of a flat correction should be discarded based upon extremely low probability. That price point here would be below 1,305.95.
So far minuette wave (b) should be complete and is 1.78 the length of minuette wave (a).
If minute wave iv is unfolding as an expanded flat, then a target for minuette wave (c) would be just below the invalidation point at 1,330. Minuette wave (c) would be close to 2.618 the length of minuette wave (a). Minuette wave (c) would be extremely likely to make at least a slight new high above the end of minuette wave (a) at 1,324.89 to avoid a truncation and a very rare running flat.
If minute wave iv is unfolding as a triangle, then minuette wave (c) may not move beyond the end of minuette wave (a) above 1,324.89. A triangle would be invalid above this point. Thereafter, price should move sideways in an ever decreasing range for another few days for a triangle to be complete. MACD should hover about zero. At this stage, a triangle does not look likely because MACD has moved too far below zero.
If minute wave iv is unfolding as a combination, then within it the first structure labelled minuette wave (w) would be a complete zigzag. The zigzag would be joined by a three in the opposite direction, a zigzag labelled minuette wave (x), which should now be over. The second structure in the double would very likely be a flat correction but may also be a triangle. It should end about the same level as minuette wave (w) at 1,324.85, so that the whole structure moves sideways. Minuette wave (y) should last about two or three days.
Minute wave iv may not move into minute wave i price territory above 1,330.01.
ALTERNATE HOURLY ELLIOTT WAVE COUNT
Click chart to enlarge.
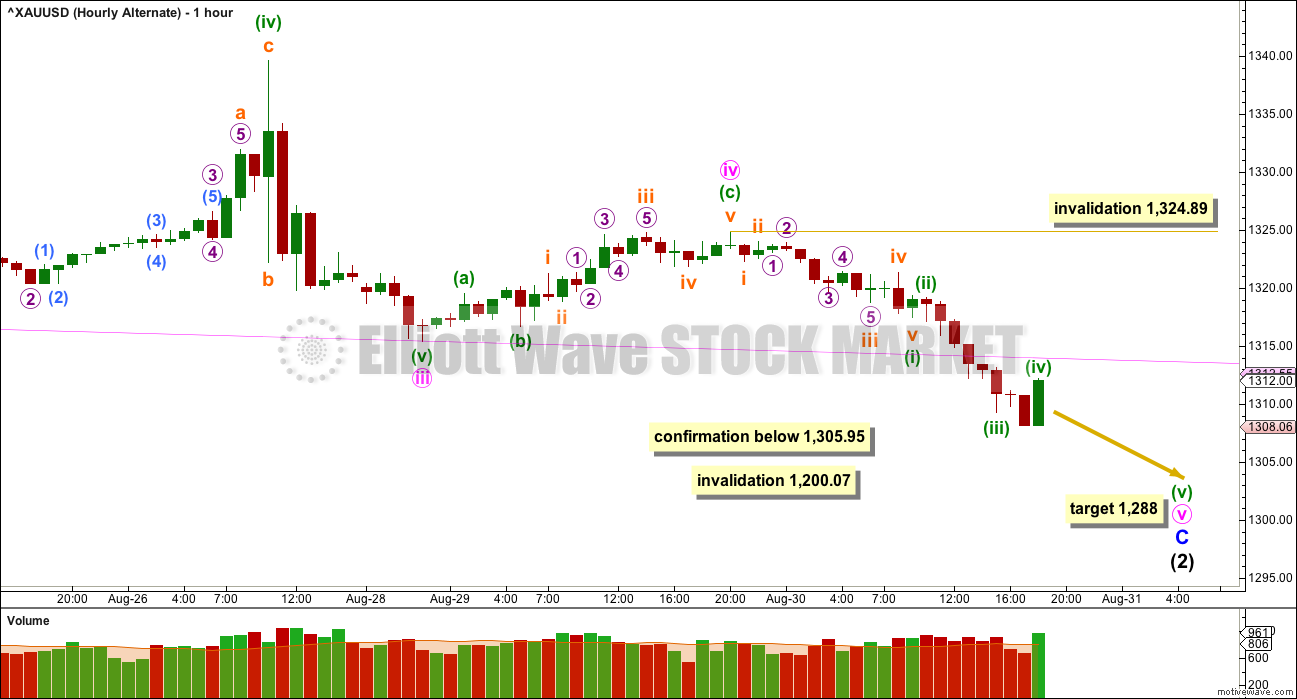
It is possible that minute wave iv is over as a brief and very shallow zigzag. Minute wave iv would exhibit little alternation with minute wave ii: they would both be zigzags. There would be some alternation in depth: minute wave ii was deep and minute wave iv was shallow. There would be a little alternation within the structure: minute wave ii had a long complicated B wave and minute wave iv had a brief B wave.
Minute wave ii lasted six days. If minute wave iv is over already, it would have lasted only one day. The proportions at the daily chart level do not look very good, but sometimes Gold does exhibit fourth waves which are more brief and shallow than its second waves. This tendency normally shows up in a third wave though and not so often in a C wave.
If minute wave iv is over, then at 1,288 minute wave v would reach equality in length with minute wave i. This would see the base channel on the daily chart only very slightly overshot.
Within minute wave v, no second wave correction may move beyond the start of its first wave above 1,324.89.
Due to the lack of alternation and the poor proportions between minute waves iv and ii, this wave count is possible but has a low probability. It should only be used if price makes a new low short term below 1,305.95.
ALTERNATE DAILY ELLIOTT WAVE COUNT
Click chart to enlarge.
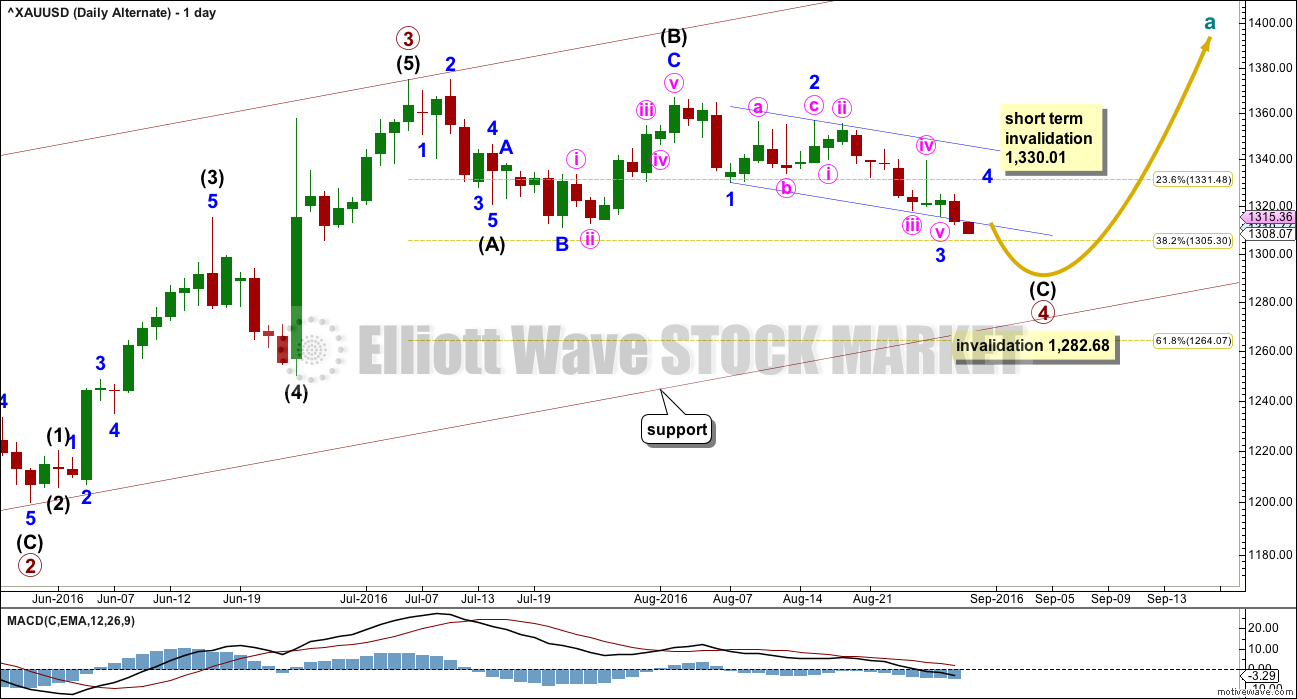
It is possible that primary wave 3 is over and shorter than primary wave 1. Primary wave 3 shows stronger volume than primary wave 1 (see technical analysis weekly chart).
If primary wave 3 is over, then the current consolidation for Gold would be primary wave 4.
Primary wave 2 was a relatively shallow 0.35 expanded flat correction. Primary wave 4 may be unfolding as a deeper zigzag which would exhibit perfect alternation.
Primary wave 4 may not move into primary wave 1 price territory below 1,282.68.
Primary wave 5 would be limited to no longer than equality in length with primary wave 3, so that the core Elliott wave rule stating a third wave may not be the shortest is met. Primary wave 5 would have a limit of 174.84.
This wave count expects more downwards movement to complete a five wave impulse for intermediate wave (C) in the same way as the main wave count expects a five wave impulse down to complete minor wave C. Only the degree of labelling differs; this wave count is one degree higher.
The hourly chart would be exactly the same except for the degree of labelling.
It is also possible that primary wave 4 may be a regular contracting triangle. If sideways movement continues in an ever decreasing range, then that idea would be published. At this stage, a zigzag looks more likely because the subdivisions have a slightly better fit.
TECHNICAL ANALYSIS
WEEKLY CHART
Click chart to enlarge.
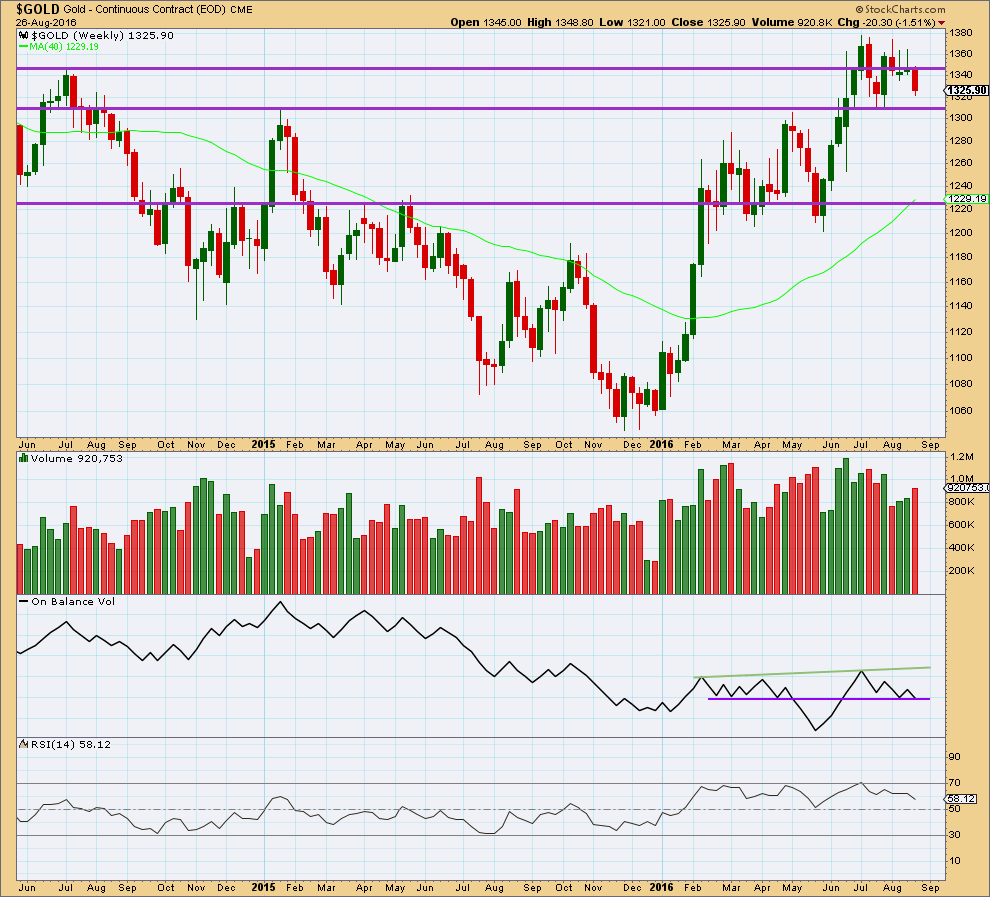
A strong downwards week with an increase in volume supports the main and alternate III wave counts. Overall, volume is still declining and price remains range bound.
The prior two green weekly candlesticks had long upper shadows which was bearish.
Price may find some support about 1,310.
On Balance Volume at the end of last week has come down to find support at the purple trend line. This may help to stop price falling much further.
RSI is not extreme. There is some hidden bullish divergence with price and RSI: RSI has made a lower low below the low of 25th of July but price has made a higher low. This indicates some weakness to this downwards movement. It is more likely to be a smaller correction than a sustainable trend.
DAILY CHART
Click chart to enlarge.
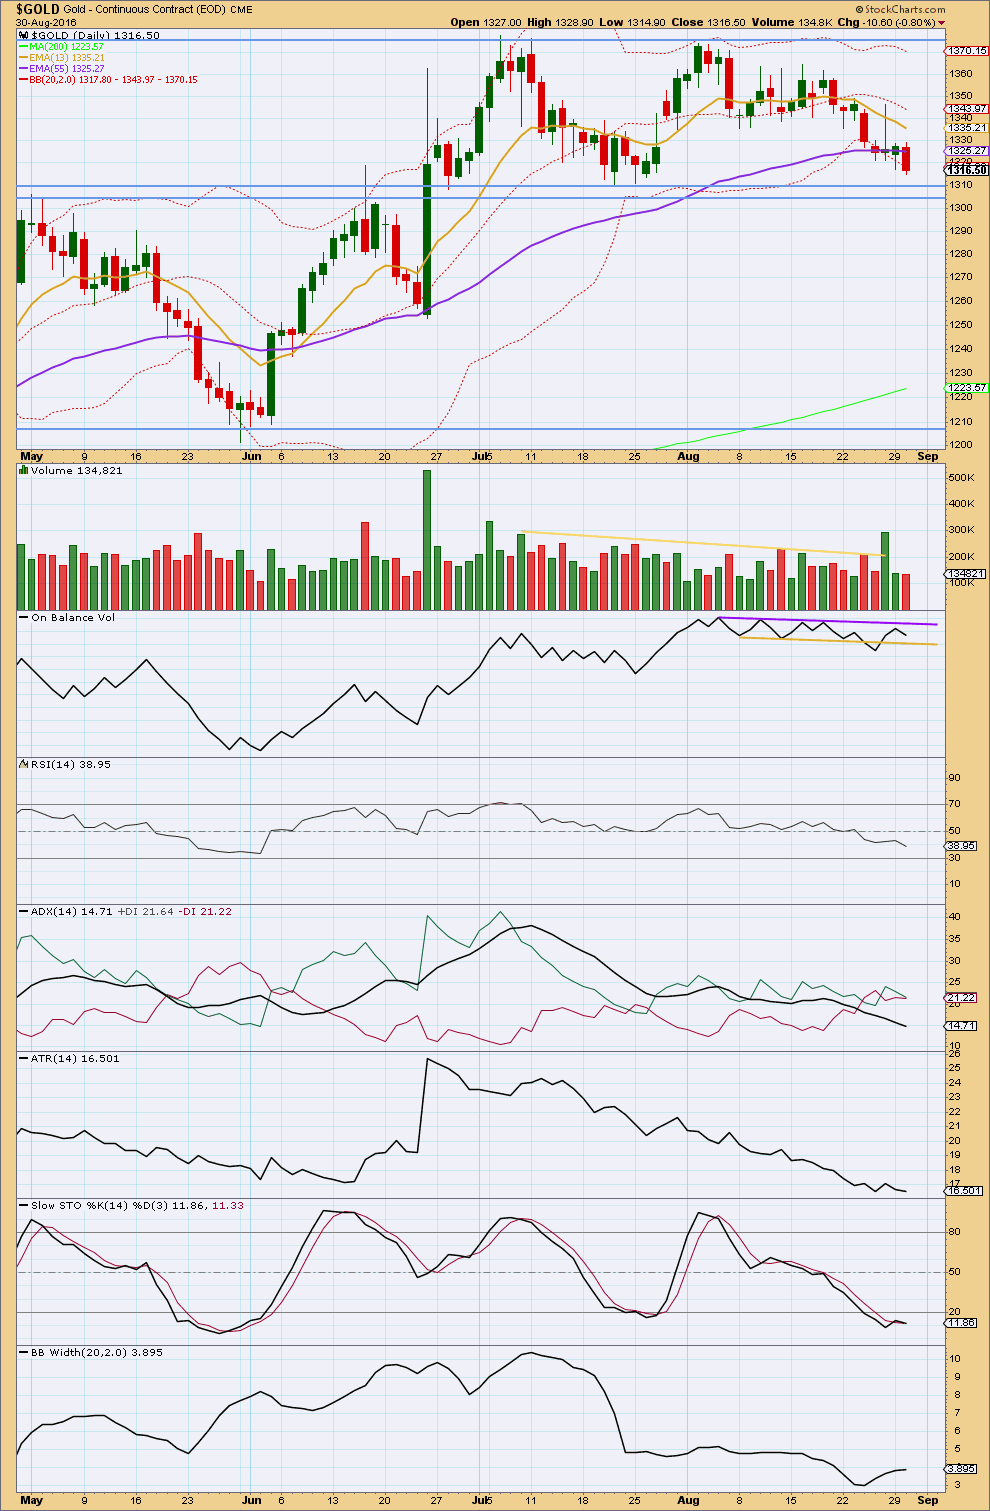
Overall, price remains range bound with resistance about 1,375 and support about 1,310 – 1,305. This range bound period began back on 7th of July. During this range bound period, it is the two upwards days of 8th of July and 26th of August which have strongest volume suggesting an upwards breakout is more likely than downwards. This supports all three Elliott wave counts.
Yesterday saw an upwards day with lighter volume; the rise in price was not supported by volume. Now a strong downwards day comes with a slight further decline in volume. A decline in volume is typical of a consolidating market, and volume should be expected to decline further towards the end of the consolidation. In the short term, this decline in volume suggests some upwards reaction about here, so this supports the main hourly Elliott wave count over the alternate hourly count.
The 55 day moving average has not provided support.
On Balance Volume has moved down and away from the purple line which is now strengthened and is providing resistance. OBV may find some support at the yellow line, but this line has been weakened recently with a breach.
Price should find support in the area of 1,310 to 1,305.
RSI is not extreme. There is room for price to rise or fall. There is no divergence today between price and RSI to indicate weakness.
ADX continues to decline and the +DX and -DX lines are whipsawing about each other. ADX indicates this market is not trending. ATR agrees as it too continues overall to decline.
Stochastics is oversold. Price has not yet reached support at 1,310 though, so a little more downwards movement from price may be expected before this downwards swing is over. There is some small day to day divergence between Stochastics and price: price today made a slight new low but Stochastics did not. This indicates weakness in price. Price may not be able to get down to touch support. This divergence suggests that downwards movement may be over for this swing.
Bollinger Bands are widening now for four days in a row. A trend may be beginning to return. If it is, then it would be down. However, this contradicts ADX and ATR.
This analysis is published @ 07:30 p.m. EST.
[Note: Analysis is public today for promotional purposes. Member comments and discussion will remain private.]
Minute iv was over. Minute v is underway.
Only one hourly wave count so far. The main hourly from this analysis is discarded due to an exceptionally low probability, the alternate is now the only hourly wave count.
so far it looks like a further decline in volume today as price moves lower. I’m expecting strong support here about 1,305.
Minute wave v is incomplete. I’ll be expecting more downwards movement for at least one more day, maybe two or three, to 1,288.
Positive US ADP payroll figures dropped gold by $10 at 8:15 am this morning.
Friday morning there is even more important US non-farm payroll news
Gold is currently about $2 below gold 4:00 pm close Tuesday.
Could the gold support zone around 1,305 have kept gold above the important 1300 threshold today and maybe again on Friday.
Or will the 8:50 am confirmation of Lara’s Hourly alternate bearish chart with a target of $1,288 doom gold to drop even further to a new multi month low and miners beaten down even worse even though Lara’s GDX analysis last night looks bullish?
Friday FRIDAY, SEPT. 2
8:30 am Nonfarm payrolls Aug.
Gold futures fall, set for first monthly decline since May
Aug 31, 2016 10:47 a.m. ET
Gold trades at 2-month lows after upbeat private-sector jobs data
http://www.marketwatch.com/story/gold-holds-at-two-month-lows-ahead-of-job-market-snapshot-2016-08-31
Discard & Confirmation Lara’s chart at today’s Gold Low 1,305.32
Discard below 1,305.95 Hourly main
Confirmed below 1,305.95 Hourly Alternate
According to Lara’s data feed Barchart
Forex Quote as of Wed, Aug 31st, 2016
Low today at 8:50 am is Low 1,305.32
http://www.barchart.com/quotes/forex/%5EXAUUSD
As per:
Dreamer August 26, 2016 at 5:59 pm
Okay, this is the correct data feed to follow along daily with Lara’s validation and invalidation points. You can click on the chart to enlarge.
http://www.barchart.com/quotes/forex/%5EXAUUSD
Gold dropped on positive jobs news at 8:15 am today
Private sector adds 177,000 jobs in August: ADP
http://www.marketwatch.com/story/gold-holds-at-two-month-lows-ahead-of-job-market-snapshot-2016-08-31
NUGT dropped 50% from the high of $36.47 the morning of Friday August 12th to today’s low of $18.17.
Lara your video and written analysis are truly a Masterpiece of Analysis. You cover a very wide range of possibilities and indicators. When newcomers see your written and video presentation compared to the competitor it must be a very pleasant surprise to them just how detailed you get.
Since not everyone believes in Elliott Wave, I guess that your whole package would help persuade them to subscribe. We are lucky to have your very professional services. Thanks a lot for this week’s 4 extra video bonuses.
Thank you very much Richard, and you’re very welcome 🙂
I am hoping that a week’s worth of analysis and video boosts the membership nicely.
Doing GDX for members now. Silver tomorrow.
Thx, can’t wait for yr GDX analysis….:)
Food for thought. I think it’s helpful….. 🙂
Lara also gives some good trading advice on handling RISK.
Crikey. Not sure about the example of marrying someone and not being a drug addict… I get the point but…
Anyway…
My Two Golden Risk Management Rules:
1. Always use a stop loss. For every trade, every time.
2. Never invest more than 3-5% of equity on any one trade.
I never break these rules. This way you can have 10 losses in a row and still have enough equity left to keep going.
Worst case scenarios need to always be considered as possibilities.
Agree, Lara. That example was little bit extreme….lol
🙂
The main daily GDX count was invalidated today with a move below 26.17
The Alternate daily count is now the main count. I don’t think the bull market in gold and GDX is over; however this is looking to possibly be “the midpoint” of the move up and is likely to become the largest correction YTD in GDX
It looks like GDX is close to completing a 5 wave structure down. This means that the correction is not over, although a significant bounce is expected very soon. I think the 5th wave of this move down is extending. If correct, we need a small 4th wave up and then a new low to complete Primary wave A down. I suspect that by Friday (or sooner), we will be starting Primary wave B up which will back test the channel breach.
Thanks for your work and diligence. The recent GDX invalidation would now mesh better with alternative daily gold count as well.
I have a new idea, working on GDX analysis now Dreamer.
Thank you very much for your updated chart 🙂
GDX had another strong down day today; however, volume was lower, suggesting that the selling is getting weaker.
RSI is now oversold; however there is no divergence with price yet
Stochastics is oversold and is showing some divergence with price; however, we need to see stochastics move above 20 for a buy signal
OBV continues to show weakness which supports the move down in price
There is a lot of support in the 25 – 26 price range. I suspect that we are very close to a meaningful bounce up in price
Thanks, Dreamer!
Thank you Dreamer. Outstanding work and thank you for sharing
I agree, I noticed the divergence with Stochastics too.
Yes, it looks like we’ll see a bounce up in both Gold and GDX pretty soon…. let’s see how high that’s going to go.