
Upwards movement was expected, but a warning was given due to some bearishness in volume.
Summary: The trend is up. The target remains at 1,582. Corrections are an opportunity to join the trend. Invest no more than 3-5% of equity on any one trade and always use a stop loss on all trades. In the short term, a correction is unfolding against the trend and may end within the next 24 hours at about either 1,346 (more likely) or 1,333.
New updates to this analysis are in bold.
Grand SuperCycle analysis is here.
Last weekly chart is here.
DAILY ELLIOTT WAVE COUNT
Click chart to enlarge.
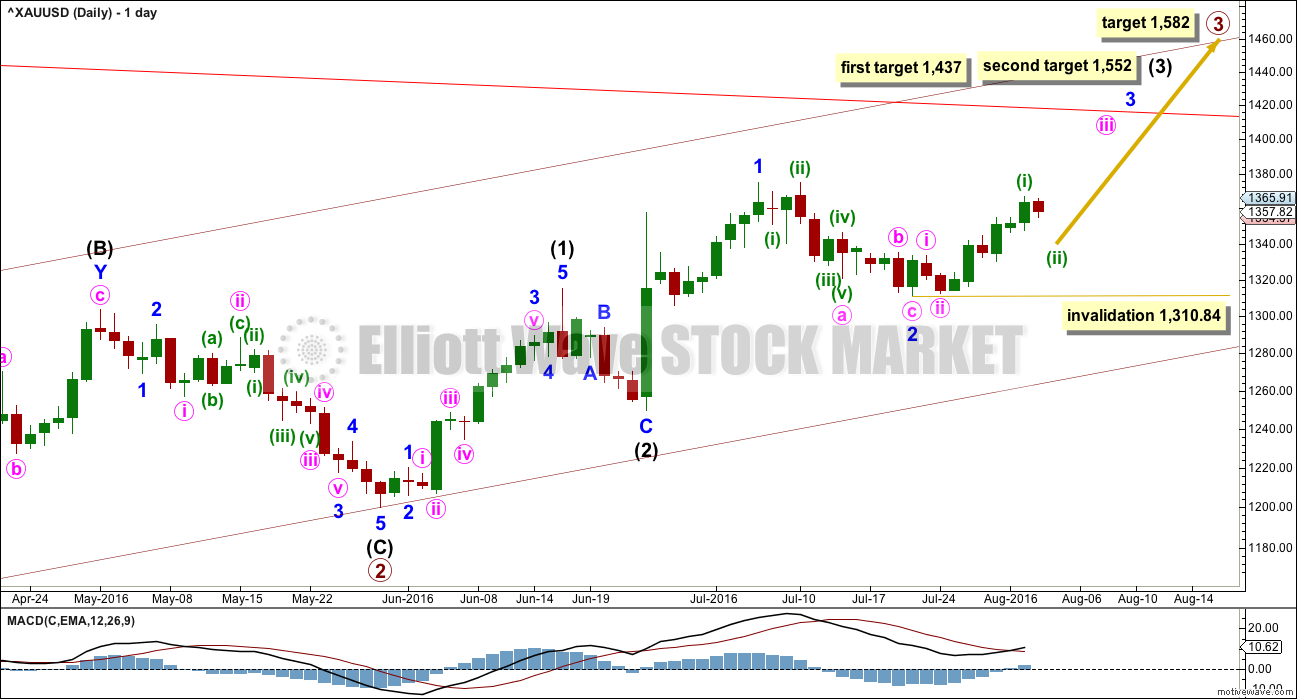
Primary wave 2 is a complete expanded flat correction. Price from the low labelled primary wave 2 has now moved too far upwards to be reasonably considered a continuation of primary wave 2. Primary wave 3 is very likely to have begun and would reach 1.618 the length of primary wave 1 at 1,582.
Primary wave 3 may only subdivide as an impulse.
So far intermediate waves (1) and (2) may be complete within primary wave 3. The middle of primary wave 3 may have begun and may also only subdivide as an impulse.
Within intermediate wave (3), the end of minor wave 1 is moved up to the last high. This fits on the hourly chart although it looks odd here on the daily chart. There was a small fourth wave correction up at the end of minor wave 1 and it subdivides on the hourly chart as an impulse. Minor wave 2 may be a complete zigzag, also subdividing as a zigzag on the hourly chart. If minor wave 2 is over, it would be 0.50 the depth of minute wave i.
No second wave correction may move beyond the start of its first wave below 1,310.84 within minor wave 3.
At 1,437 intermediate wave (3) would reach 1.618 the length of intermediate wave (1). If price keeps going upwards through this first target, or if it gets there and the structure is incomplete, then the next target would be at 1,552 where intermediate wave (3) would reach 2.618 the length of intermediate wave (1).
HOURLY ELLIOTT WAVE COUNT
Click chart to enlarge.
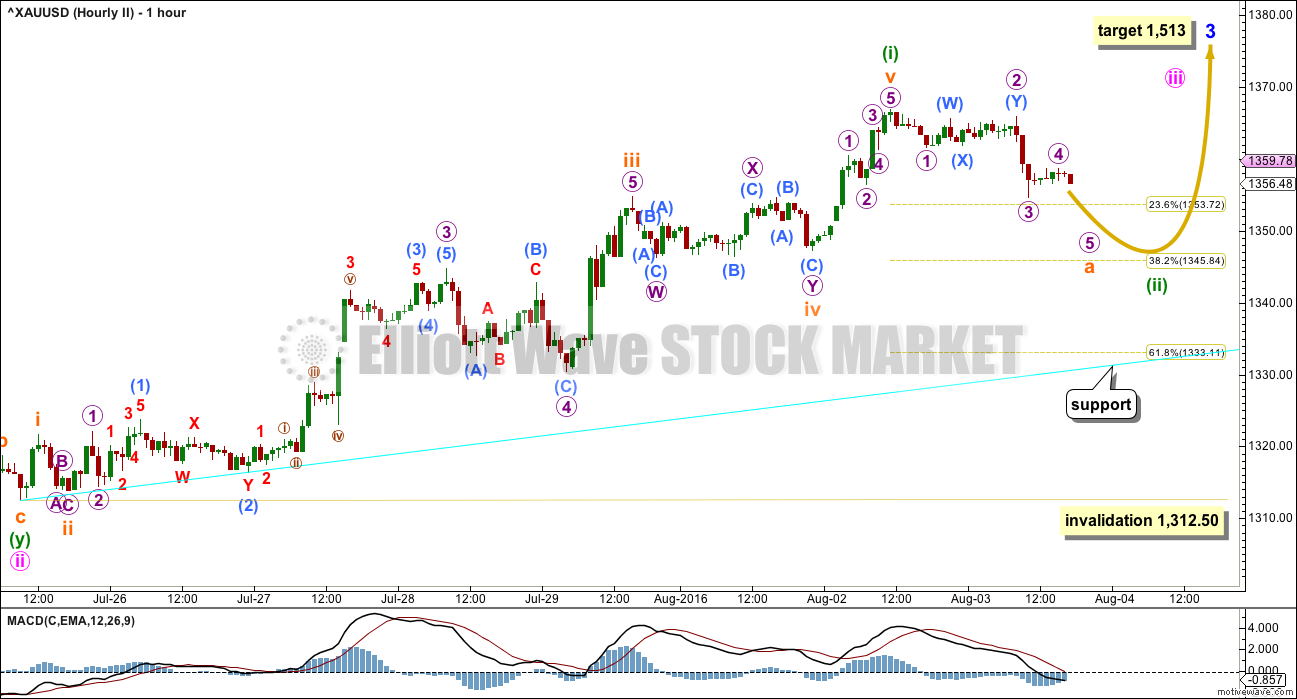
The wave count is changed today to see only three first and second waves complete: intermediate waves (1) and (2), minor waves 1 and 2, and minute waves i and ii. All are shown on the daily chart.
Now only minuette wave (i) is complete within minute wave iii. Downwards movement for Wednesday’s session looks like the start of minuette wave (ii).
Minute wave ii lasted 41 hours. Minuette wave (ii) one degree lower is likely to be of a shorter duration. So far it has lasted about 30 hours. This correction is likely to be complete within the next 24 hours, before the next analysis is published.
Minuette wave (ii) is most likely to subdivide as a zigzag. So far it looks like subminuette wave a is an almost complete impulse. When subminuette wave a is complete, then a correction up for subminuette wave b may not move beyond the start of subminuette wave a at 1,366.95 if minuette wave (ii) is indeed unfolding as a zigzag.
When subminuette waves a and b are complete, then a final five down for subminuette wave c should unfold.
Because this is a lower degree second wave correction within a big third wave up, it may be more shallow than second waves normally are due to a strong upwards pull from the middle of primary wave 3. Minuette wave (ii) may be more likely to end about the 0.382 Fibonacci ratio at 1,346. This would expect subminuette wave c to be shorter than subminuette wave a.
It is still reasonably likely that minuette wave (ii) could end about the 0.618 Fibonacci ratio at 1,333.
Minuette wave (ii) may not move beyond the start of minuette wave (i) at 1,312.50.
The lower cyan trend line may offer support. If this line is touched, expect price to bounce up from there. If that happens, it would offer a very good entry point for long positions.
When minuette wave (ii) is complete, then upwards movement should resume and should show an increase in momentum.
TECHNICAL ANALYSIS
WEEKLY CHART
Click chart to enlarge.
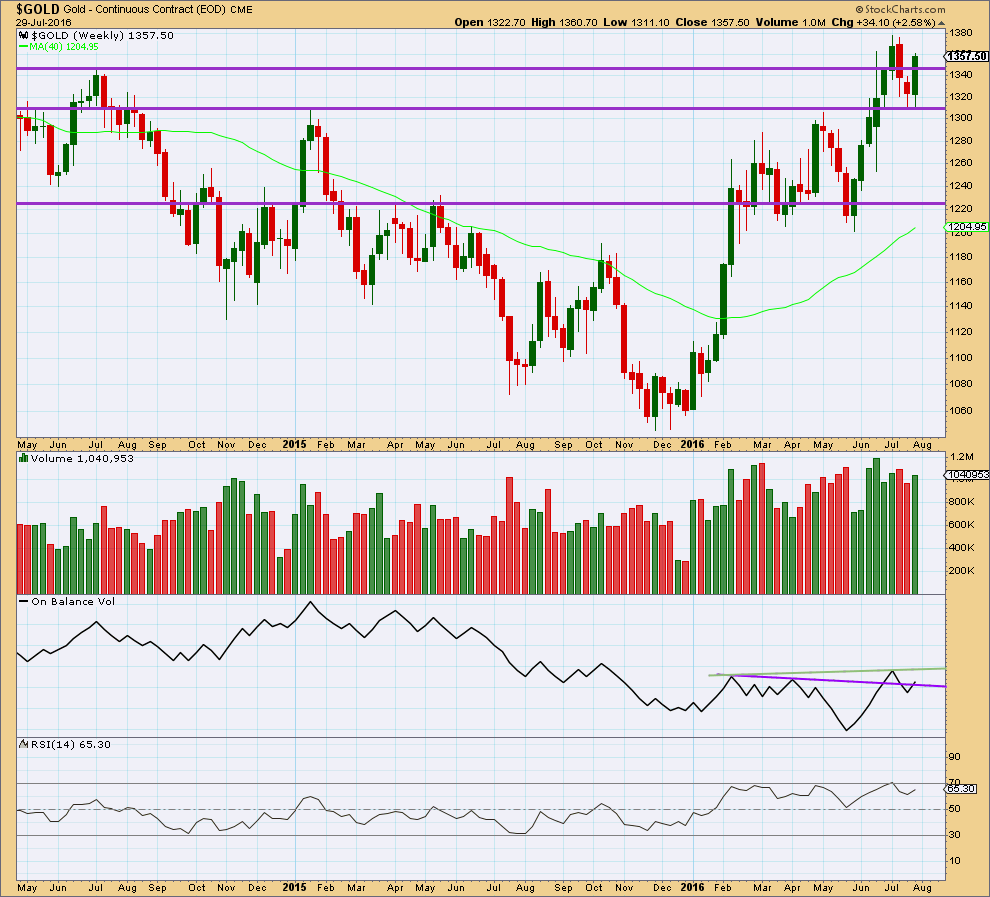
Last week completes a bullish engulfing weekly candlestick that has stronger volume than the week before. After a short downwards movement, this is a reversal pattern from down to up or down to sideways.
Price broke above resistance last week about 1,345 and closed above this line. Next resistance would be about the last high about 1,380.
On Balance Volume is giving a bullish signal at the end of last week with a break above the purple trend line. The next line to offer resistance for OBV is the new green line.
RSI is not extreme yet. There is room for price to rise further.
Overall, the weekly volume profile is bullish. Volume increases as price rises and volume declines as price falls. There is no indication yet of an end to this upwards trend at the weekly chart level.
DAILY CHART
Click chart to enlarge.
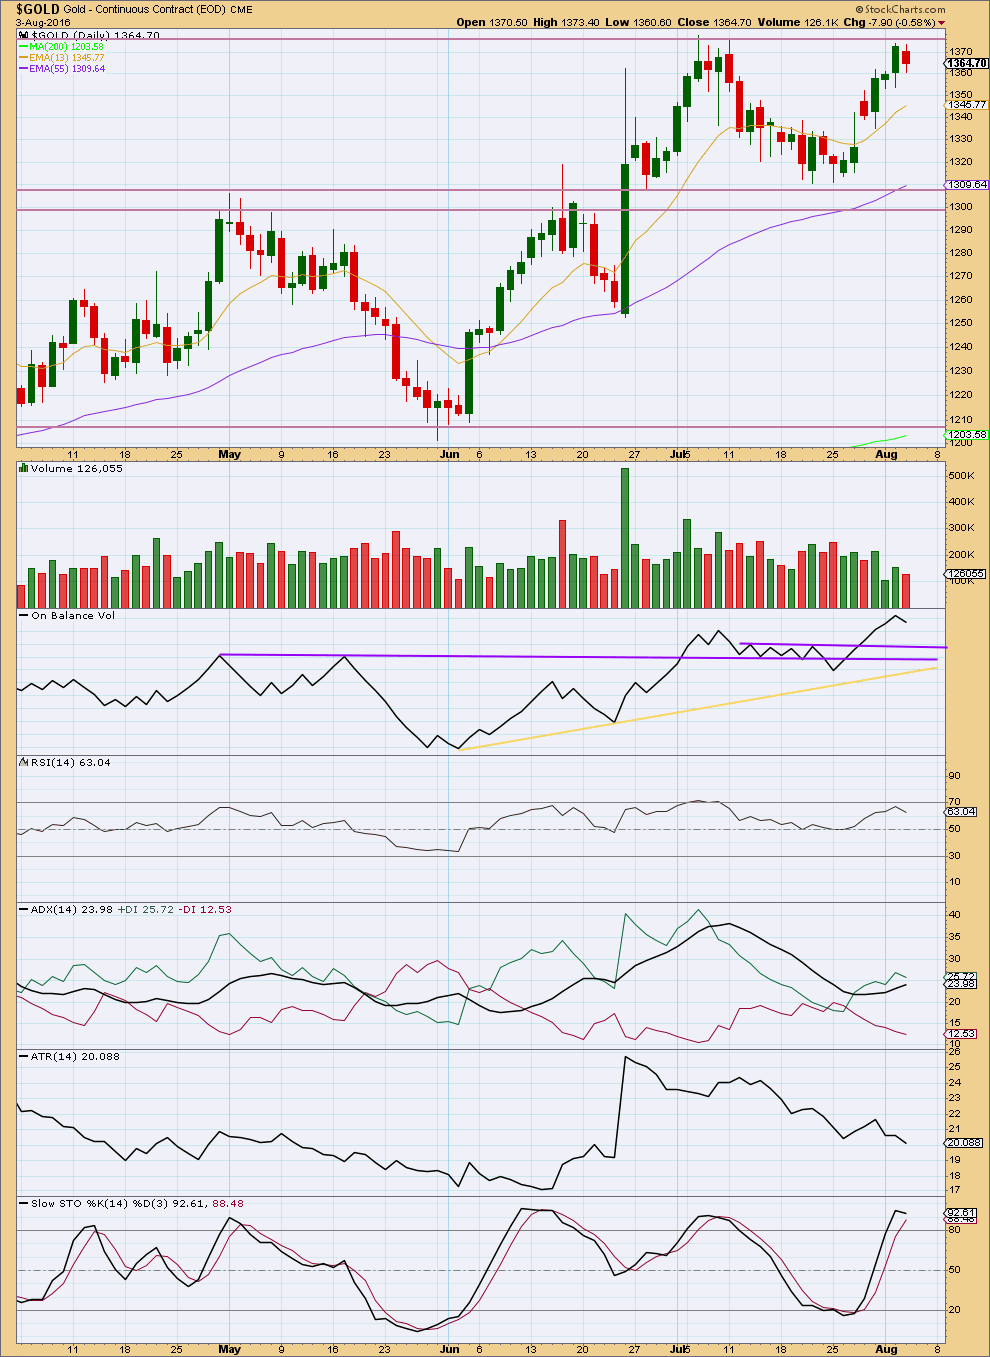
A smaller range downwards day with a decrease in volume looks corrective. Price is finding some resistance at the horizontal line about 1,375.
In the short term, the volume profile is still more bullish than bearish. The last two downwards days show clearly lighter volume and should be expected to be counter trend movements.
Overall, volume has been declining as price has been rising since 25th of July. This is concerning for the Elliott wave count. However, sometimes early on in Gold’s trends this happens. This happened up to the 25th of December, 2015, yet Gold did not make a new low and began a long sustained upwards wave from there. From 29th of January, 2016, to 2nd of February, 2016, price rose on light and declining volume but was followed by a sustained rise that was then supported by volume.
It may be at this stage that resistance is holding price down and forcing some weakness. Another day or so of downwards movement may be required to resolved this bearishness short term.
Caution is still advised with the wave count due to weak volume. A deeper and more sustained pullback may unfold here than the Elliott wave count expects.
On Balance Volume exhibits hidden bearish divergence at the last high: OBV made a new high but price did not. This indicates weakness in price. However, divergence from OBV is not as reliable as trend lines for OBV. The break above both purple trend lines is a bullish signal.
RSI is not extreme. There is plenty of room for price to rise or fall.
ADX is increasing, indicating an upwards trend is in place.
ATR still disagrees as it is declining.
Stochastics is overbought, but this oscillator may remain extreme for reasonable periods of time during a trending market.
This analysis is published @ 06:47 p.m. EST.
This is my first impression.
Subminuette wave a down looks like a five wave structure. Which means, if that is correct, the correction cannot be over there and subminuette wave b may not move beyond its start.
At 1,347 subminuette c = subminuette a, at 1,346 minuette (ii) would be at the 0.382 Fibonacci ratio of minuette (i). So this is a reasonable target.
If I’m wrong it may be in seeing subminuette a as a five. It could be seen as a three and the correction could be over there.
Hi Lara,
Tough question for you, but do you think this is going to be one of those swift downturns followed by a quick bounce. Many times, after news breaks (wage report at 8:30 ET), gold reacts both ways… up and down.
I realize that you don’t track reports, but tomorrow’s report is critical. Should the report be favorable, September rate hikes are back on the table and down goes gold. If average or poor, gold will perform.
Thank you!
That’s entirely possible, and it would actually make the proportions look really good.
It could whipsaw down then reverse immediately upwards.
Let me join in the speculation.
I’m not exactly sure but the possibilities I see are:
(1) Subminuette A ended at the low of 1349.19. The movement following appears to be in 5 waves, the fourth being underway, looking suspiciously like a triangle. B waves must be in 3 waves, which can only mean that this is only micro a of Subminuette B. Subminuette B will end up higher than the high of 1367.37, resulting in an expanded flat situation. This indicates that Subminuette C will be very deep. (If only the price movement this morning is not in a sideways manner, it would have been crystal clear).
(2) A slight variation of (1) above has micro a ended at today’s high of 1365.10; I can force a 5-wave count to it. The sideways movement will be micro b.
(3) Minuette 2 had ended at the low of 1349.19. If you look at Lara’s hourly chart, Subminuette A is where she named micro 1, and Subminuette B is where she had named micro 2. The subsequent 5 waves down constitutes Subminuette C. I know this is an unpopular option; many posters in TradingView agree with Lara’s count.
In this case, Minuette 3 has begun with Subminuette 1 underway.
I’m afraid we’ll have to wait till the end of today’s trading session in order to have more clarity, hopefully. Meanwhile, with so many questions left unanswered, I’m not going to put in a trade. I’m off to bed.
Thanks Alan.
Do you dream of waves like Lara? LOL
Ha ha. I don’t.
haha… that’s funny. 🙂
Richard why cant wave b go beyond the high of 1366.95.if im correct it might also be a expanded flat.This correction is taking long or yes it might be over as it was mentioned in this analysis it may end before next analysis.But wave c is missng i guess.. 🙂
If a wave is a 5 wave structure, b cannot go above beginning of a.
I don’t have an exact EW count and don’t have the answers to your questions.
See Lara’s comment at 1:38 am.
All corrections seem long however we are still within the 24 hours.
I wouldn’t consider it over until possibly above 1366.95?
Does it look to you like a zig zag up from the morning low?
Subminuette wave c may not be missing.
Is it possible gold may be in wave c since the morning high of 1365.10 at 8:48 am?
Perhaps we just wait for price to lead the way or for an EW count or Lara’s next comment.
Ok n thanx for reply
Why a brewing global economic storm is turning gold into the perfect trade
Aug 4, 2016 11:09 a.m. ET
http://www.marketwatch.com/story/why-a-brewing-global-economic-storm-is-turning-gold-into-the-perfect-trade-2016-08-04
Even with a gain of nearly 30% this year, the current rally in gold will probably break its cycle high of $1,924 an ounce reached back in September 2011, said the blog.
Another likely option is the low at 3:10AM was the low for a subminuette iv and now in subminuette v of minuette(i) for completion? Confirmation over 8-2 high of 1366.95.
Morning high 1365.10 at 8:48 am not above max 1366.95 so should still drop to likely 1,345.84 less likely 1,333.11.
“When subminuette wave a is complete, then a correction up for subminuette wave b may not move beyond the start of subminuette wave a at 1,366.95 if minuette wave (ii) is indeed unfolding as a zigzag.
When subminuette waves a and b are complete, then a final five down for subminuette wave c should unfold.”
With BOE action announced this morning combined with US economic news not being favorable, gold shot up. Your note mentions “If” we’re in a zig zag. Do you think we’re in a zig zag? I can’t help but think that it would be difficult for gold to give up all of it’s morning gains and then some? Is it possible that the drop to $1,345 may be forecasting a solid jobs release scheduled for tomorrow at 8:30?
This is my opinion at this time.
Unless gold goes above Lara’s subminuette b maximum of 1,366.95 I will follow Lara’s analysis.
I can see a zig zag up from the morning low.
It still may drop after the morning gains.
I think tomorrow’s news at 8:30 am is too far away, however we will see.
Gold at 9:56 at 1364.65 may have ended a 2nd wave up from morning high of 1365.10 at 8:48 am.
“Minute wave ii lasted 41 hours. Minuette wave (ii) one degree lower is likely to be of a shorter duration. So far it has lasted about 30 hours. This correction (minuette wave II) is likely to be complete within the next 24 hours, before the next analysis is published.”
Lara: In past reports you had stated that cycle wave a will bottom in fib 55 months.
From Sept 2011high to low in Dec 2015 gold was indeed 51 month close enough for 55 months.
Is that correct?
What is the next fib for cycle wave b high 89 months form Sept 2011???
51 is a bit far off to be of practical use to a Fibonacci 55, but yeah, somewhat close.
Yes, the next Fibonacci ratio in the sequence is 89. I would expect a B wave to most likely be more time consuming than an A wave. That’s pretty common.
What effect might this have on Gold? News at 7 am EST.
Expect the Bank of England to cut rates on ‘Super Thursday’ — here’s why.
The BOE rate decision, minutes and inflation report at due at noon London time, or 7 a.m. Eastern Time, on Thursday, followed by Carney’s press conference at 12:30 p.m. local time.
http://www.marketwatch.com/story/traders-bet-bank-of-england-will-deliver-super-thursday-stimulus-2016-08-01
I think that micro 4 was not over when Lara did the chart and may have only ended up at 9:40 pm EST at 1,359.27.
Then started down in micro 5 to end subminuette wave a.
Then up in a 3 wave in subminuette wave b to a maximum of 1,366.95.
Then down in subminette wave c more likely 1,345.84 less likely 1,333.11.
Or else bounce up at the lower cyan trend line.
Exactly 🙂
Thanks Lara, I really checked out your hourly chart and gold since then to figure it out. Thanks for your excellent analysis which makes everything clearer.
Anybody else think the C wave down might be underway?
No I think that subminuette C hasn’t started yet.
If you are correct than micro 5 ended above micro 3, which shouldn’t happen.
Good catch- thanks for the observation.
Lara, what do you think of moving the daily GDX count up one degree? This seems like it will fit with your gold count better. Thoughts?
Good idea. Will do.
You’re doing such a good job of this GDX count Dreamer, saving me so much time! Thank you.
Thanks Lara. Just trying to be a good student and hopefully it helps those that trade the miners.
You’re awesome, Dreamer!
Very kind. Thanks!
Dreamer you’re a very good EW student and deserve some gold stars for your work and sharing your excellent GDX EW charts.
Thanks Richard!