
A correction was expected to end about 1,347 – 1,346. A lower target was considered at 1,333.
Price moved well below the preferred higher target.
Summary: The trend is up. The target remains at 1,582. Monday may begin with a very little downwards movement before the upwards trend resumes. There is still enough bearishness from volume to warrant extreme caution with this trend. If choosing to enter long, members are very strongly advised to use a stop loss in case price moves lower and invalidates the wave count. Invest no more than 3% of equity on any long trade here.
New updates to this analysis are in bold.
Grand SuperCycle analysis is here.
Last weekly chart is here.
DAILY ELLIOTT WAVE COUNT
Click chart to enlarge.
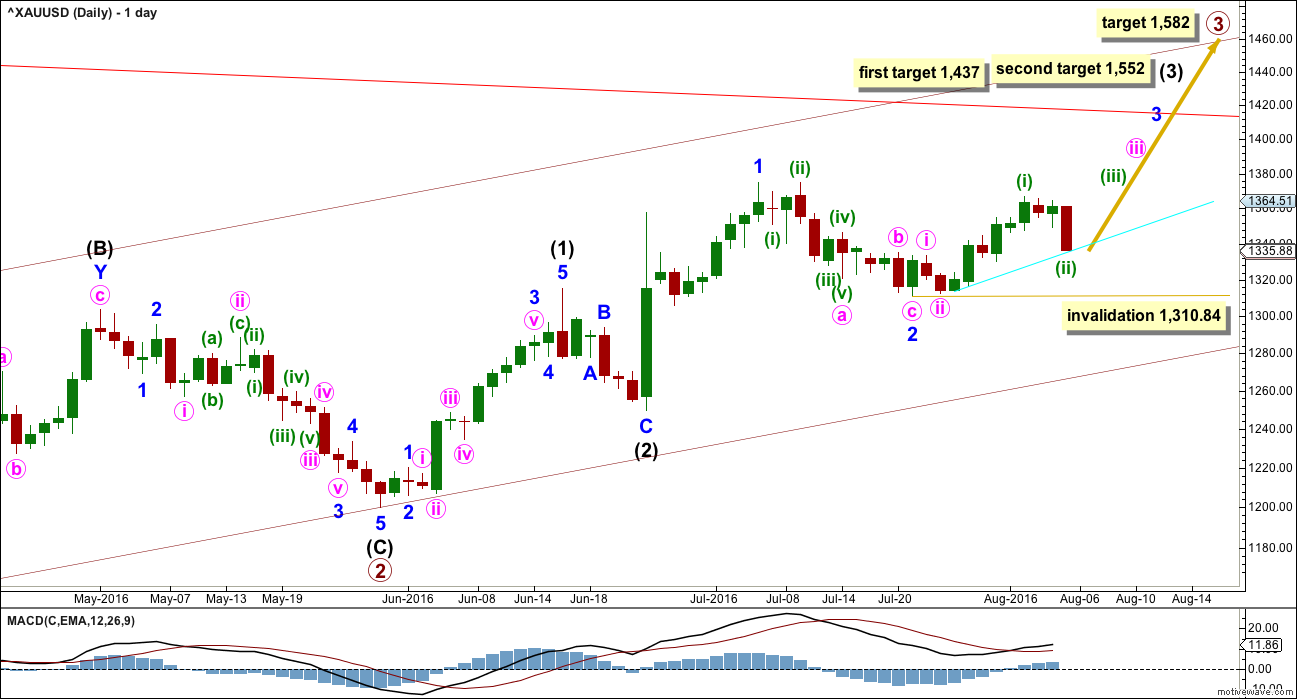
Primary wave 2 is a complete expanded flat correction. Price from the low labelled primary wave 2 has now moved too far upwards to be reasonably considered a continuation of primary wave 2. Primary wave 3 is very likely to have begun and would reach 1.618 the length of primary wave 1 at 1,582.
Primary wave 3 may only subdivide as an impulse.
So far intermediate waves (1) and (2) may be complete within primary wave 3. The middle of primary wave 3 may have begun and may also only subdivide as an impulse.
Within intermediate wave (3), the end of minor wave 1 is moved up to the last high. This fits on the hourly chart although it looks odd here on the daily chart. There was a small fourth wave correction up at the end of minor wave 1 and it subdivides on the hourly chart as an impulse. Minor wave 2 may be a complete zigzag, also subdividing as a zigzag on the hourly chart. If minor wave 2 is over, it would be 0.50 the depth of minute wave i.
No second wave correction may move beyond the start of its first wave below 1,310.84 within minor wave 3.
At 1,437 intermediate wave (3) would reach 1.618 the length of intermediate wave (1). If price keeps going upwards through this first target, or if it gets there and the structure is incomplete, then the next target would be at 1,552 where intermediate wave (3) would reach 2.618 the length of intermediate wave (1).
HOURLY ELLIOTT WAVE COUNT
Click chart to enlarge.
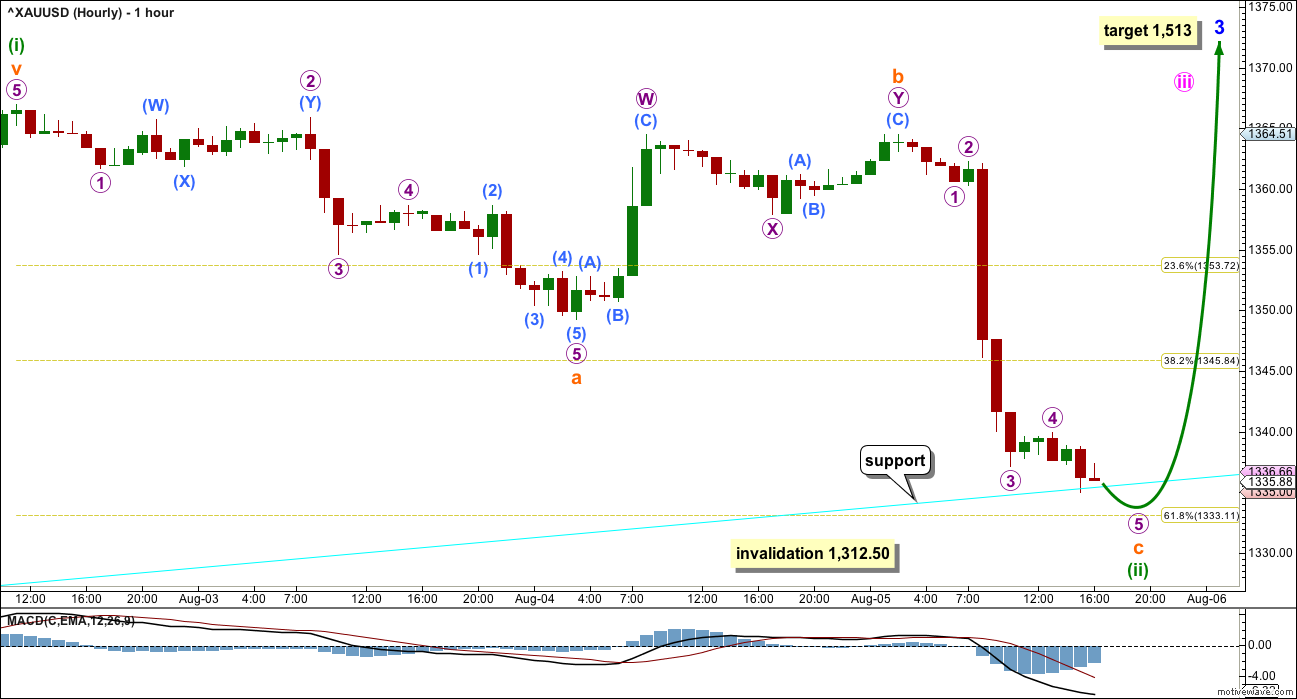
Three first and second waves are complete: intermediate waves (1) and (2), minor waves 1 and 2, and minute waves i and ii. All are shown on the daily chart.
Minuette wave (i) is complete within minute wave iii. Minuette wave (ii) is most likely very close to completion. It may end with a slight overshoot of the cyan trend line at the 0.618 Fibonacci ratio of minuette wave (i) at 1,333.
Minute wave ii one degree higher lasted 41 hours. So far minuette wave (ii) is longer in duration, but still not so much so that the wave count looks wrong. At the daily chart level, the wave count still has the right look.
When minuette wave (ii) is complete, the reversal should be clear: Minuette wave (iii) upwards should begin with clearly upwards movement, not sideways.
Minuette wave (ii) may not move beyond the start of minuette wave (i) at 1,312.50.
The lower cyan trend line may offer support. With price now at this trend line, if this analysis is wrong, it may be in expecting the line to be breached. If price begins to move strongly higher when markets open on Monday, then this trend line may have offered strong support and minuette wave (ii) may possibly have been over at the low on Friday.
TECHNICAL ANALYSIS
WEEKLY CHART
Click chart to enlarge.
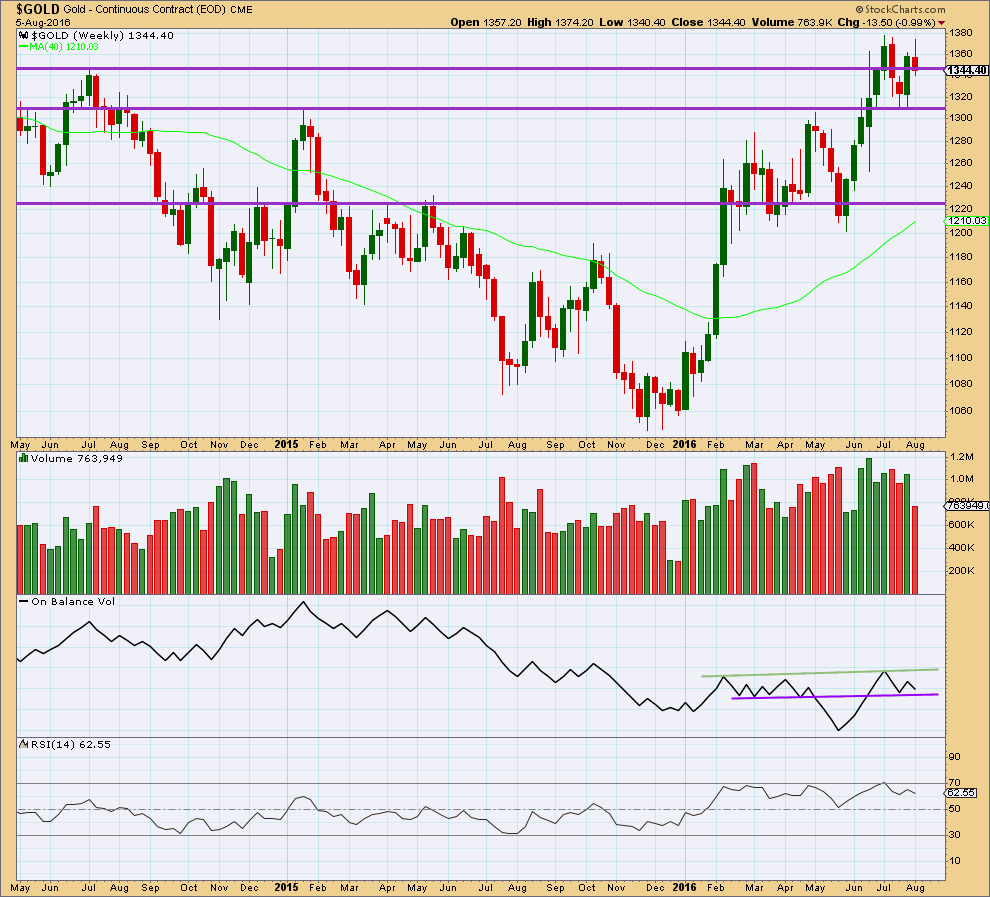
Last week completed a bullish engulfing candlestick pattern supported by stronger volume than the prior downwards week. This week made a new high, then completed a red candlestick on lighter volume. Overall, the fall in price this week is not supported by volume at the weekly chart level. This week looks to more likely be a corrective movement than a new trend.
On Balance Volume is still relatively bullish above the purple trend line, which is redrawn at the end of this week. A break below the purple line would be bearish. A break above the green line would be bullish.
RSI is not extreme. There is room for price to rise or fall.
DAILY CHART
Click chart to enlarge.
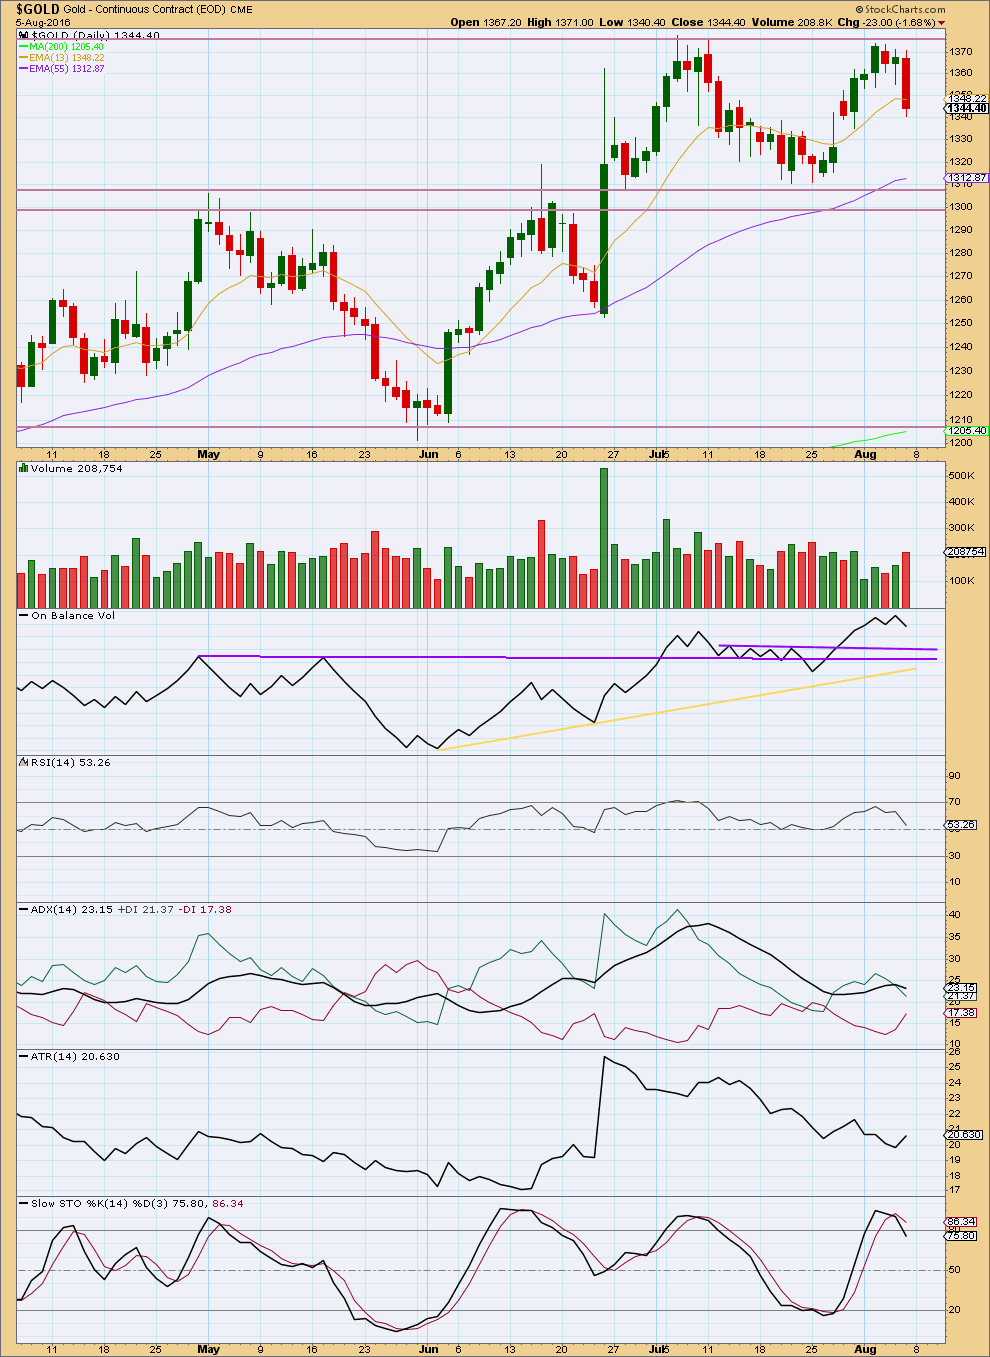
First impression of Friday’s candlestick is a strong downwards day that is well supported by volume. With the fall in price over the last three days having support from volume, the initial impression is that this movement may be a new downwards trend and not a counter trend movement. Price has closed below the 13 day moving average, which often (not always) provides support or resistance for smaller corrections during Gold’s trends.
ADX is declining still and has not indicated a trend change. The +DX line remains above the -DX line. ADX is indicating a correction is unfolding.
ATR disagrees as it is increasing for Friday. ATR indicates a new trend may be emerging. The trend would be down. ADX and ATR need to agree before any confidence may be had in a new downwards trend though.
Looking back over this bull market that started on 3rd December, 2015, the multi day corrections may assist to see how Friday’s volume spike should be interpreted.
During the upwards trend from 3rd of December, 2015, 14 multi day corrections are noted. Of those 14 multi day corrections, 8 ended with strong volume on the final day and six did not. Gold has a tendency to blowoff tops and volume spikes at the end of downwards waves. It is possible that this is what happened on Friday.
There are two ways to read Friday’s strong volume: as a spike at the end of a movement, which is a bullish interpretation, or as support for downwards movement, which is a bearish interpretation.
On Balance Volume may be useful in deciding which interpretation is more likely. OBV is bullish in regards to trend lines here on the daily chart but bearish in regards to some divergence with price. Overall, OBV works more reliably with trend lines than it does with divergence, so the weight of evidence is judged here to be bullish but only slightly.
There is enough bearishness still for caution to be warranted. If choosing to enter long positions here, it is absolutely essential that stops are used to protect your account in the event that this correction continues lower. Do not invest more than 3% of equity in any long position entered here.
This analysis is published @ 11:11 p.m. EST.
Just wondering: Gold price appears toppy struggling to get past 20dma (1336-37). With stochastic %K below %D and CCI on the daily having crossed below zero (0), expecting a pullback….remains to be seen if a break below 1325 will be tested…. Probably better off initiating shorts lol….
I think it may be over folks. A new high above 1,349.25 would add confidence to the wave count. That’s the low of subminuette a. A new high above that point could not be a fourth wave within an impulse developing lower, because then it would be back in first wave price territory. So at that stage the downwards move would be confirmed as a three and it would be over.
So that’s an important price point for confidence.
Lara thanks for your clarification. Great timing. Your the Best as usual. Go Surfing in the winter whitecaps with the penguins and seals.
LOL
An onshore mess again today… no surf since 24th July for me 🙁
We do have penguins up here, little blue ones. But no seals, I’m too far north for them.
I do surf with dolphins very occasionally, and there are orca about here. If I see one of them when I’m in the water, I think I would be petrified! They have very large pointy teeth…
“They have very large pointy teeth…”
The better to EAT you with my dear… oops, but that is quite another fairy tale no? 🙂 🙂 🙂
Gold dropped slightly below Lara’s target of 1,333 to 1,329.95 at 5:30 am.
There is support however, sideways movement in gold today in a $8 range may not confirm a bottom of minuette wave (ii).
“If price begins to move strongly higher when markets open on Monday, then this trend line may have offered strong support and minuette wave (ii) may possibly have been over at the low on Friday.”
It did move reasonably well off the low, those first three hourly candlesticks look good and they’re supported by volume.
Interesting yes gold did go up $8.24 from a 4 day low of 1,329.95 at 5:30 am up to a market high of 1,338.19 at 10:24 am then bounced in a $4 range.
Two “canaries” I like to watch are EXK and FSM and both popped quite nicely today.
GDX Techical Analysis Monthly and weekly have been Buy and Hold since mid January Miners bull run began.
GDX Fired a Buy December 28th on weekly time frame.
Gold monthly Fired a Buy June, weekly fired a Buy the end of June.
NUGT monthly hasn’t fired a Buy yet, however weekly Fired a Buy December 7th and Daily January 12th then April 11th then July 1st
Important news on gold related stocks….
http://www.prnewswire.com/news-releases/direxion-announces-reverse-and-forward-share-splits-of-nine-leveraged-etfs-300304402.html
As sure a sign as you can get that they expect (forward share splits)that the asset is going much higher…DUST will provide further fodder for the short sellers….
Good to know. Thanks for the news!
Wave count for today anyone? Does this look like up move is intact?
Selling 10 AG Aug 19 18.00 strike puts for 0.60 per contract. I am willing to take delivery of 1000 shares of AG if stock is trading below 18.00 on expiration. If assigned, cost will be about 17.40 per share. Will use some of proceeds to buy 17.00 strike puts to hedge any unexpected downside surprise.
AG I think may go up a lot long term, short term may be a risky buy.
Chart looking strong and management team cream of the crop. Balance sheet is pristine. It is a stock worth accumulating and pops on puts used to hedge will be used to lower cost basis on long position.
Minuette (ii) likely over at 5:30 AM low. If so, impulsive action up?
It appears that you were right.
The correction is not over yet.
Subminuette 3 of Minuette 2 of Minute 3 had only ended at 1331.50 at 7:15 pm ET.
Subminuette 4 was a shallow expanded flat terminating at 1338.35 at 1:30 am ET.
Subminuette 5 is underway.
My targets are :
(1) 1327.11 @ 0.618 Fib of Subminuette 1;
(2) 1320.17 where Subminuette 5 = Subminuette 1; and
(3) 1317.78 @ 0.618 Fib of Subminuette 3.
This is compared to 1318.53 where Minuette 2 = 0.886 Minuette 1.
Thank you Tham. Seeing that we are near completion to the subminuette correction helps me relax. My stops are set – in stone this time. I am really hoping we don’t go near my stops though cause I so dislike getting stopped out only to rebuy a tad higher. But alas my computer is at work– for me I’m going to bed,, late. Enjoy your day today.
Thanks again for your post.
Any update on charts and also any comment on the gold market..??
http://seekingalpha.com/article/3997063-sentiment-speaks-strong-bullish-setup-place?auth_param=j4p1:1bqf0g4:950a20cf49b41b980c084e17ee7987bb&uprof=51
You may wish to scan this article: Aug 7, Avi Gilburt- Elliottwavetrader.net
The sharp move down on Friday looks more like a 2nd wave. I think we should reverse up on Monday if this is the case.
A move much below 28.95, the .618 retrace, may signal a deeper correction is unfolding.
Caution is advised.
GDX is giving us mixed signals at best
Important trading lessons can be learnt everyday and big ones over long periods and the same may go for profits.
So many runs of different periods since mid January Miners Bull run began after more than 4 years of a bear market.
Profit periods from hours to days to weeks.
Opportunities for many profit taking trades.
Be patient and easy on ourselves as there are many more likely profitable buys and sells instead of very seldom perfect buys and sells, which is not the end goal, profits are.
Elliott Wave is sort of like a ‘Snakes and Ladders’ process with many ups and downs just like low RSI and stochastics and other indicators and the long gold day down like today that only temporarily crashes miners all of which are likely buying times despite the fear factor as miners often bounce up fast after a brutal day especially NUGT if the next day gold is stable and moving up.
Then when gold and miners had an incredible day or week and indicators very high it may be time to take the profit in front of us before something causes it to disappear because we know it’s just a matter of time before gold and miners have another terrible day or week and a great buy again.
Trend Waves
http://www.tradingday.com/c/tatuto/trendwaves.html
A quick explanation of Elliott Wave trading with only 1 simple chart.
Well put…Richard!
Thank Melanie and for your Avi Gilburt article link above..