
Both hourly Elliott wave counts expected a new low before some upwards movement. Both hourly counts remain valid.
Summary: Look out now for surprises to the upside. With price at support, a green daily candlestick, and divergence between price and Stochastics expect more upwards movement here. The target for the Elliott wave count for a third wave to end is now at 1,585.
New updates to this analysis are in bold.
Last weekly charts are here.
Grand SuperCycle analysis is here.
DAILY ELLIOTT WAVE COUNT
Click chart to enlarge.
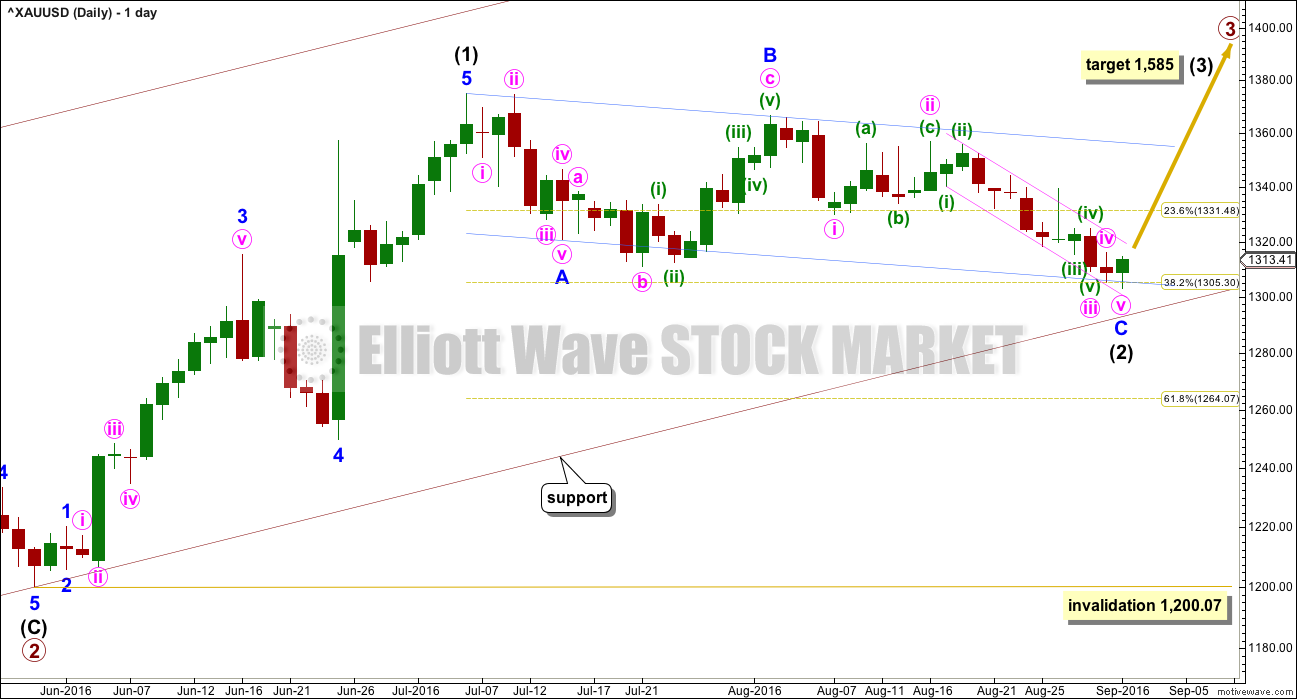
Primary waves 1 and 2 are complete. Thereafter, this wave count differs from the two alternates.
This main wave count will expect primary wave 3 to be longer than primary wave 1. Because this is very common, this is the main wave count and it expects the most common scenario is most likely. At this stage, the target for primary wave 3 is removed. A new target for intermediate wave (3) is calculated: at 1,585 intermediate wave (3) would reach 1.618 the length of intermediate wave (1).
Intermediate wave (2) may now be complete ending just below the 0.382 Fibonacci ratio of intermediate wave (1) and lasting 40 days. However, price remains within the small pink channel and has not yet offered confirmation of a trend change. It must be accepted that intermediate wave (2) may yet move lower. Intermediate wave (2) may not move beyond the start of intermediate wave (1) below 1,200.07
Primary wave 3 may only subdivide as an impulse.
At this stage, a new high above 1,330.01 could not be a continuation of minute wave iv, so at that stage minute wave iv and minor wave C would have to be over. A new high above 1,330.01 would provide strong confidence in a trend change and the resumption of the prior upwards trend.
Keep the small narrow pink channel on daily and hourly charts. Draw a channel about intermediate wave (2) using Elliott’s technique for a correction (blue lines). Price is finding support at the lower edge. The lower edge of this channel may stop price from falling further.
With this wave count expecting a third wave at two large degrees to begin, look out for surprises to the upside at this stage.
HOURLY ELLIOTT WAVE COUNT
Click chart to enlarge.
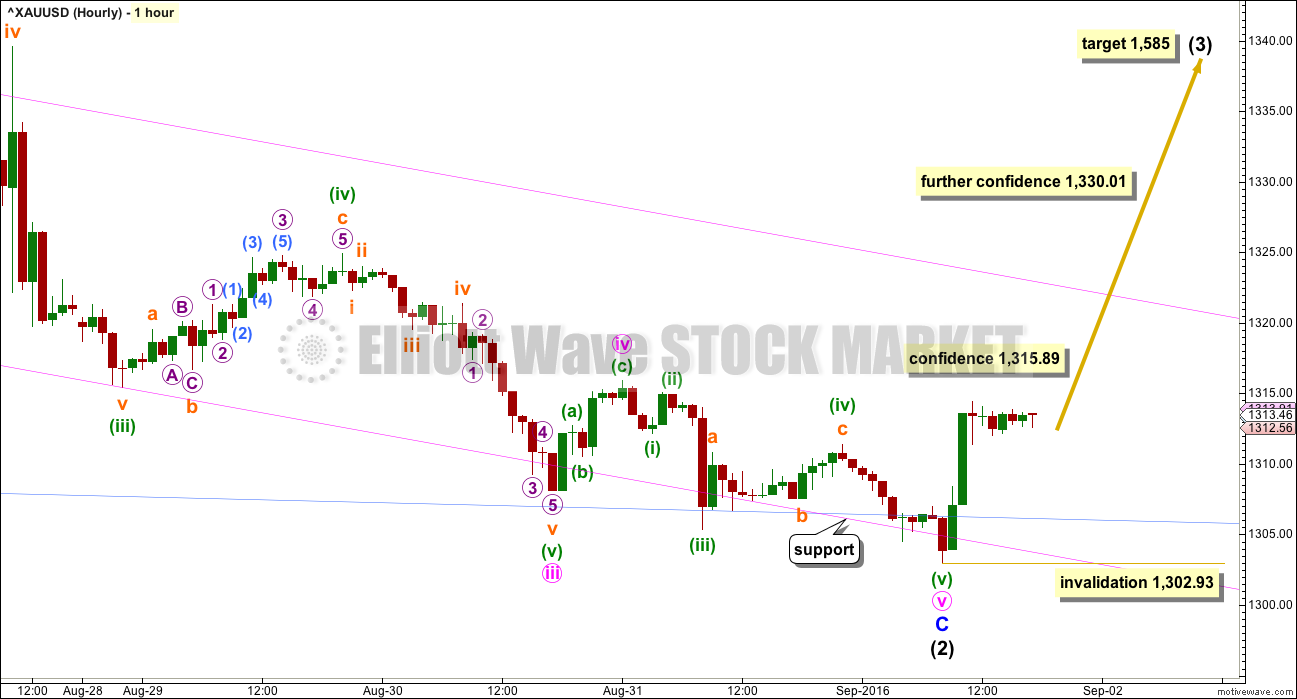
Minor wave C must subdivide as a five wave structure.
The structure may now be complete. This is the main wave count today because of the green daily candlestick. At the daily chart level, it looks like minor wave C is over. Price is finding support about the lower edge of both the pink and blue channels copied over from the daily chart.
There would be no Fibonacci ratio within intermediate wave (2) between minor waves A and C.
Ratios within minor wave C are: there is no Fibonacci ratio between minute waves i and iii, and minute wave v is 1.15 short of 0.382 the length of minute wave i.
Ratios within minute wave iii are: minuette wave (iii) is just 0.07 short of 2.618 the length of minuette wave (i), and minuette wave (v) is 1.42 short of equality in length with minuette wave (i).
Ratios within minute wave v are: minuette wave (iii) is just 0.08 short of 2.618 the length of minuette wave (i), and minuette wave (v) has no adequate Fibonacci ratio to either of minuette waves (i) or (iii).
A new high above 1,315.89 would invalidate the triangle on the alternate hourly chart below. That would add a little confidence to this main wave count.
A new high above 1,330.01 would invalidate the alternate hourly wave count below and provide further reasonable confidence in this main wave count.
Intermediate wave (1) lasted 27 days and intermediate wave (2) lasted 40 days. Intermediate wave (3) may be reasonably expected to last longer than intermediate wave (1) in both time and price. A Fibonacci 55 days would be a first expectation.
No second wave correction may move beyond the start of its first wave below 1,302.93.
ALTERNATE HOURLY ELLIOTT WAVE COUNT
Click chart to enlarge.
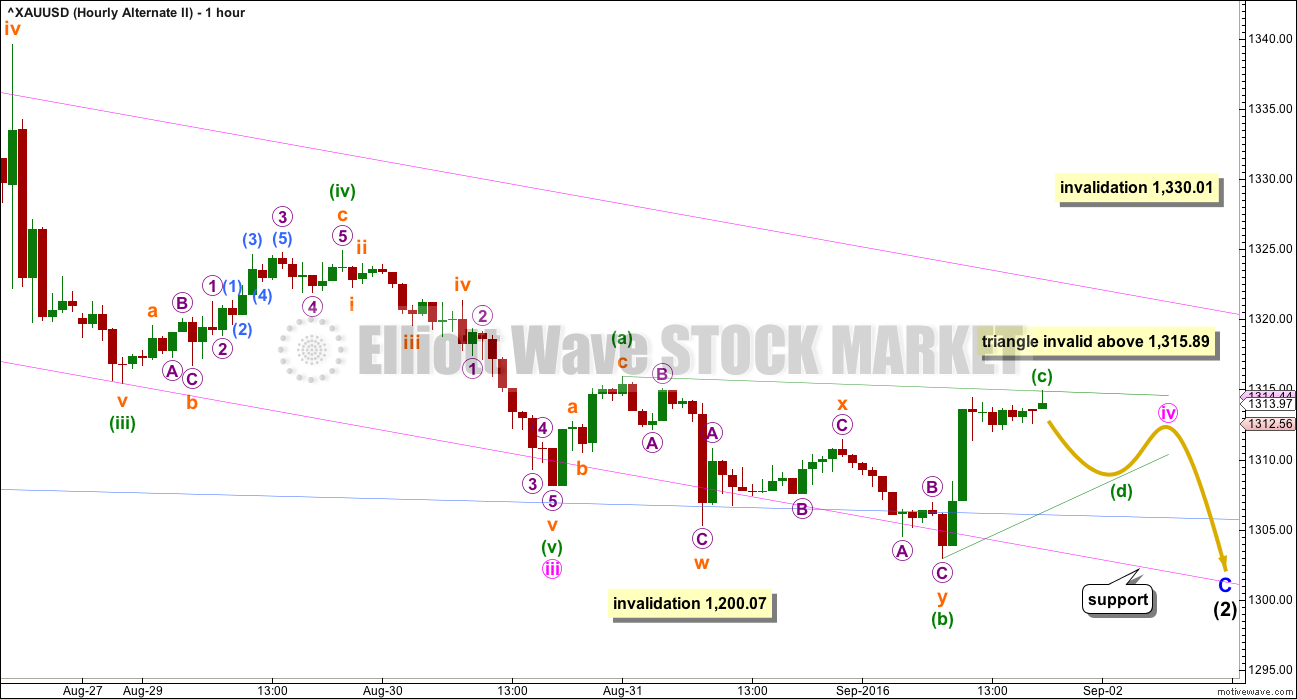
Both hourly wave counts today see minute wave iii over at the low for 30th of August.
It is possible that a final new low is yet to be made, that minute wave iv is incomplete. When minute wave iv is a complete structure, then a final wave down for minute wave v may be needed to complete the whole structure of minor wave C.
At this stage, minute wave iv may be unfolding sideways as a running contracting triangle. Within a contracting triangle, minuette wave (c) may not move beyond the end of minuette wave (a) above 1,315.89.
When minuette wave (c) is complete, then minuette wave (d) down may not move reasonably below the end of minuette wave (b) at 1,302.93. A contracting triangle must see minuette wave (d) end above the end of minuette wave (b). A barrier triangle must see minuette wave (d) end about the same level as minuette wave (b); as long as the (b)-(d) trend line remains essentially flat the triangle would remain valid. In practice, this means minuette wave (d) may end slightly below the end of minuette wave (b). This is the only Elliott wave rule which is not black and white.
Thereafter, a final small wave up for minuette wave (e) would most likely end short of the (a)-(c) trend line and may not move beyond the end of minuette wave (c).
If the triangle is invalidated with a new high above 1,315.89, then it would be possible that minute wave iv could be unfolding as an expanded flat or a combination.
Minute wave iv may not move into minute wave i price territory above 1,330.01. This wave count would be invalidated above 1,330.01 leaving only the main wave count.
ALTERNATE DAILY ELLIOTT WAVE COUNT
Click chart to enlarge.
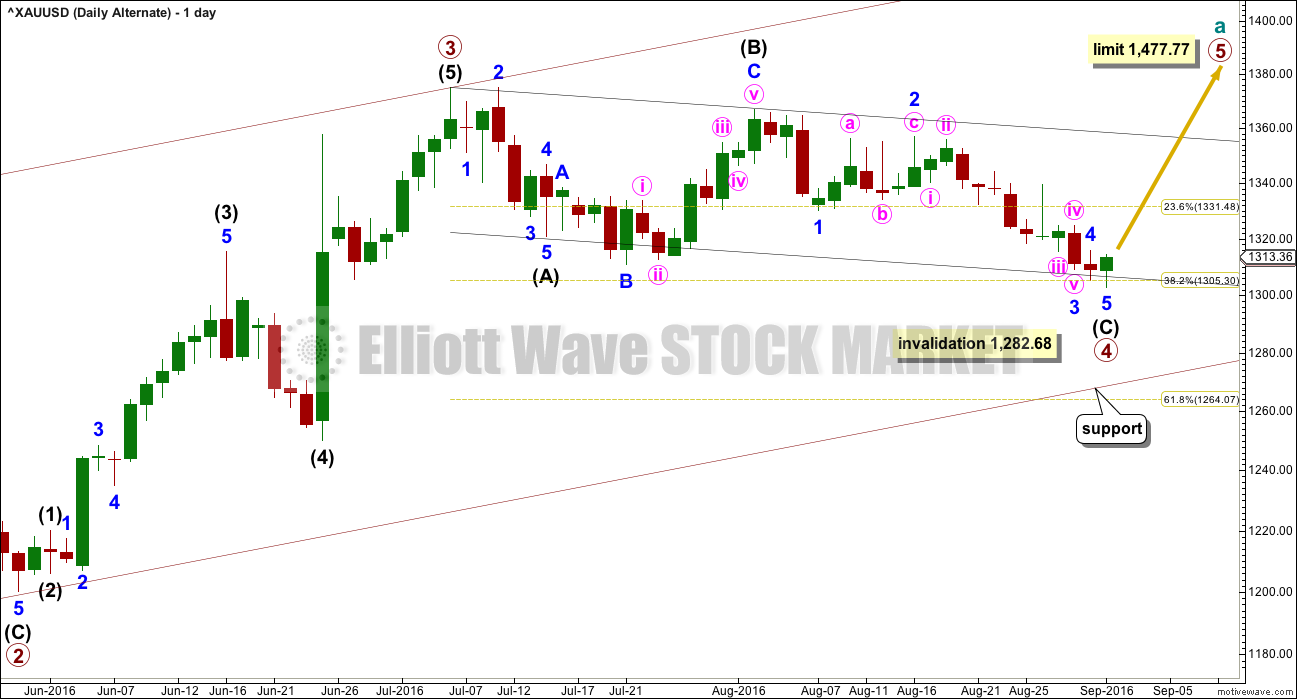
It is possible that primary wave 3 is over and shorter than primary wave 1. Primary wave 3 shows stronger volume than primary wave 1 (see technical analysis weekly chart).
If primary wave 3 is over, then the current consolidation for Gold would be primary wave 4.
Primary wave 2 was a relatively shallow 0.35 expanded flat correction. Primary wave 4 may be unfolding as a deeper zigzag which would exhibit perfect alternation.
Primary wave 4 may not move into primary wave 1 price territory below 1,282.68.
Primary wave 5 would be limited to no longer than equality in length with primary wave 3, so that the core Elliott wave rule stating a third wave may not be the shortest is met. Primary wave 5 would have a limit at 1,477.77 if it has begun at today’s low.
The hourly charts would be exactly the same except for the degree of labelling.
TECHNICAL ANALYSIS
WEEKLY CHART
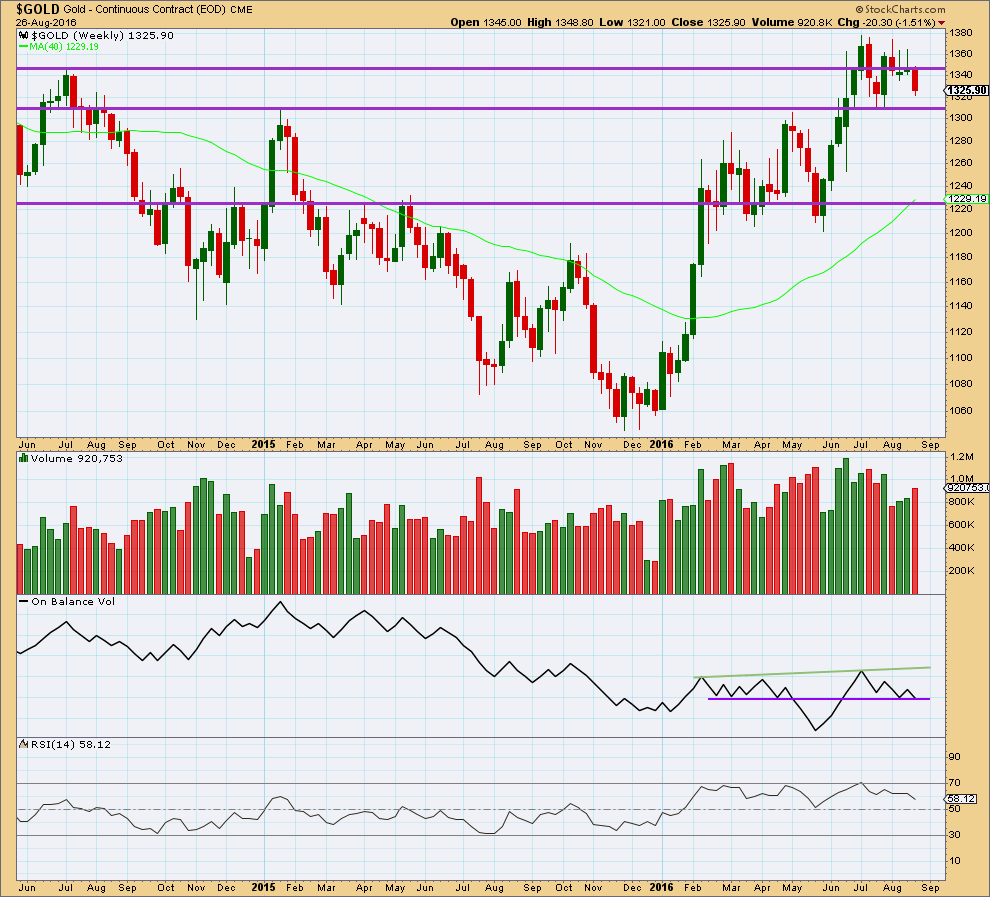
Click chart to enlarge.
A strong downwards week with an increase in volume supports the main and alternate III wave counts. Overall, volume is still declining and price remains range bound.
The prior two green weekly candlesticks had long upper shadows which was bearish.
Price may find some support about 1,310.
On Balance Volume at the end of last week has come down to find support at the purple trend line. This may help to stop price falling much further.
RSI is not extreme. There is some hidden bullish divergence with price and RSI: RSI has made a lower low below the low of 25th of July but price has made a higher low. This indicates some weakness to this downwards movement. It is more likely to be a smaller correction than a sustainable trend.
DAILY CHART
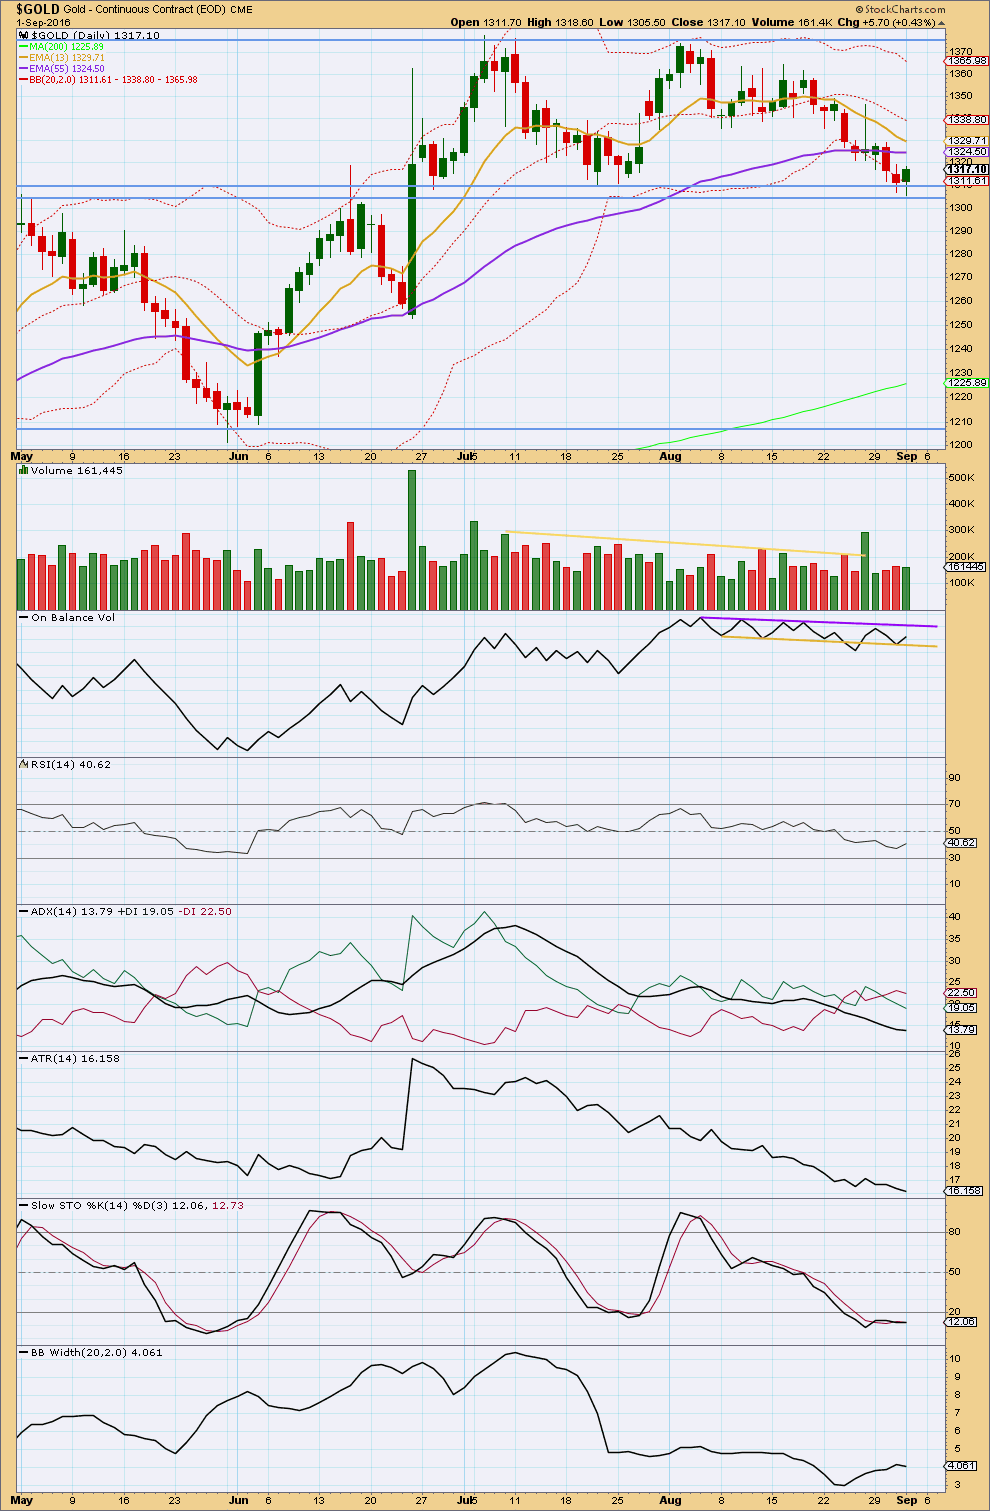
Click chart to enlarge.
Volume for today’s upwards day comes with slightly lighter volume than yesterday’s downwards day, but overall volume has not substantially reduced. The volume profile is short term slightly more bearish than bullish.
Price found support very close to the lower edge of the support zone today, which is 1,305 – 1,310. With this area being the lower edge of the larger consolidation, which began back on 7th of July, it would be reasonable to expect downwards movement to end here or very soon indeed.
Stochastics exhibits multi day bullish divergence with price: Stochastics has made a higher low above the prior low for 26th of August as price made a slight new low today. With Stochastics oversold and now exhibiting divergence, it would be reasonable to expect downwards movement to end here or very soon indeed.
On Balance Volume is giving a weak bullish signal today with a move up and away from the yellow line. This line is offering support, but it has recently been weakened with a breach and return. For this reason the signal is only weak. OBV may find some resistance now at the purple line.
RSI is not extreme. There is still room for price to fall further. There is no divergence between price and RSI to indicate weakness.
ADX and ATR are both declining, indicating that the market is not trending; it is consolidating. Bollinger Bands remain contracted and slightly narrowed today. All three of these indicators are in agreement that this market is consolidating.
After a period of declining ATR, it should be expected that range will again begin to increase at some stage.
After a period of declining and low volatility, it should be expected that volatility will again return to the market and Bollinger Bands will again widen at some stage.
The shorter 13 day moving average is declining but remains above the mid term 55 day moving average. The 55 day average is also still declining. The long term 200 day moving average is still increasing and price remains above it. The longer term upwards trend should be assumed to remain intact. With the shorter term average still above the mid term average, it should be assumed that this downwards swing is a correction and not necessarily the start of a new downwards trend.
This analysis is published @ 06:37 p.m. EST.
[Note: Analysis is public today for promotional purposes. Member comments and discussion will remain private.]
Sorry everybody, I was not up early enough to give an end of day update.
It looks though like price has done exactly as the main count expects. Although the final important price point at 1,330.01 hasn’t been passed, so minute iv could be an expanded flat (as Alan and Daniel opine below).
The analysis is for gold 24 hours a day except from Friday 5:00 pm to Sunday 6:00 pm when no gold trading world wide.
Lara, will Friday’s end of day Analysis also be Public Access or have you cut the public off cold turkey with them being hooked for 5 days on your analysis and leave them hanging on in suspense and begging for more clarity on Gold over the weekend so they have to subscribe or at least pay only $1 for a 7-day trial? Only $1 dollar for 1 whole week of clarity on gold at this very important bullish turning point up or further bearish drop for gold.
Hi Richard, The original plan was to do five days in a row, so that would include today’s end of week.
Five videos in a row on YouTube is bound to generate interest.
And hopefully people are hooked!
It won’t be free again for a couple of weeks now probably.
GDX wants to fill the morning gap…The weakness that showed in the 5 minutes chart in both gold futures and GDX should be seen as a warning sigh….
The gold spike reached 1330.30 (1326.80 on the chart that Lara uses). There is no invalidation of the alternate hourly. In that scenario, Minute 4 became an expanded flat.
I have the main count as subminuette 3 of minuette 1 at 1330.30. Price has to rise for a fifth wave, failing which the alternate hourly is favoured. (Personally, I don’t mind the alternate hourly. It’s the alternate daily that I hate as it greatly limits the possible gains).
I agree with expanded flat. As long as we do not take out high of today we are going to lower lows.
Jobs data triggered a spike in gold this morning to 1330.20. This was higher than the invalidation point, but I’m just not feeling the bullishness in the gold price, thereafter. The 5 minute profile is showing weakness and gold has pulled back to 1323.
We have a Fed rep speaking at 1:00 and due to previous hawkish statements, I’m anticipating more hawkish statements regardless of the mixed jobs data.
My comments are purely speculative, but I’ll wait until I see gold climb beyond 1331 before I jump in unless someone else can educate me further. Thanks!
Stephen,
I can’t believe FED will be saying anything but ‘Rates are going higher’. Jobs report is good but not amazing as only off by 20,000 which was expected given the end of summer doldrums.
I thought the analysis is only for the cash market which opens at 9:30 unless GOLD is being analyzed differently.
Thanks for your feedback!
Here’s the site that I use to track the gold price… notes 1330.20, but I do understand your point about the multiple data feeds, etc… Hmmmmm?
https://www.dailyfx.com/gold-price
Financial news reports that the jobs data is more of a goldilocks figure indicating that it’s not necessarily a game changer which would help to support a gold pull back from today’s highs.
There are many gold feeds and need to use Lara’s for any confirmation.
This is her gold feed and it only shows a High of 1,326.78
http://www.barchart.com/quotes/forex/%5EXAUUSD
Alan also mentions this in his comment above that didn’t reach 1330.01 yet today.
“(1326.80 on the chart that Lara uses).”
Was not higher than 1330 based on Lara’s datafeed, weblink previosly given.
I use chart IQ to follow Lara’s data points which matches up with bar chart forex data.
Daniel could you please clarify what is “Chart IQ”?
“I use chart IQ to follow Lara’s data points which matches up with bar chart forex data.”
https://technicianapp.com/
Data very similar to barchart. gold symbol ^xauusd
Also have iphone app.
Stephen, I agree…
Lara, the amount of analysis you are doing this week is amazing. You are spoiling us. Thanks for all the work! ?
🙂 You’re welcome.
Better stop. Wouldn’t want anyone to get spoiled.
‘NYSE’ HOLIDAY CLOSED Labor Day September 5 Monday
https://www.nyse.com/markets/hours-calendars
Rambus on the USD using UUP. He sees a possible H&S forming which could mean a big move up in gold.
https://rambus1.com/2016/09/01/uup-update-89/
Looking forward to Lara’s analysis of USD also
Yes interesting Lara and Rambus, US Dollar analysis.
Another GANN Global video – about 12 minutes – on HUI and Gold – lots of statistical comparisons to prior rallies and pullbacks
http://www.gannglobal.com/webinar/2016/August/16-08-Video10-2ndChance.php?inf_contact_key=4ea80cbde117ab0515e01d10f4d728f91ddbe12e8becbd65481ca861ffbb175b
FRIDAY, SEPT. 2 8:30 am EST US Nonfarm payrolls
Often this is one of the biggest news releases of the month.
GDX had a strong move up today, and based on the EW count, I would say that the bottom is likely in. That said, there is no confirmation yet.
> RSI turned up today, but there was no divergence
> The strong move up today is still within the downtrend channel
> Volume was stronger today, but still lower than the recent strong down day of Aug 24th
> Slow Stochastics is still showing divergence, but has not yet moved above 20
>OBV moved up today, but stalled at resistance
Dreamer, your analysis are always great and I learn a lot from you, Thanks for sharing.
Thanks Maged, always good to hear that sharing my ideas helps others. Good luck!
I agree. Excellent solid TA. Thanks Dreamer!
Lara, have you tried $DXY on barchart to download USD? Their chart shows that they have 25 years of data, but I don’t know if it’s available for download since I’m not a member. Just a thought.
Will do….
I have USD data from FXCM, I’ve used that. Finishing up now.
BarChart data would be better though.
And thanks for the tip!