
Yesterday’s analysis expected upwards movement overall.
Price has overall moved sideways and lower. So far an inside day is completing for Tuesday’s session.
Summary: Upwards movement is expected from here. The target at 1,533 may be met in about six months time. There is divergence with price and Stochastics and RSI indicating bears are exhausted. If this view is wrong today, then Gold may make one final new low to a target at 1,203 before turning. A new high above 1,221.62 would add confidence in a trend change.
New updates to this analysis are in bold.
Grand SuperCycle analysis is here.
Last monthly and weekly charts are here.
DAILY ELLIOTT WAVE COUNT
Click chart to enlarge.
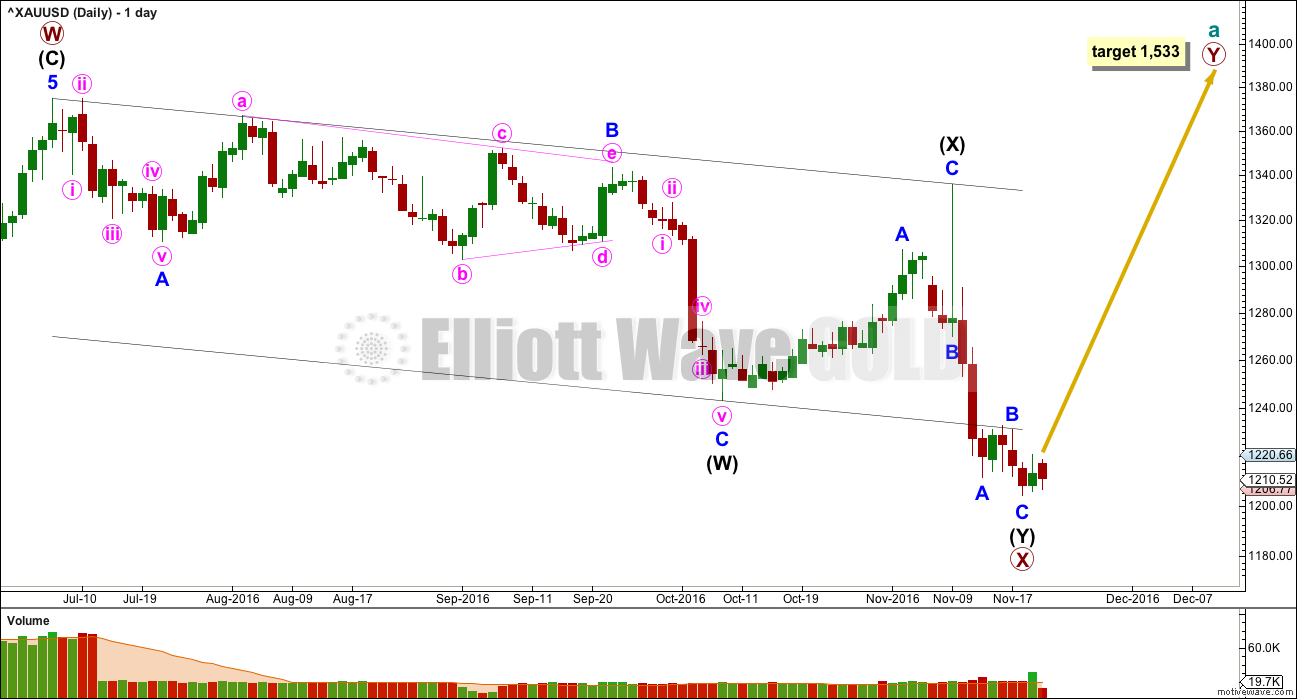
The larger structure of primary wave X may be either a double zigzag or a double combination. The second structure in this double for primary wave Y may be either a zigzag (for a double zigzag) or a flat or a triangle (for a double combination).
It is my judgement at this stage that it is more likely primary wave X will be a double zigzag due to the relatively shallow correction of intermediate wave (X). Although intermediate wave (X) is deep at 0.71 the length of intermediate wave (W), this is comfortably less than the 0.9 minimum requirement for a flat correction. Within combinations the X wave is most often very deep and looks like a B wave within a flat.
However, there is no minimum nor maximum requirement for X waves within combinations, so both a double zigzag and double combination must be understood to be possible. A double zigzag is more likely and that is how this analysis shall proceed.
Within the second structure, minor wave A should be a five wave structure. This now looks complete.
Minor wave B found resistance at the lower edge of the wide parallel channel about primary wave X. Minor wave C may now be complete at the hourly chart level. Minor wave C has no Fibonacci ratio to minor wave A. Intermediate wave (Y) is just 0.02 longer than equality in length with intermediate wave (W).
At 1,533 primary wave Y would reach equality in length with primary wave W.
Primary wave W lasted seven months. Primary wave Y may be expected to be about even in duration.
Volume data from BarChart indicates yesterday’s upwards movement had support from volume and today’s downwards movement does not. This supports the idea of an upwards trend, at least short term.
HOURLY ELLIOTT WAVE COUNT
Click chart to enlarge.
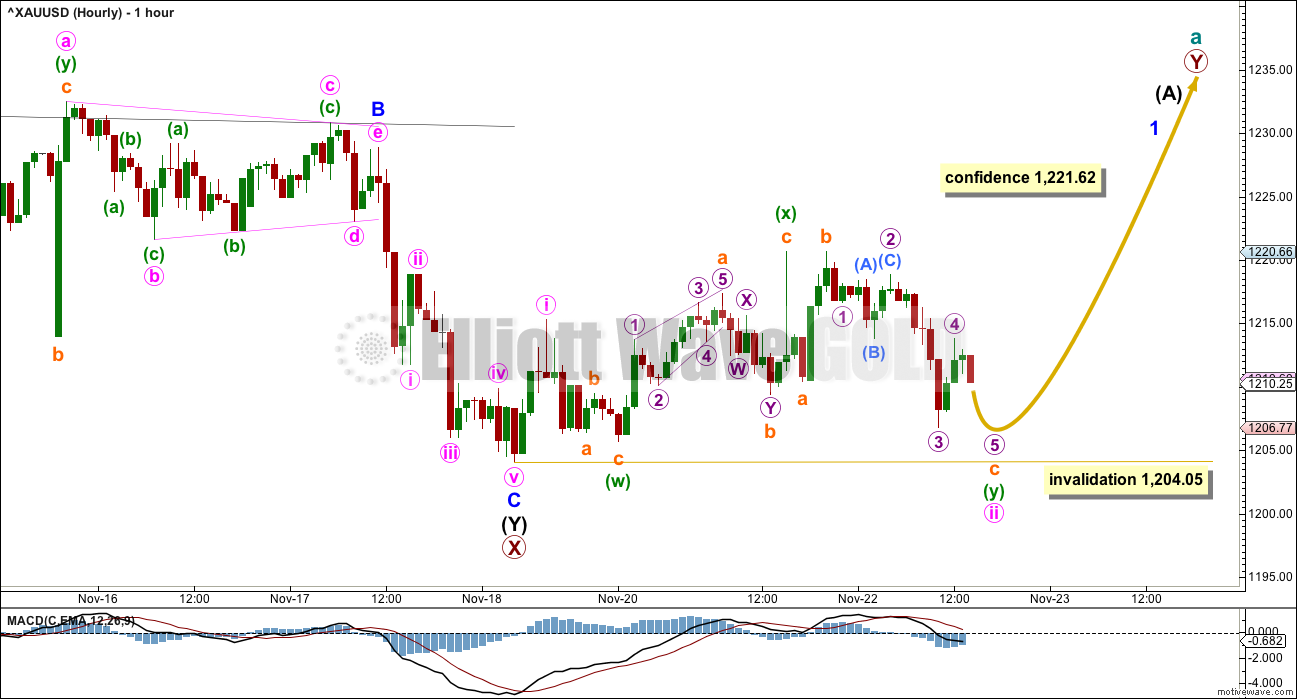
Minor wave B completed as a regular contracting triangle. Gold often exhibits surprisingly short waves out of its triangles.
Minor wave C has moved slightly below the end of minor wave A, avoiding a truncation. The structure now looks complete at the hourly chart level.
Within minor wave C, there are no adequate Fibonacci ratios between minute waves i, iii and v.
This upwards movement from the end of primary wave X to the last high yesterday will not fit as either a complete impulse or leading diagonal.
A first wave may have completed very quickly, labelled minute wave i. Subsequent sideways movement may be a combination for minute wave ii.
Minute wave ii fits as a double combination: zigzag – X – regular flat. Within the regular flat correction, labelled minuette wave (y), the five down for subminuette c looks like it needs one final new low to complete it. Micro wave 5 would be likely to make at least a slight new low below the end of micro wave 3 at 1,206.77 to avoid a truncation. Minute wave ii may not move beyond the start of minute wave i at 1,204.05.
It is also possible that subminuette wave c is over and micro wave 4 within it was a very quick shallow correction at the end seen on a lower time frame. Sometimes Gold’s fourth waves are much quicker than its second waves. One final new low may not be required.
A new high above 1,221.62 would still add confidence to a trend change. At that stage, the second hourly chart below would be invalidated.
SECOND HOURLY ELLIOTT WAVE COUNT
Click chart to enlarge.
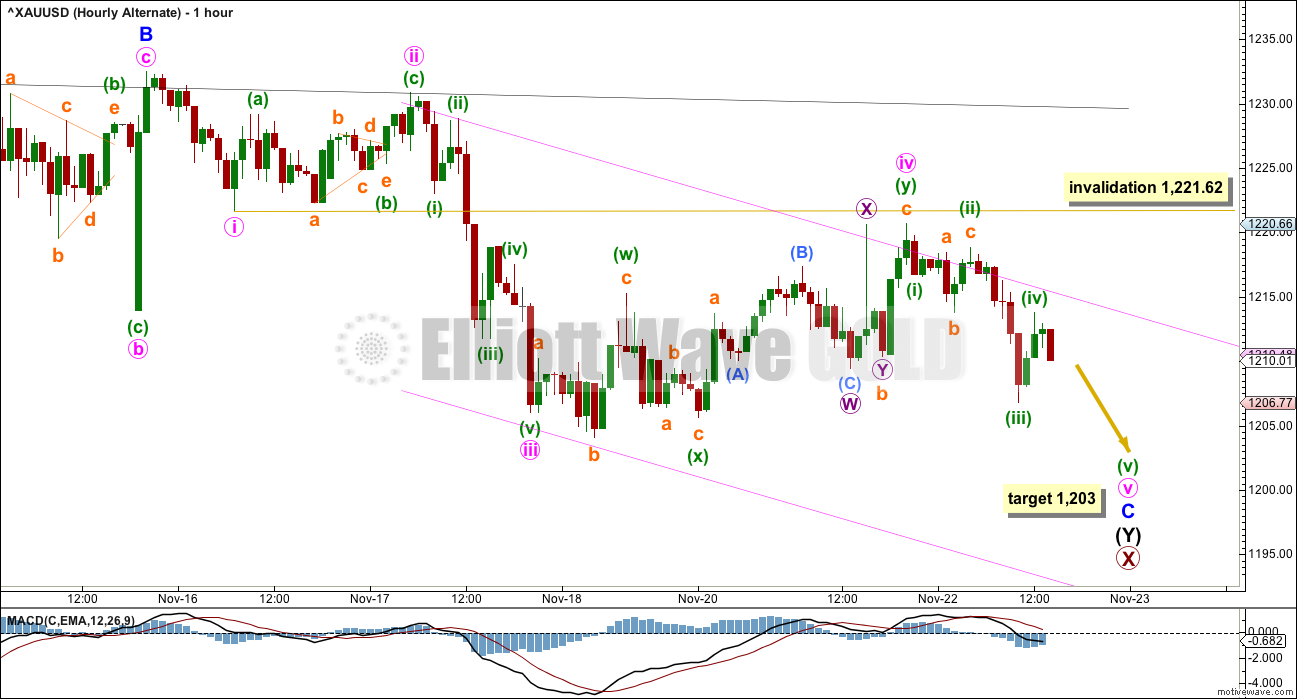
What if minor wave B was not a triangle but completed as a zigzag? Minor wave C may have begun earlier.
Minor wave C must complete as a five wave structure. It may need one final new low to end minute wave v within it.
Within minor wave C, there is alternation between the zigzag of minute wave ii and the combination of minute wave iv.
At 1,203 minute wave v would reach 1.618 the length of minute wave i. There is no Fibonacci ratio between minute waves i and iii, so a ratio for minute wave v is likely.
Minute wave iv may not move into minute wave i price territory above 1,221.62.
While this wave count is entirely possible, it is judged to have a lower probability than the first hourly chart today.
ALTERNATE DAILY ELLIOTT WAVE COUNT
Click chart to enlarge.
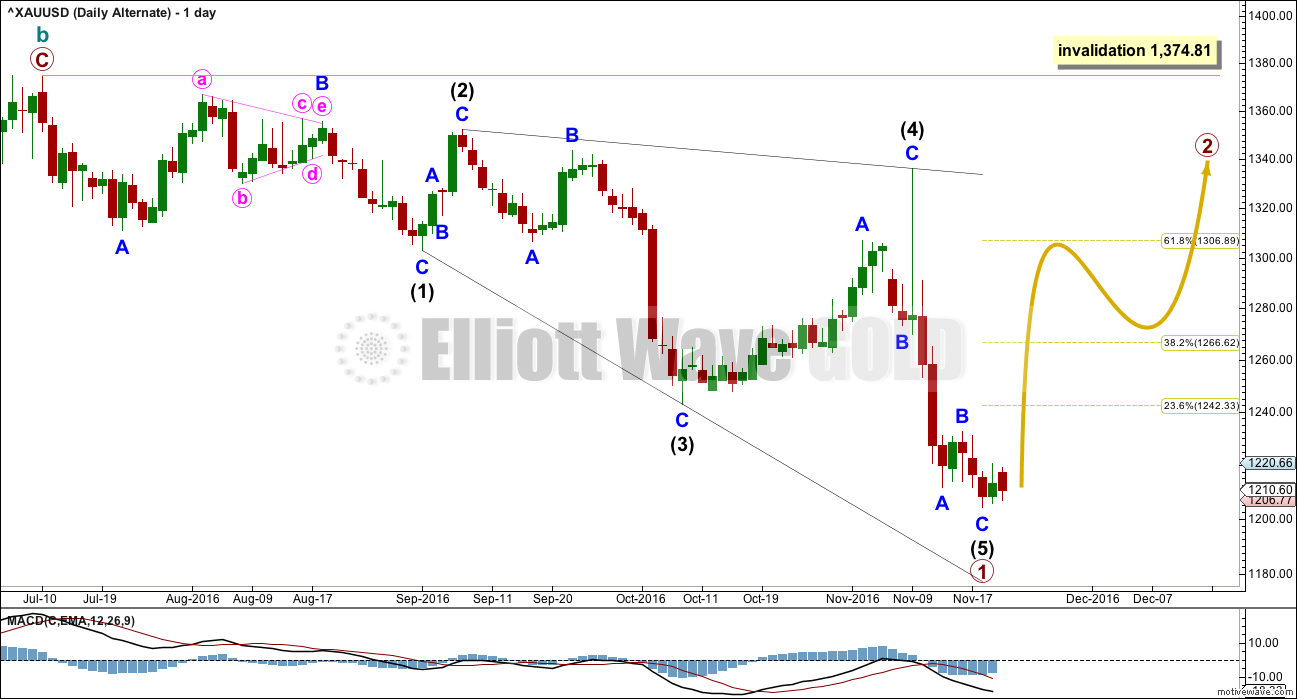
This alternate wave count expects that the large upwards zigzag from the low of 1,046 in December 2015 to the last high of 1,374 in July 2016 is a complete correction. The trend is still down; Gold is still in a bear market.
If there has been a cycle degree trend change at the high labelled cycle wave b, then the new wave down must begin with a five wave structure. At this stage, there looks to be too much overlapping for an impulse, so a leading diagonal is considered.
Within leading diagonals, sub-waves 2 and 4 must subdivide as zigzags. Sub-waves 1, 3 and 5 are most commonly zigzags but sometimes may also appear to be impulses.
Within this structure, all sub-waves subdivide as zigzags. This wave count meets all Elliott wave rules. This diagonal looks correct.
This wave count has a lower probability at the daily chart level because leading diagonals are not very common structures for first waves. When first waves do subdivide as leading diagonals, they are most often contracting and not expanding. This wave count does not rely upon a rare structure, but it does rely upon a less common structure.
At the monthly chart level, if the zigzag up labelled cycle wave b is complete, then there are further implications. That means that the prior wave down to the low at 1,046 on December 2015 must be seen as a five wave impulse. This is possible, but it has a fairly low probability.
Primary wave 1 lasted 94 days. Primary wave 2 may initially be expected to last about a Fibonacci 55 or 89 days. It should be a big three wave structure.
At this stage, there is no divergence in expected direction between this alternate and the main wave count. The structure of upwards movement, if it is clearly a three or five, may assist to tell us which wave count is correct in coming weeks. For now this alternate must be judged to have a low probability due to the problems outlined. It is published to consider all possibilities.
TECHNICAL ANALYSIS
WEEKLY CHART
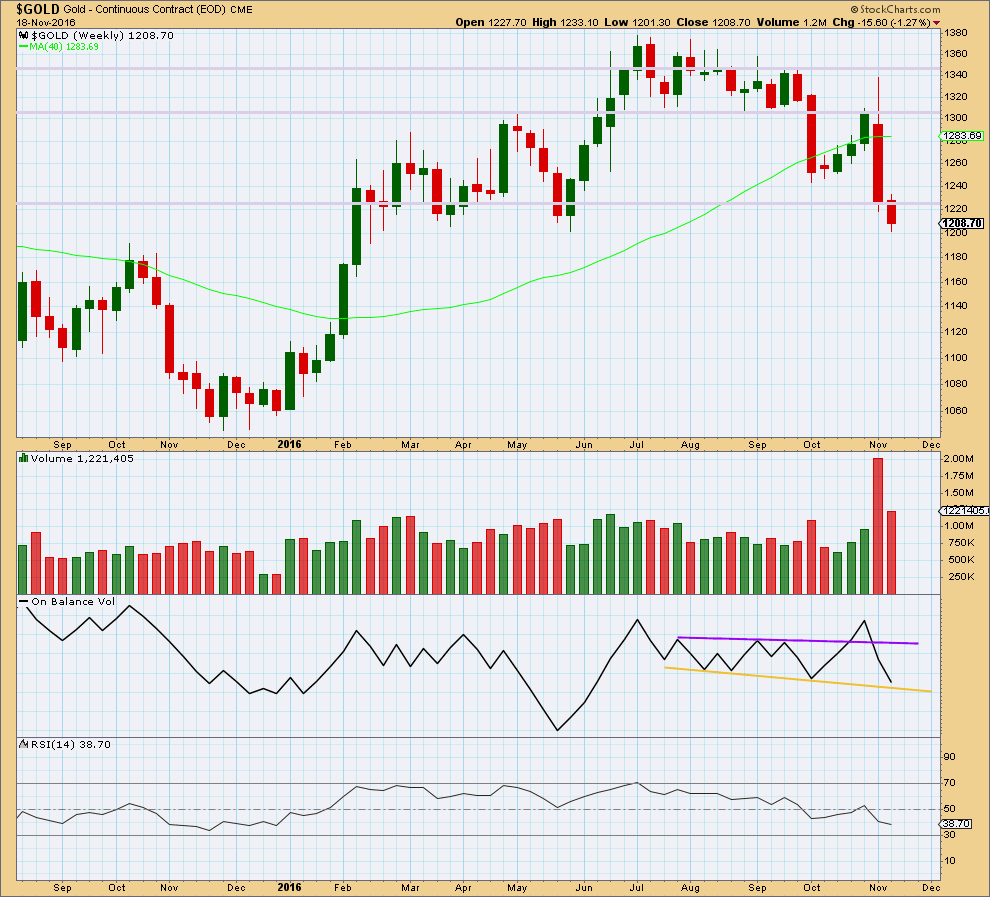
Click chart to enlarge. Chart courtesy of StockCharts.com.
Last week completes with a smaller range and a substantial decline in volume. The fall in price is not supported by volume, so it is suspicious. It looks like bears are tired.
Price may find support here about 1,200.
On Balance Volume has come down to almost touch the yellow support line. There is a very little room for more downwards movement. This line should be expected to provide support and assist to halt the fall in price either here or very soon.
RSI is not extreme and does not exhibit divergence with price. There is room still for price to fall further.
DAILY CHART
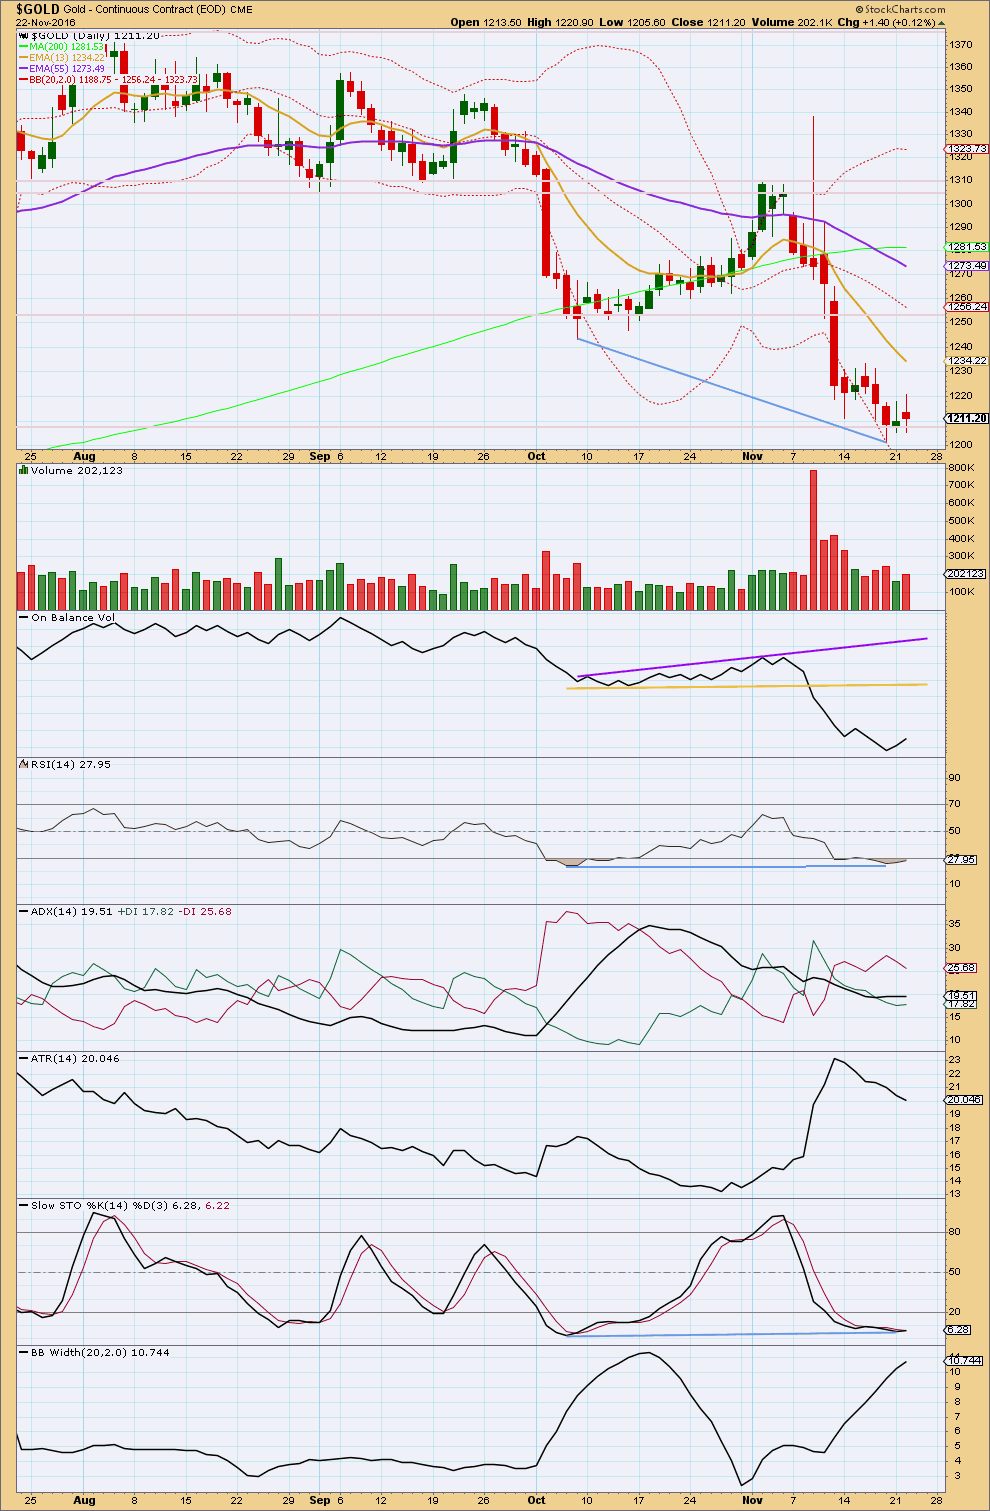
Click chart to enlarge. Chart courtesy of StockCharts.com.
This classic technical analysis section is updated at 10:11 p.m. EST.
Today’s candlestick qualifies as an upwards day with a higher high and a higher low (slightly), even though it closed red.
It is difficult to judge how to interpret volume here though for this day. Perhaps if I could look at hourly bars there may be some indication, but StockCharts does not supply this.
On Balance Volume moved higher. This indicates that there was more support for upwards movement from volume than downwards. With volume overall higher today, the conclusion should be that there is support today for upwards movement.
It looks like price is finding some support about 1,200. It remains to be seen whether price will consolidate here before moving lower or move upwards in a new trend.
The short term Fibonacci 13 day moving average is still pointing down and is below the mid term Fibonacci 55 day moving average. These indicate that the short and mid term trend is still down.
The longer term 200 day moving average is still pointing upwards, but price is below it. The longer term trend may be shifting from up to down.
RSI is still oversold though, so it is difficult to see how price could continue to fall from here. Some consolidation may be required to bring it back up into neutral.
There is still bullish divergence between price and RSI indicating this last wave down was weak. There is also still bullish divergence between price and Stochastics. Stochastics is still oversold.
ADX slightly declined today indicating the market is no longer trending; it is consolidating. ATR agrees as it continues to decline.
Bollinger Bands still disagree as they continue to widen.
Overall, the only thing that looks clear at this stage is some small upwards movement may be expected as price moves up from the edge of Bollinger Bands towards the middle at least. This should resolve oversold conditions. Volume will be watched carefully over the next days to give a clue as to whether or not upward movement has support from volume, and whether or not there may be a new sustainable trend.
This analysis is published @ 03:35 p.m. EST.
Perhaps a bit more downside on fri and if we don’t get a hammer then may bottom Monday. Just a guess, could keep going lower till fed meeting but with housing softening a bit fed might have hands tied. The fear here is we still have a democratic fed, treasury,etc and a hike before they leave would not be unexpected.
It is interesting you wrote: “The fear here is we still have a democratic fed, treasury,etc and a hike before they leave would not be unexpected.”
As I know FED chair is extension of Republicans thru Allen Greenspan , Ben under Bush and Yellen under Dems. But her policy has been inherited by Republican appointees.
Treasury??? Dem or Republicans they are always from Wallstreet. The bankers. Does it really make difference politically??? I am not sure.
Here Lara looks at Elliott waves only and US policy is priced in the analysis results.
Thats why I am here for a fresh view without any noise from CNBC>
I hope you are right for a hammer or a reversal candle. Yes it may drag out to Wed may be.
Have a good day.
The bearish alternate still also expects a bounce. The structure on the hourly chart would be the same.
It would still be looking for a very deep primary 2 if primary 1 is a leading diagonal.
I’m going to have to look at the other idea, what if a first wave is not over? What if there are a series of overlapping first and second waves down from the high?
Short term I’d be expecting at least a small bounce here today. The next daily candlestick is likely to be green or a doji.
For the main daily wave count this is the only hourly chart. Minuette (v) looks like a typically swift strong extension.
IMO Unlikely to see Gold price back up to 1196-98; keeping it short for 1173-1166 range with upside risk 1217-20, lets see.
Beautiful hammer developing on GLD chart with lower wick tapping BB.
Filled on a few NUGT “stink bids” for 10 strike calls fairly close to this morning’s lows.
I reckon that the second hourly is in play, with the exception that the target given was too high.
I have the target as either (a) 1172, the 0.618 retrace of Primary W, (This is incidentally Primary X), or (b) 1180-1181, the 1.618 extension for Minute 5.
I think Lara’s count is correct up to minuette 2 (at 1218.85). The sudden dip today is minuette 3. Her data point of 1206.77 was only subminuette 1. Minuette 3 might be nearing the end now: my BarChart data is delayed.
Happy holidays, those of you who celebrate Thanksgiving.
Amendment: It does look as though 1206.77 was minuette 1.
Minuette 3 completed at 1181.95.
The target at 1172 looks more and more likely at this point. The problem is that we may not be able to capture the low due to the Thanksgiving holiday.
Good morning Alan.
I’m going to stick with the way I have it labelled because then the fifth wave is a swift strong extension. And that’s very typical for Gold.
I think it’s over now. But then, I thought that before. So again I could be wrong.
I’ll have an alternate.
If we see short term divergence today with Stochastics and price, and / or Stochastcis and RSI, then I’d have reasonable confidence the low is in and I’d enter another long.
But if we don’t then I wouldn’t.
What do u mean “not to be able to capture”?
Gold may sink to 1172 and by Friday will be higher????
Once this wave x is over what is the plan for gold target???
I think that this is wave C of 2, which could go down to about 1173, the 0.618 retracement.
Good point….hui is about 170 for .618, sometimes these are overshot. The market will be thin on Friday with a lot of players off. It would be easier to move the market one way or the other then, especially if a big player wanted in on gold this would be a great opportunity to push the market down thru stops so he could gobble up the remains. This may be the flush I was hoping for…nibble nibble bite
First hourly wave count invalidated. Target for second wave count met in hurry.
Now wave X complete gold can begin to move higher from here.
Lara you were right for advising to keep stops in place and trade not more than 3-5% of portfolio.
Gold bouncing off the low and trading at $1195.
Thanks.
Yes, that’s the problem in trying to pick a trend change. And Elliott wave can often be early there.
I too have losses today 🙁
But they’re less than 3% and there’s plenty of equity in my account to trade again.
Lara, you probably won’t like the sound of this because it would mean more work, but here goes anyway.
In the alt daily you’re showing a leading expanding diagonal which is unusual but not extremely rare. If that count is correct then it has enormous repercussions, not just for gold but for mining shares. I, and am sure many, hold long term mining shares which I don’t trade on every twist and turn. If the alt count proves correct, then it would make sense to go flat until the down wave is over.
It would be incredibly useful to know how rare the LEx diagonal is. Let’s say over 100 wave 1’s, 90% are impulses, and of the remaining 10%, 70% are contracting and 30% are expanding. That would give the chances of a LEx at only 3% and we could all relax.
As Elliott is fractal, would it make sense to analyse say 5-minute charts to extract the last 100 wave 1’s and observe the relative percentages? With your experienced eye you could spot the wave 1’s far more easily than most people. Probabilities based on historical performance can be extremely useful and especially where the chances of a particular outcome are very high or very low. This gave rise to my comment on the 1 Nov regarding a (then counter intuitive) strong drop in the mining shares. The probability behind that was 95% based on over 30 years data.
Any such analysis would only be valid for gold as every market has its own personality. Maybe that is why others haven’t done it.
Don’t feel pressured to do anything, but if the analysis could be performed without too much work then we could all benefit greatly.
I’ll have a look… I wouldn’t want to do it at a very low time frame. But for Gold I have enough data to do it at the daily time frame.
I would probably only take a couple of hours.
And don’t forget this one…
As a contrarian indicator, that’s enormously bullish. Thank you for sharing the chart Dreamer
I am starting to notice that sentiment extremes in many markets seem to persist for longer than usual these days – currencies, equities, precious metals, bonds. I am wondering what relevance it may have to many of these markets being at important inflection points. It looks like precious metals beginning an extended fifth wave down.
GDXJ got a buy signal today on American Bulls
GDX got a buy signal yesterday on American Bulls
GDX filled the gap, then showed resilience today, closing near the high of the day as gold languished.
If this count is correct, momentum and volume should increase with a move up tomorrow.
Lara, thanks for your hard work.
And thank you for the price point 1216.61 on the comments 11-21…… “Short term
a new high above 1,216.61 would add confidence that subminuette c of minuette (y) of minute ii must be over. Upwards movement could not be micro 4, so micro 4 would have to be over “… regarding the main hourly.
Hey, I’m first! 🙂
1221.62?
I have two confidence points, but only one on the hourly chart.
The first one is 1,216.61 which is the low of micro 1 within subminuette c within minuette (y) within minute ii.
The second one is 1,221.62 which is the start of minor C / end of minor B.
You’re welcome 🙂
I had to go out today so the analysis was early. Updating the regular TA now.