
The main Elliott wave count was invalidated with a new low below 1,204.05, and the target at 1,203 was inadequate for the alternate Elliott wave count.
Summary: Another strong downwards day has support from volume, and indicators suggest the trend is down. A new low below 1,181.95 would increase the probability of more downwards movement. The target would then be at 1,146. A new high above 1,206.77 and then 1,220.66 would add confidence in a trend change and a new wave upwards.
New updates to this analysis are in bold.
Grand SuperCycle analysis is here.
Last monthly and weekly charts are here.
DAILY ELLIOTT WAVE COUNT
Click chart to enlarge.
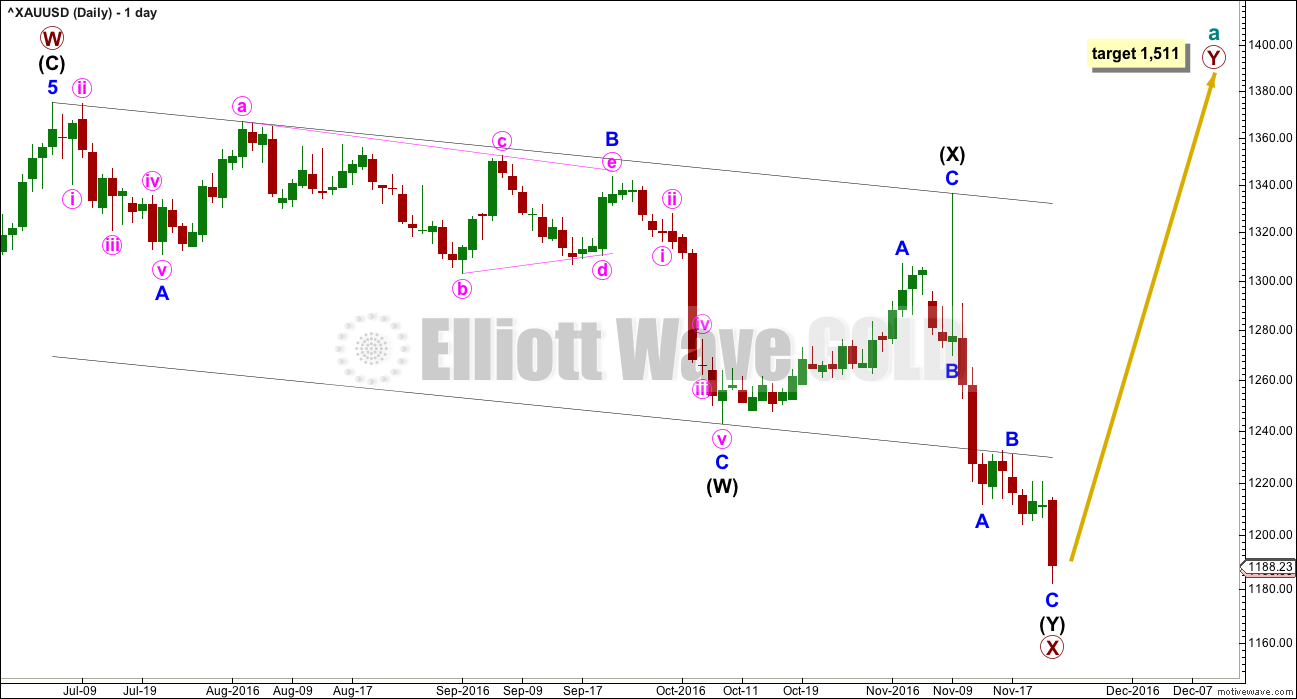
The larger structure of primary wave X may be either a double zigzag or a double combination. The second structure in this double for primary wave Y may be either a zigzag (for a double zigzag) or a flat or a triangle (for a double combination).
It is my judgement at this stage that it is more likely primary wave X will be a double zigzag due to the relatively shallow correction of intermediate wave (X). Although intermediate wave (X) is deep at 0.71 the length of intermediate wave (W), this is comfortably less than the 0.9 minimum requirement for a flat correction. Within combinations the X wave is most often very deep and looks like a B wave within a flat.
However, there is no minimum nor maximum requirement for X waves within combinations, so both a double zigzag and double combination must be understood to be possible. A double zigzag is more likely and that is how this analysis shall proceed.
Within the second structure, minor wave A should be a five wave structure. This now looks complete.
Minor wave B found resistance at the lower edge of the wide parallel channel about primary wave X. Minor wave C may now be complete at the hourly chart level. Minor wave C has no Fibonacci ratio to minor wave A. Intermediate wave (Y) is just 0.02 longer than equality in length with intermediate wave (W).
At 1,533 primary wave Y would reach equality in length with primary wave W.
Primary wave W lasted seven months. Primary wave Y may be expected to be about even in duration.
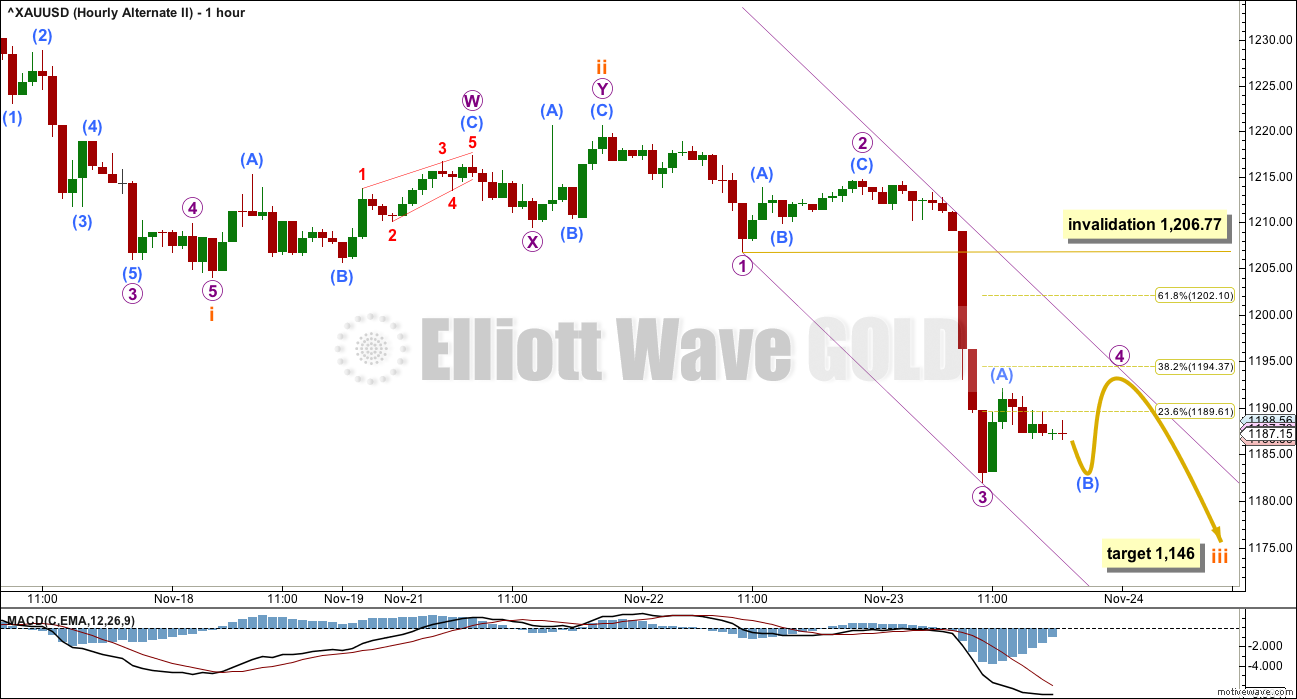
HOURLY ELLIOTT WAVE COUNT
Click chart to enlarge.
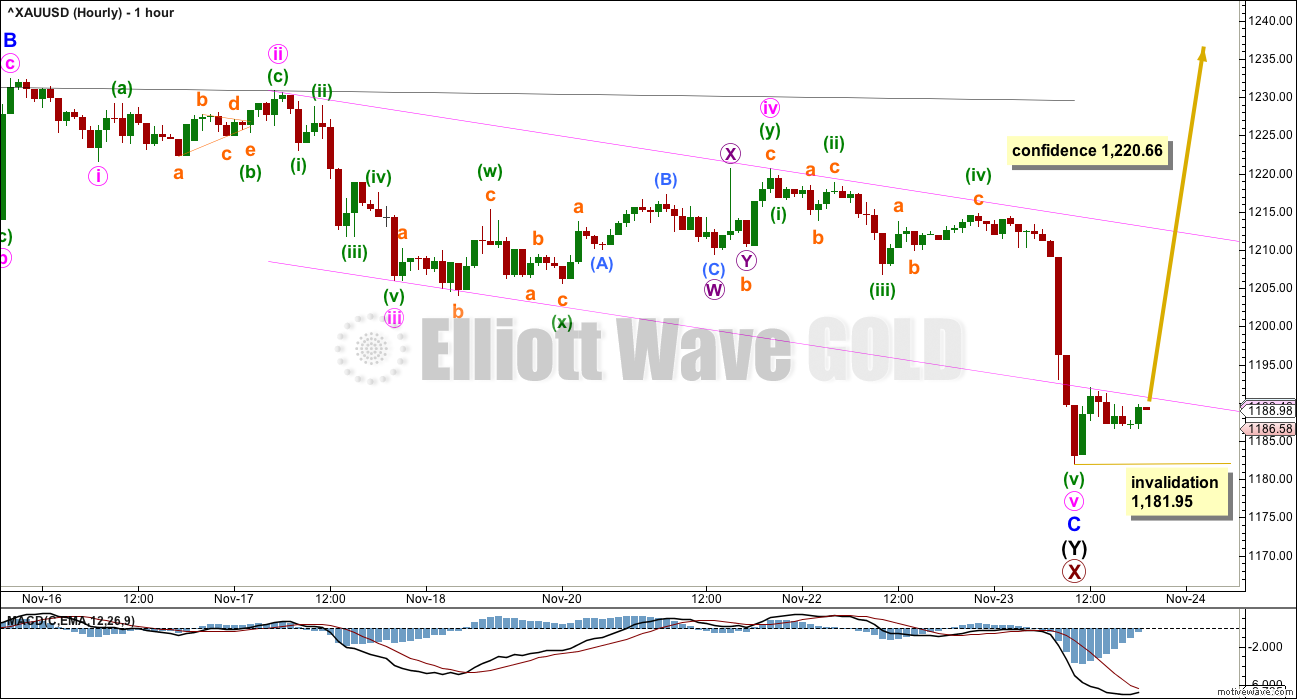
Minor wave C may again be a complete five wave structure for this wave count.
Ratios within minor wave C are: minute wave iii has no Fibonacci ratio to minute wave i, and minute wave v is 2.59 short of 1.618 the length of minute wave iii.
The pink channel is drawn using Elliott’s second technique, from minute wave ii to iv, then a parallel copy on minute wave iii. Price is finding resistance now at the lower edge. If price can break above resistance here, it may be taken as the earliest warning that this wave count may be correct.
A new high above 1,206.77 would add a little confidence to a trend change.
A new high above 1,220.66 would add reasonable confidence to a trend change.
If primary wave X is over at today’s low, then no second wave correction within the new upwards trend may move beyond the start below 1,181.95.
While price remains below the channel and the confidence points, the alternate wave counts below may also be correct. The risk will be that Gold is in a bear market.
ALTERNATE DAILY ELLIOTT WAVE COUNT
Click chart to enlarge.
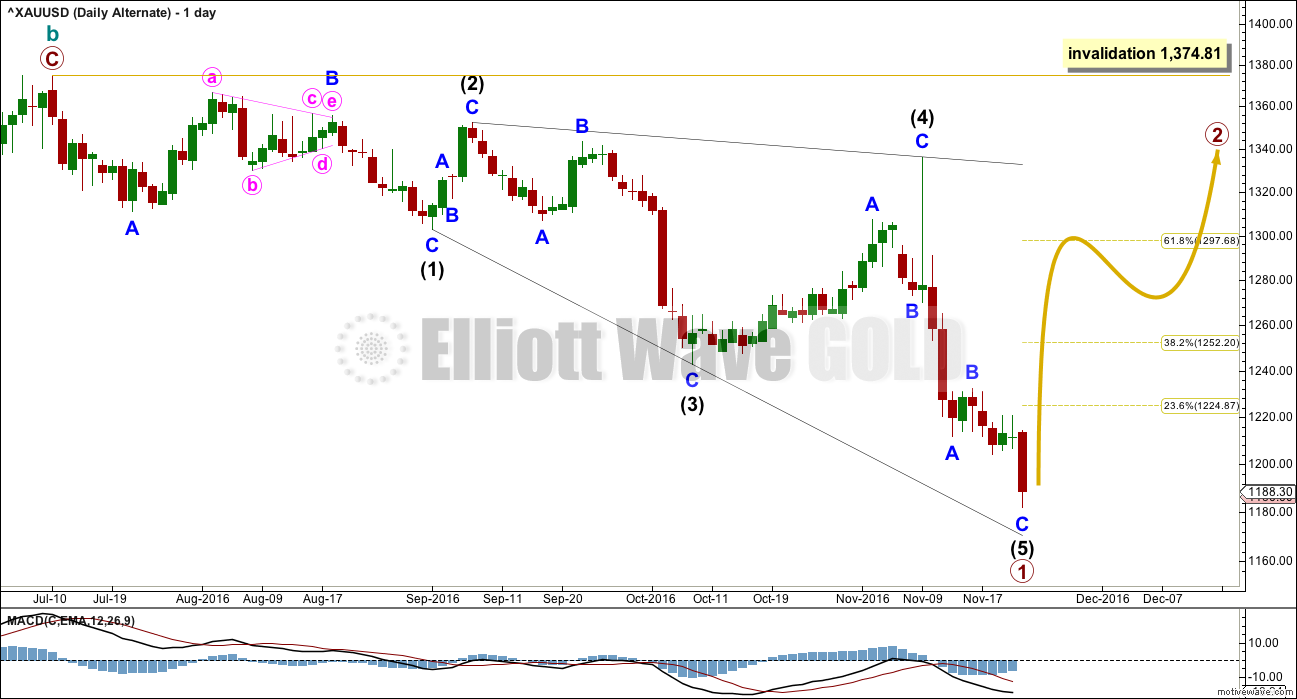
This alternate wave count expects that the large upwards zigzag from the low of 1,046 in December 2015 to the last high of 1,374 in July 2016 is a complete correction. The trend is still down; Gold is still in a bear market.
If there has been a cycle degree trend change at the high labelled cycle wave b, then the new wave down must begin with a five wave structure. At this stage, there looks to be too much overlapping for an impulse, so a leading diagonal is considered.
Within leading diagonals, sub-waves 2 and 4 must subdivide as zigzags. Sub-waves 1, 3 and 5 are most commonly zigzags but sometimes may also appear to be impulses.
Within this structure, all sub-waves subdivide as zigzags. This wave count meets all Elliott wave rules. This diagonal looks correct.
This wave count has a lower probability at the daily chart level because leading diagonals are not very common structures for first waves. When first waves do subdivide as leading diagonals, they are most often contracting and not expanding. This wave count does not rely upon a rare structure, but it does rely upon a less common structure.
At the monthly chart level, if the zigzag up labelled cycle wave b is complete, then there are further implications. That means that the prior wave down to the low at 1,046 on December 2015 must be seen as a five wave impulse. This is possible, but it has a fairly low probability.
Primary wave 1 lasted 94 days. Primary wave 2 may initially be expected to last about a Fibonacci 55 or 89 days. It should be a big three wave structure.
At this stage, there is no divergence in expected direction between this alternate and the main wave count. The structure of upwards movement, if it is clearly a three or five, may assist to tell us which wave count is correct in coming weeks. For now this alternate must be judged to have a low probability due to the problems outlined. It is published to consider all possibilities.
SECOND ALTERNATE DAILY ELLIOTT WAVE COUNT
Click chart to enlarge.
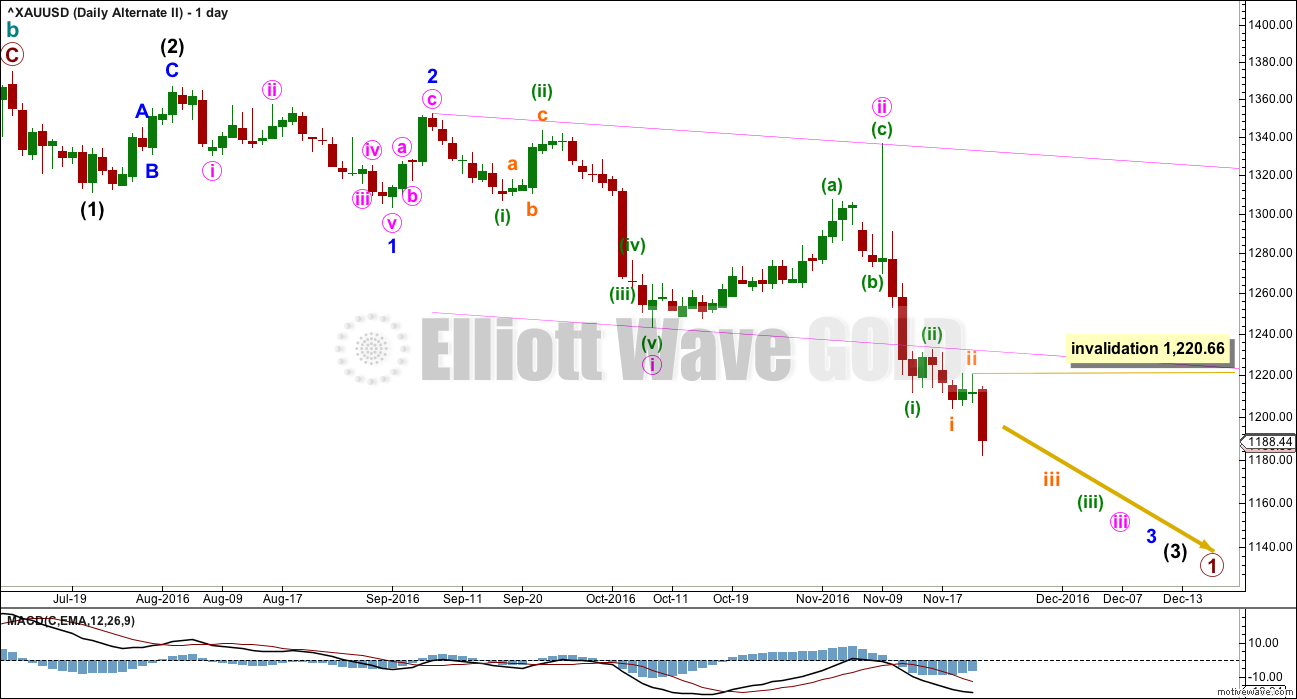
This alternate wave count also suffers from the same problems at the monthly chart level as the first alternate above. Seeing cycle wave a downwards as a five wave structure has problems of proportion and unusual behaviour with a base channel.
However, all possibilities should be considered.
What if a new bear market is underway for cycle wave c? The most likely structure would be an impulse. At this stage, price may be close to the middle of a third wave within primary wave 1 down.
This wave count has a problem of proportion at the daily chart level also: minute wave ii lasted 23 sessions and intermediate wave (2) three degrees higher lasted just 8 sessions. Lower degree corrections should be more brief than higher degree corrections. This is not always the case, but when the duration is substantially different then it must necessarily reduce the probability of the wave count.
The pink channel here is a base channel about minute waves i and ii. Price should continue to find resistance at the lower edge of the base channel now that it has breached the channel.
Within the middle of the third wave, no second wave correction may move beyond the start of its first wave above 1,220.66.
SECOND ALTERNATE HOURLY ELLIOTT WAVE COUNT
Click chart to enlarge.
If an impulse is developing downwards, then the third wave within it would still be incomplete.
Micro wave 5 to end subminuette wave iii may be a strong swift extended wave.
At 1,146 subminuette wave iii would reach 2.618 the length of subminuette wave i.
Within subminuette wave iii, the correction for micro wave 4 may not move into micro wave 1 price territory above 1,206.77.
TECHNICAL ANALYSIS
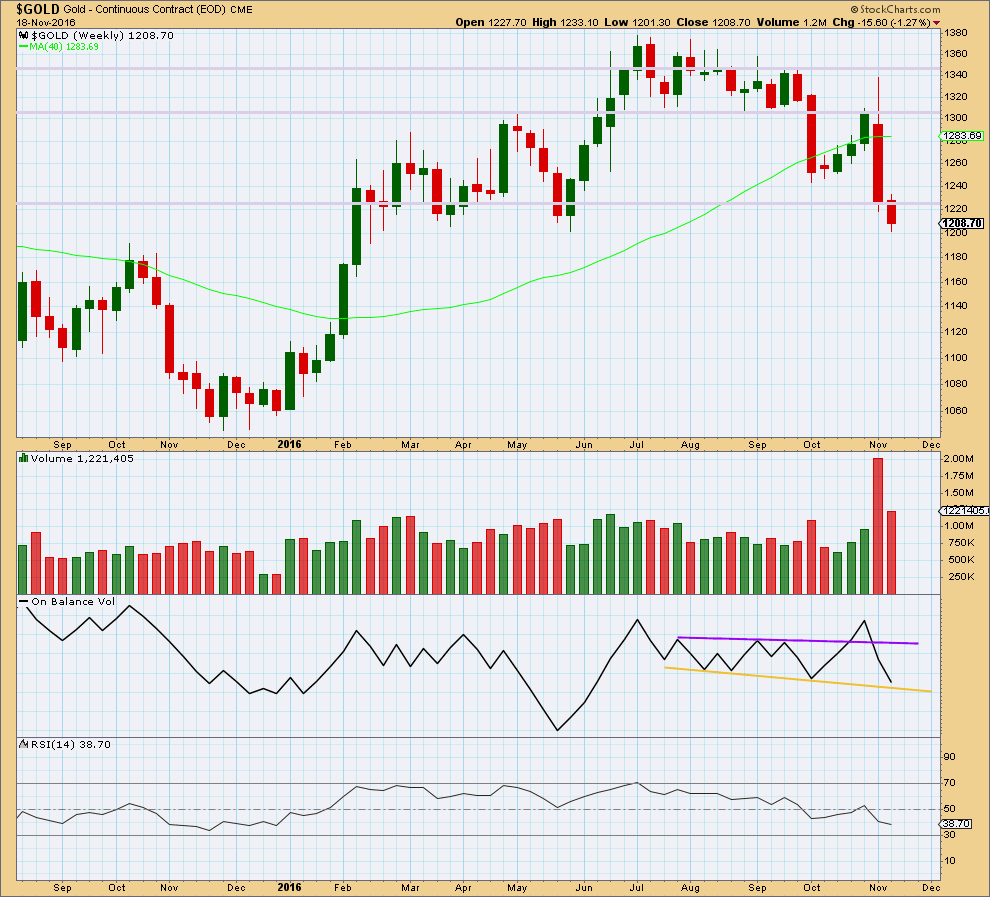
WEEKLY CHART
Click chart to enlarge. Chart courtesy of StockCharts.com.
Last week completes with a smaller range and a substantial decline in volume. The fall in price is not supported by volume, so it is suspicious. It looks like bears are tired.
Price may find support here about 1,200.
On Balance Volume has come down to almost touch the yellow support line. There is a very little room for more downwards movement. This line should be expected to provide support and assist to halt the fall in price either here or very soon.
RSI is not extreme and does not exhibit divergence with price. There is room still for price to fall further.
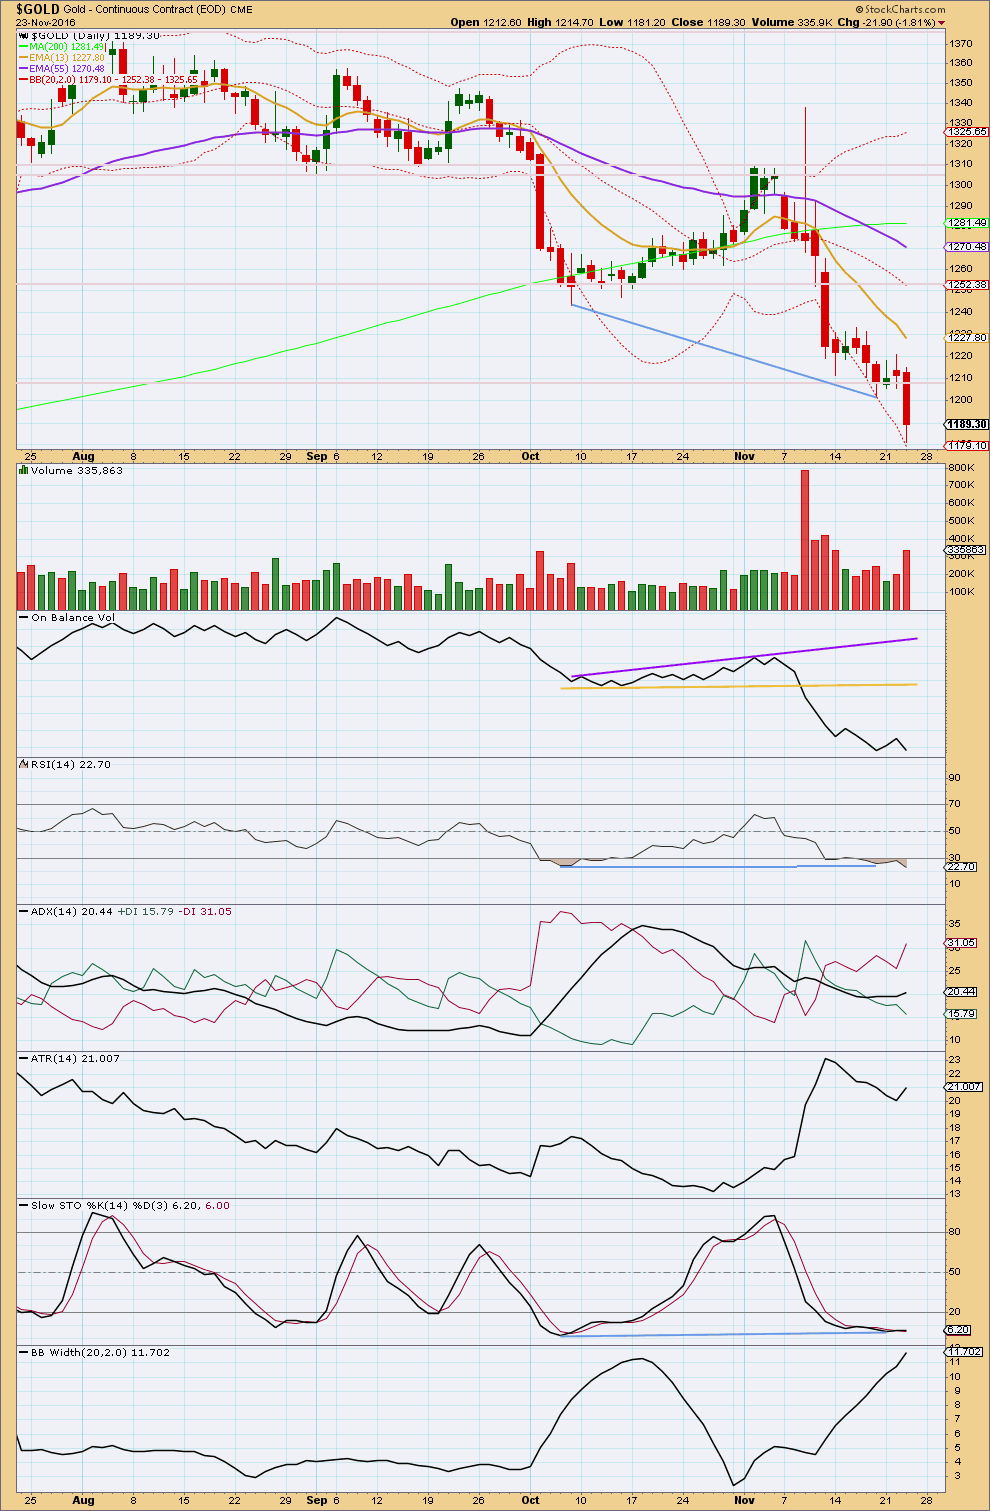
DAILY CHART
Click chart to enlarge. Chart courtesy of StockCharts.com.
Today’s downwards day has support from volume.
The long lower wick is bullish. The lower wick ends at the lower edge of Bollinger Bands, but that does not mean a bounce should be expected right here. Price can remain at the extreme range of Bollinger Bands for several days when this market is trending.
There is some small divergence today with price and On Balance Volume: price has made a lower low, but OBV has made essentially an even low. This small divergence is bullish, but it is not enough for a strong warning.
The bullish divergence noted in last analysis with price and RSI has now disappeared. RSI today made a new low below the prior major swing low of the 7th of October. RSI may remain extreme for some time during a trending market, so there is room for further downwards movement here. With no short nor mid term divergence between RSI and price today, this indicator is not giving any warning of a low in place here.
There is though mid and short term divergence today between price and Stochastics. Stochastics had the last low on the 21st of November and today it has a slightly higher low. The low for Stochastics of the 6th of October has still not been exceeded, yet price has made lower lows. This is regular bullish divergence and indicates some weakness in price.
It would be clearer if RSI also exhibited mid or short term divergence. The fact that it does not does not mean price must continue lower. It is just a warning that the new alternate Elliott wave count must be taken seriously.
ADX is increasing. ATR is today increasing and Bollinger Bands are widening. All three of these indicators are today in agreement that this market is trending downwards.
Price is below both the short and mid term moving averages, and both are pointing downwards. The mid term trend is down. The long term trend may still be up though as the 200 day moving average is still pointing upwards.
This analysis is published @ 07:45 p.m. EST.
A very quiet session with Gold moving sideways in a very small range. Importantly during the session a very slight new low was made.
It looks like a fourth wave triangle is completing. I’ll be expecting a downwards breakout and a final fifth wave down to complete.
Gold’s fifth waves can be strong, but fifth waves out of fourth wave triangles usually are surprisingly short.
Lara, this was posted on Gold Eagle so is public domain. Does it have any merit?
Thanks
http://www.gold-eagle.com/sites/default/files/images/ewave112216-3.png
Yes, it certainly does.
It meets all rules and looks pretty good.
I have this idea also charted with some small differences. But the idea is the same; an impulse up complete and a double zigzag down unfolding for a second wave correction.
Because it doesn’t differ much from the main wave count I haven’t published it regularly.
Except it sees the correction from July as a big wave 2 and clear blue skies from March 2017 onwards.
Here is the bigger picture.
http://www.gold-eagle.com/sites/default/files/images/ewave112216-4.png
Something to keep in mind:
The bottom in gold last year was on Thursday, Dec 3, one week from now
The Fed raised rates for the first time in years on Dec 16, 2015 and has not raised rates since
Maybe history repeats this year with gold bottoming very soon and the Fed raising rates again in December?
For those interested, another Gann Global video. Note that this “correction” is now the longest of 39 since 1968. James Flannigan is starting to feel that this may be more than a normal correction.
His final stop for gold stocks is based on the XAU Index. His stop is @ 73.89. Today that index closed @ 78.92
Caution for longs, but could be a great buying opportunity. Time will tell.
http://www.gannglobal.com/webinar/2016/November/GGF/16-11-GGF-Video4.php?inf_contact_key=df2a6cf54c1da67cc070c3570b823f957e171b2db13d1246f8aeeda2f577df3e
Real short public EWI video on Silver sentiment. EWI notes that Silver sentiment is at levels of previous lows.
http://www.elliottwave.com/Metals/COTD-Silver-Sentiment-Looks-Golden?sc_camp=65448C59A84E4C7A830CA970747B22EF
Volume supported the sharp gap down in GDX today. Price just barely stayed above the invalidation point.
If price moves below 20.13 on Friday, then it’s likely that Intermediate Wave A is continuing to complete a 5 wave structure down. When Intermediate wave A ends, a bounce for Int wave B followed by Int wave C down would be expected.
Hope your Holiday treats you better than Gold is treating us….
Have a wonderful Thanks Giving Dreamer.
Thank you for the charts.