
A very quiet sideways session while New York is closed for Thanksgiving Day includes a slight new low. This makes a difference to the short term picture for the main Elliott wave count.
Summary: A small fourth wave triangle is ending. It should be followed by a short sharp thrust downwards to about 1,170. Thereafter, expect a reversal.
New updates to this analysis are in bold.
Grand SuperCycle analysis is here.
Last monthly and weekly charts are here.
DAILY ELLIOTT WAVE COUNT
Click chart to enlarge.
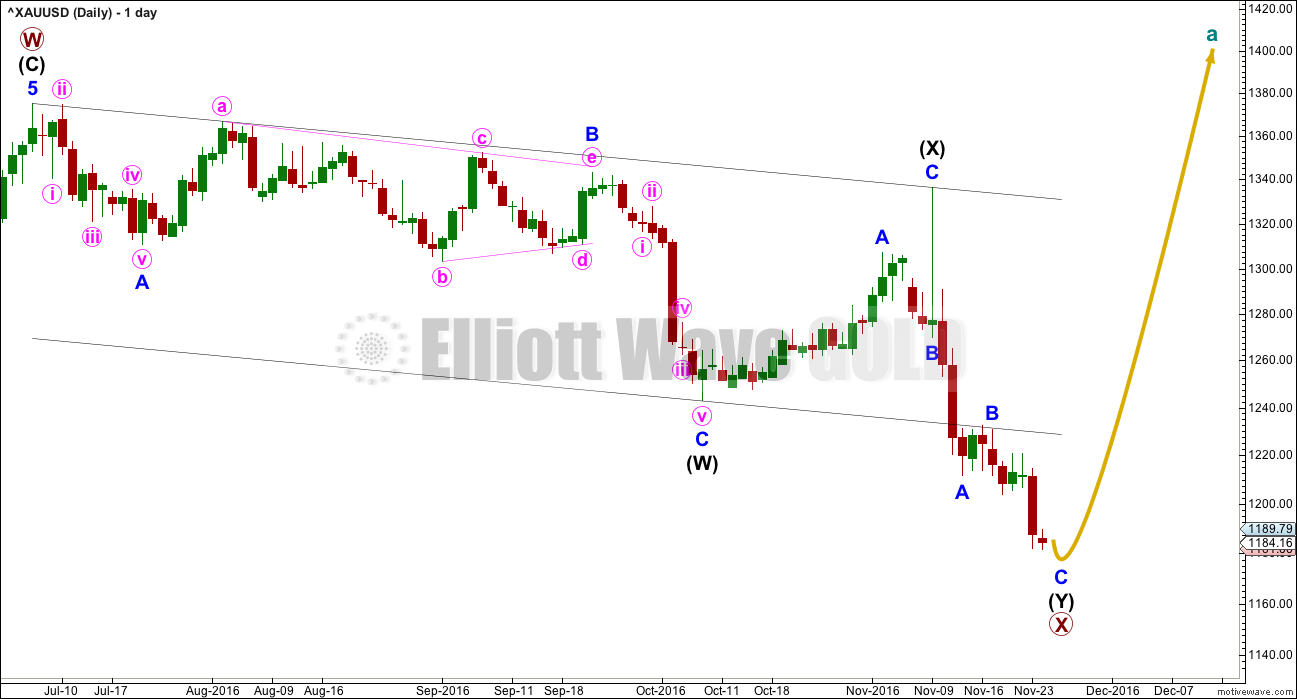
The larger structure of primary wave X may be either a double zigzag or a double combination. The second structure in this double for primary wave Y may be either a zigzag (for a double zigzag) or a flat or a triangle (for a double combination).
It is my judgement at this stage that it is more likely primary wave X will be a double zigzag due to the relatively shallow correction of intermediate wave (X). Although intermediate wave (X) is deep at 0.71 the length of intermediate wave (W), this is comfortably less than the 0.9 minimum requirement for a flat correction. Within combinations the X wave is most often very deep and looks like a B wave within a flat.
However, there is no minimum nor maximum requirement for X waves within combinations, so both a double zigzag and double combination must be understood to be possible. A double zigzag is more likely and that is how this analysis shall proceed.
Within the second structure, minor wave A should be a five wave structure. This now looks complete.
Minor wave B found resistance at the lower edge of the wide parallel channel about primary wave X. Minor wave C may now be almost complete at the hourly chart level.
HOURLY ELLIOTT WAVE COUNT
Click chart to enlarge.
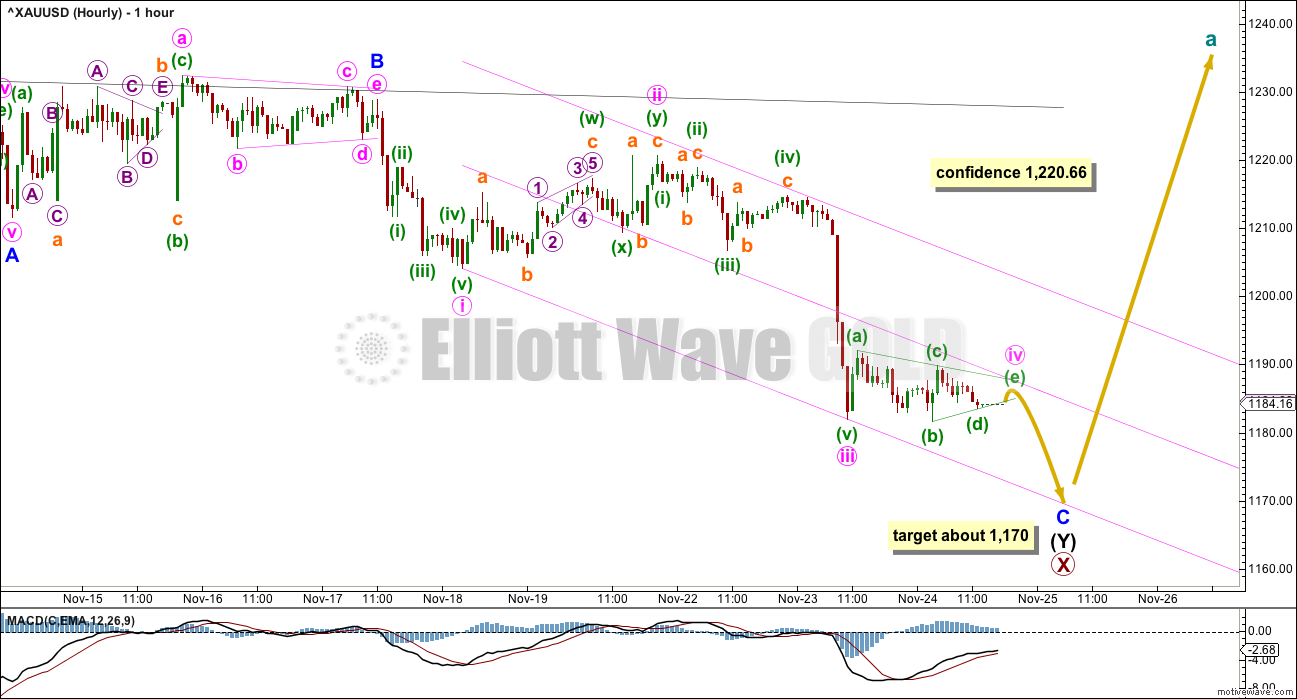
With a fourth wave triangle looking like it is unfolding this session, the analysis of minor waves B and C is changed.
Minor wave B is reverted to a triangle, as originally seen as it ended. This is supported by MACD hovering on the zero line as it unfolded.
Minor wave C must subdivide as a five wave structure. It looks like it is unfolding as an impulse.
Within minor wave C, there is perfect alternation between the double zigzag of minute wave ii and the triangle unfolding for minute wave iv.
Minute wave iii is just 1.48 short of 1.618 the length of minute wave i. Within minute wave iii, the fifth wave is a swift strong extension; this looks very typical for Gold.
So far this wave count now follows most typical behaviour and structure for Gold.
If a small fourth wave triangle is completing, then a final short sharp thrust downwards for a fifth wave should follow. Gold’s fifth waves out of its fourth wave triangles are often surprisingly short. Minute wave v may be expected to be about 0.618 the length of minute wave i, which would see it end close to 1,170.
If this wave count unfolds as expected, then after minute wave v is complete a reversal should be expected. How high the next wave goes and the structure it takes may indicate which daily Elliott wave count is correct.
ALTERNATE DAILY ELLIOTT WAVE COUNT
Click chart to enlarge.
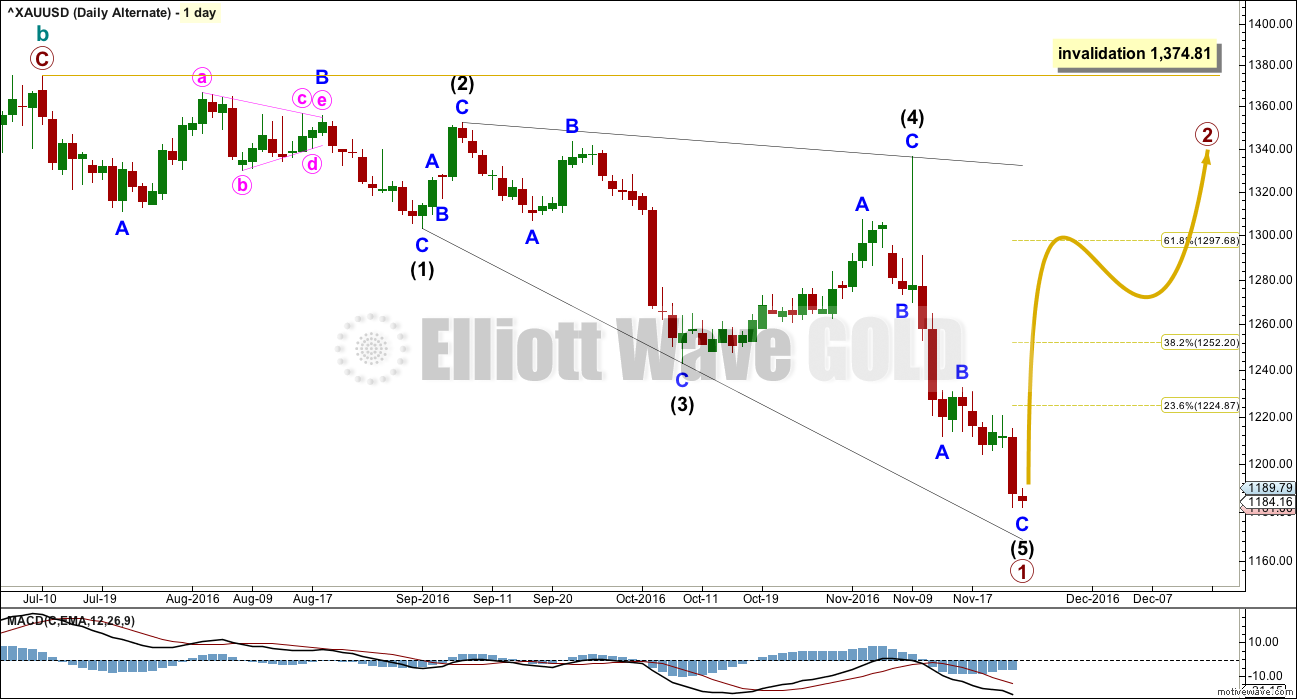
This alternate wave count expects that the large upwards zigzag from the low of 1,046 in December 2015 to the last high of 1,374 in July 2016 is a complete correction. The trend is still down; Gold is still in a bear market.
If there has been a cycle degree trend change at the high labelled cycle wave b, then the new wave down must begin with a five wave structure. At this stage, there looks to be too much overlapping for an impulse, so a leading diagonal is considered.
Within leading diagonals, sub-waves 2 and 4 must subdivide as zigzags. Sub-waves 1, 3 and 5 are most commonly zigzags but sometimes may also appear to be impulses.
Within this structure, all sub-waves subdivide as zigzags. This wave count meets all Elliott wave rules. This diagonal looks correct.
This wave count has a lower probability at the daily chart level because leading diagonals are not very common structures for first waves. When first waves do subdivide as leading diagonals, they are most often contracting and not expanding. This wave count does not rely upon a rare structure, but it does rely upon a less common structure.
At the monthly chart level, if the zigzag up labelled cycle wave b is complete, then there are further implications. That means that the prior wave down to the low at 1,046 on December 2015 must be seen as a five wave impulse. This is possible, but it has a fairly low probability.
Primary wave 1 lasted 94 days. Primary wave 2 may initially be expected to last about a Fibonacci 55 or 89 days. It should be a big three wave structure.
At the hourly chart level, this alternate wave count would be essentially the same as the main hourly chart; minor wave C may still need one final fifth wave down to complete it.
At this stage, there is no divergence in expected direction between this alternate and the main wave count. The structure of upwards movement, if it is clearly a three or five, may assist to tell us which wave count is correct in coming weeks. For now this alternate must be judged to have a low probability due to the problems outlined. It is published to consider all possibilities.
SECOND ALTERNATE DAILY ELLIOTT WAVE COUNT
Click chart to enlarge.
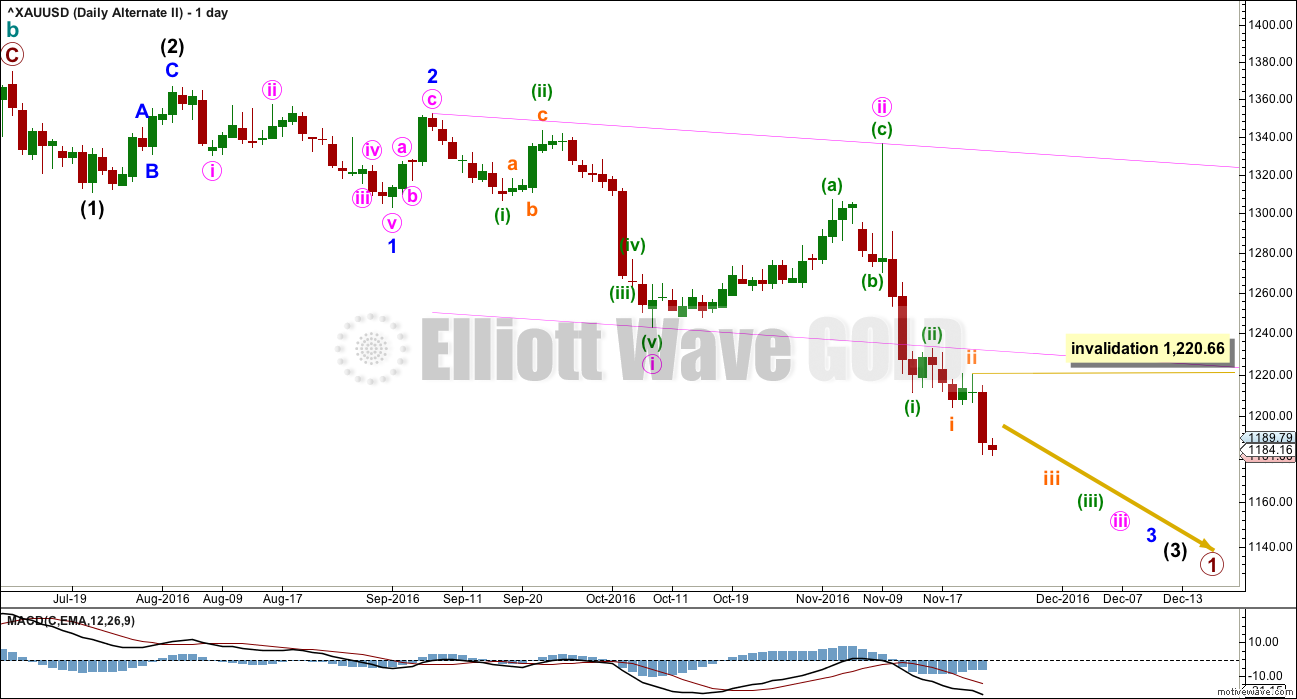
This alternate wave count also suffers from the same problems at the monthly chart level as the first alternate above. Seeing cycle wave a downwards as a five wave structure has problems of proportion and unusual behaviour with a base channel.
However, all possibilities should be considered.
What if a new bear market is underway for cycle wave c? The most likely structure would be an impulse. At this stage, price may be close to the middle of a third wave within primary wave 1 down.
This wave count has a problem of proportion at the daily chart level also: minute wave ii lasted 23 sessions and intermediate wave (2) three degrees higher lasted just 8 sessions. Lower degree corrections should be more brief than higher degree corrections. This is not always the case, but when the duration is substantially different then it must necessarily reduce the probability of the wave count.
The pink channel here is a base channel about minute waves i and ii. Price should continue to find resistance at the lower edge of the base channel now that it has breached the channel.
Within the middle of the third wave, no second wave correction may move beyond the start of its first wave above 1,220.66.
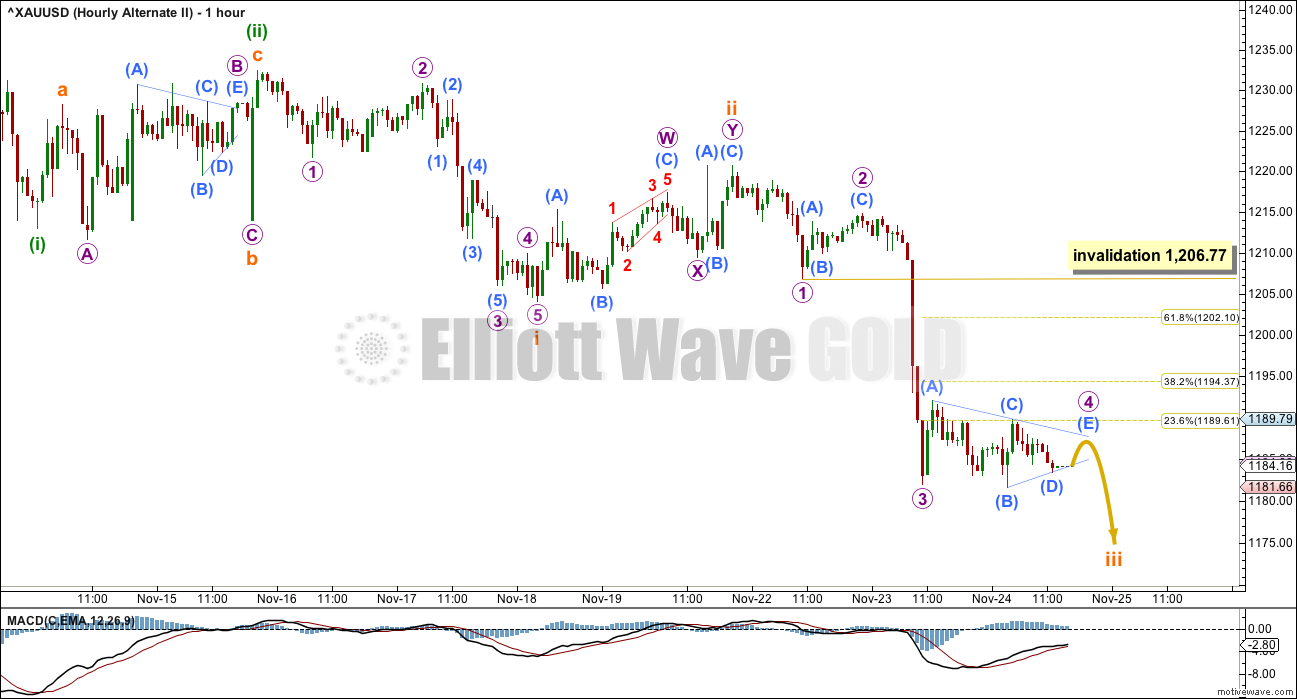
SECOND ALTERNATE HOURLY ELLIOTT WAVE COUNT
Click chart to enlarge.
If an impulse is developing downwards, then the third wave within it would still be incomplete.
If current sideways movement labelled as a triangle for micro wave 4 is correct, then micro wave 5 may be surprisingly short. If the triangle is invalidated, then micro wave 4 may morph into a combination, and then micro wave 5 may again be expected to be a longer stronger extension.
Submicro wave (E) may not move beyond the end of submicro wave (C) at 1,189.79 for the triangle to remain valid.
If the triangle remains valid, then micro wave 5 may be about even in length with micro wave 1 giving a target about 1,170.
If the triangle is invalidated and micro wave 4 completes as a different corrective structure, then the target for micro wave 5 should be lower. At 1,146 subminuette wave iii would reach 2.618 the length of subminuette wave i.
Within subminuette wave iii, the correction for micro wave 4 may not move into micro wave 1 price territory above 1,206.77.
TECHNICAL ANALYSIS
WEEKLY CHART
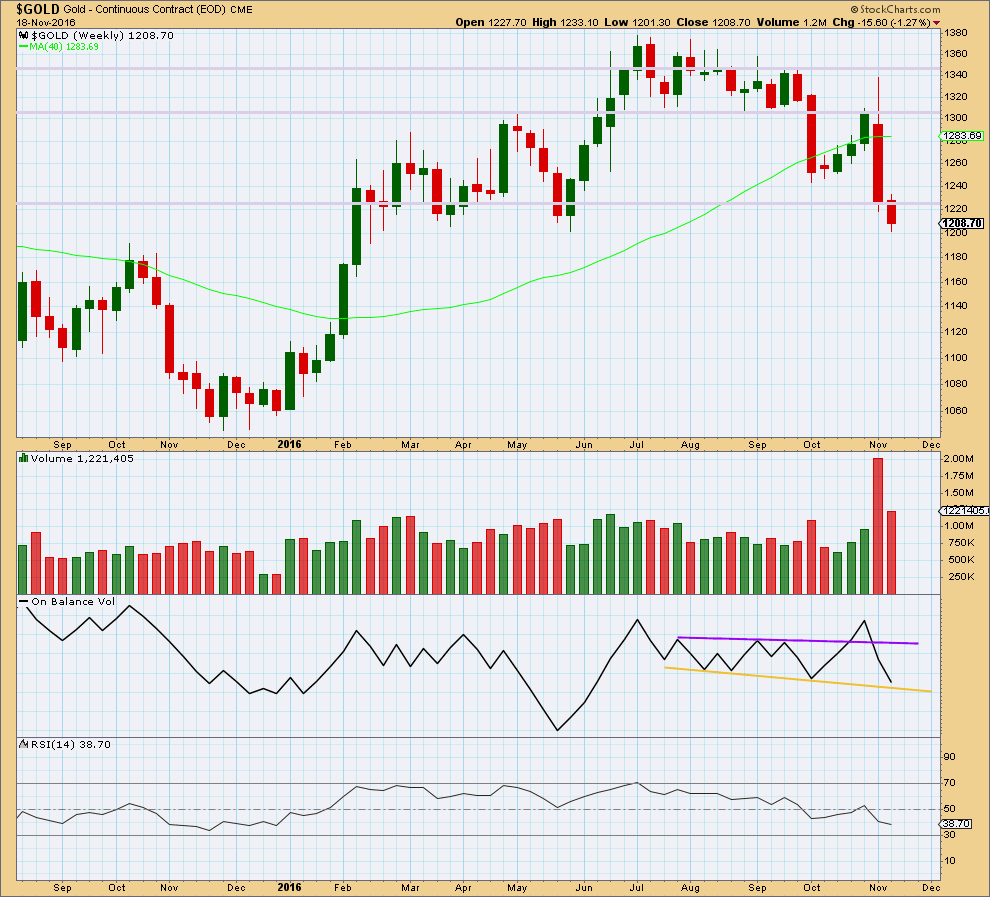
Click chart to enlarge. Chart courtesy of StockCharts.com.
Last week completes with a smaller range and a substantial decline in volume. The fall in price is not supported by volume, so it is suspicious. It looks like bears are tired.
Price may find support here about 1,200.
On Balance Volume has come down to almost touch the yellow support line. There is a very little room for more downwards movement. This line should be expected to provide support and assist to halt the fall in price either here or very soon.
RSI is not extreme and does not exhibit divergence with price. There is room still for price to fall further.
DAILY CHART
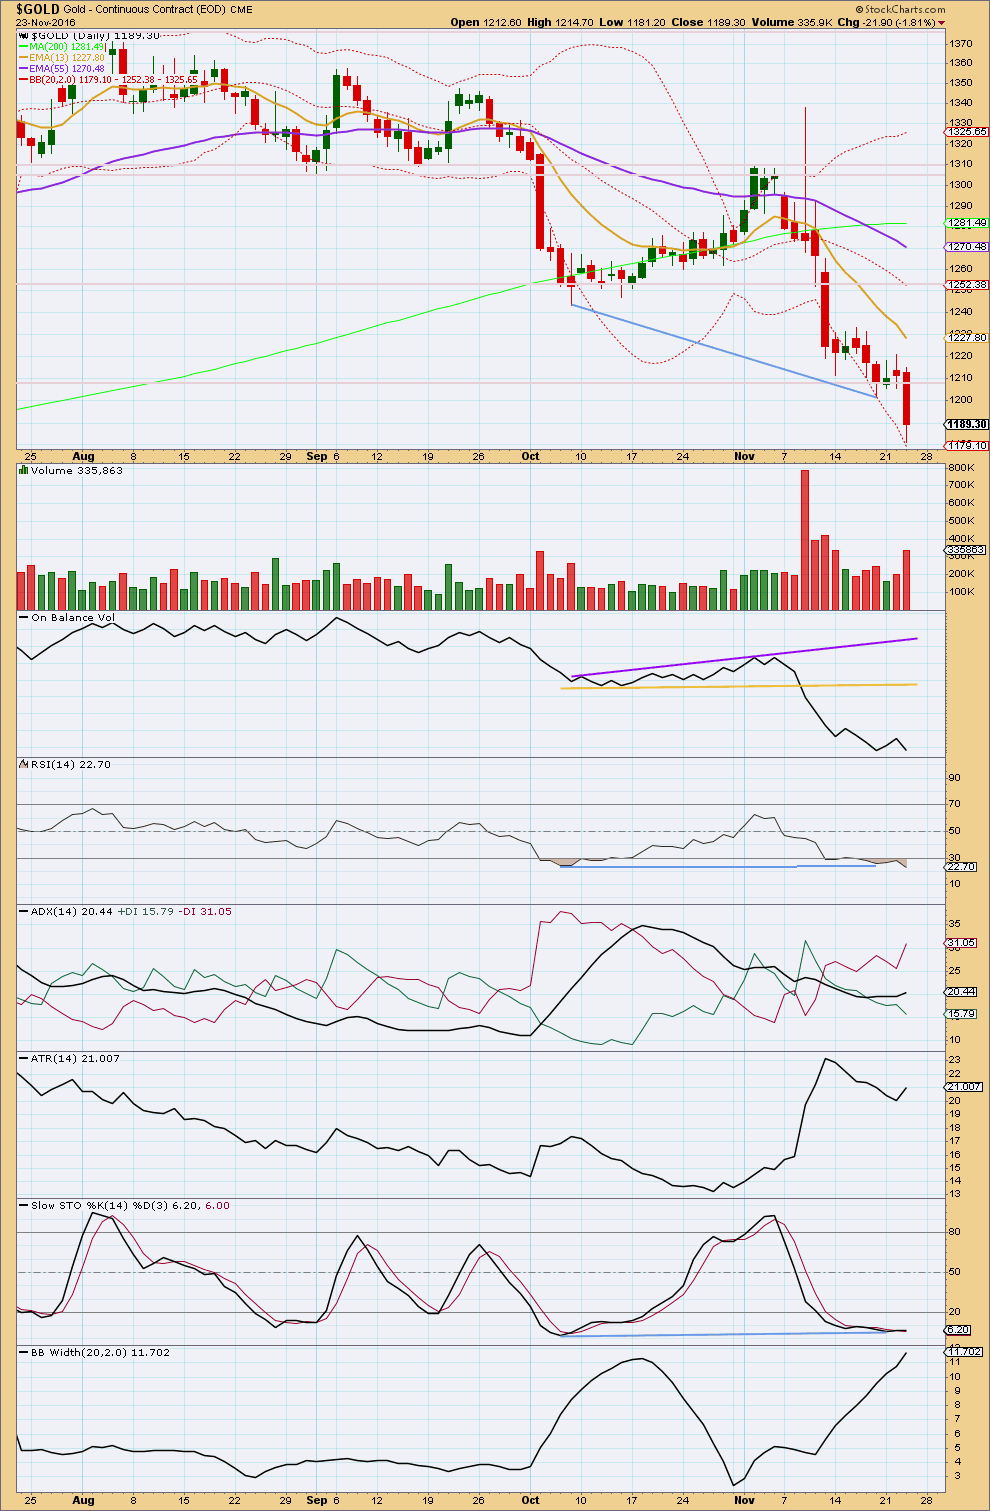
Click chart to enlarge. Chart courtesy of StockCharts.com.
StockCharts data for the Gold cash market is New York session only data. With the NYSE closed for Thanksgiving Day today, there is no new data to analyse.
Today’s downwards day has support from volume.
The long lower wick is bullish. The lower wick ends at the lower edge of Bollinger Bands, but that does not mean a bounce should be expected right here. Price can remain at the extreme range of Bollinger Bands for several days when this market is trending.
There is some small divergence today with price and On Balance Volume: price has made a lower low, but OBV has made essentially an even low. This small divergence is bullish, but it is not enough for a strong warning.
The bullish divergence noted in last analysis with price and RSI has now disappeared. RSI today made a new low below the prior major swing low of the 7th of October. RSI may remain extreme for some time during a trending market, so there is room for further downwards movement here. With no short nor mid term divergence between RSI and price today, this indicator is not giving any warning of a low in place here.
There is though mid and short term divergence today between price and Stochastics. Stochastics had the last low on the 21st of November and today it has a slightly higher low. The low for Stochastics of the 6th of October has still not been exceeded, yet price has made lower lows. This is regular bullish divergence and indicates some weakness in price.
It would be clearer if RSI also exhibited mid or short term divergence. The fact that it does not does not mean price must continue lower. It is just a warning that the new alternate Elliott wave count must be taken seriously.
ADX is increasing. ATR is today increasing and Bollinger Bands are widening. All three of these indicators are today in agreement that this market is trending downwards.
Price is below both the short and mid term moving averages, and both are pointing downwards. The mid term trend is down. The long term trend may still be up though as the 200 day moving average is still pointing upwards.
This analysis is published @ 06:02 p.m. EST.
This may be of interest.
Great chart, speaks volumes ;)…really, says a lot
Funny thing is I get a slightly downward obv in stock charts on a daily basis, yours is 60 min. Where did it come from?
It is as is hourly not daily OBV. Noticed a lot of volume buying of late. Buyers appear to building a big position when the sell side is loaded.
Thanks for the update. I do not know how to change fro daily to hourly, might be paid subscription? Another note is that while gold has dropped another 30 bucks or so, Gdxj has not gone lower, it appears to have made a low around nov 14 or so. I believe this bodes well for the juniors and Jnug.
Dermot, yes, you need a subscription for hourly, monthly, quarterly charts, etc. You can only do limited Daily and Weekly for free.
Sometimes you can look through the public chart lists and find a chart that you like that gets updated throughout the day.
http://stockcharts.com/public
If there’s been a turn then obviously we shouldn’t be seeing a new low below 1,172.10. At this stage a new low would be highly problematic for the wave count at the hourly chart level.
Short term a new high at least above 1,192.52 should be expected.
Once we can see a five up on the hourly chart I’d have a little more confidence in this main wave count.
My uncle wanted to buy a little with his brokerage account, I told him when I thought I saw an opportunity I would let him know. I just called and asked him to dabble in Jnug. He said he was too busy right now but went on to tell me how great stocks were doing….”I love it” he said. We are close to a turn in the stock/gold markets if this is a contrarian indicator.
“Be fearful when others are greedy and greedy when others are fearful”…warren buffet
Yep. Market participation should be high at the peak.
Hi Johno, JUST A VIEW: At CMP 1186-84 I would not be able to say if we are back in on a full-on bear market. I am new to trading, only been doing this for 2-3 yrs so learning as I go along. From CMP we could see Gold price pop up for 1215+. However, at this stage I do expect a break below 1166 to occur for lower. The bulls have been unconvincing on any rally up downwards from about 1368. On a weekly outlook basis, it appears that the 6 week moving average (1244) is poised to break below 1yr moving average (1242-43) pretty soon for a bearish crossover. I certainly don’t want to be long with that in mind. Besides, Gold price is presently well below the 20dma/50dma/100dma/200dma. Keeping that in mind it gives me a sense that Gold price will most likely drop below 1166 for 1123/1102. Obviously Lara’s day to day analysis helps lay out the various possibilities of what Gold price may do. Beyond that it is really up to individual trader how they trade for the day or longer term. I have been shorting since 1368!. GL to all of us and may we all have a profitable trade…. 🙂 p.s. I think we may eventually see Gold price down to 1036/1032 sooner than expected lol
It has been quite some time since gold bulls have been offered such a low-risk entry point. We are now even more oversold than in January. Jeff Clark points out that the COT have the commercials now down to under 200,000.00 short contracts and 100,000.00 to 150,000.00 is the number that usually signals a bottom. I actually jumped a bit early last week when I closed out some bearish call spreads and opened some bullish put spreads. I think a low is very close.
Good morning Verne. That would be good news. The latest gold Cot report has the short position at about 315k short. It is reported every Friday, so he wouldn’t have access to it yet for this tues. since Thursday was a holiday it will be reported Monday if past procedure is prologue. Can you share the link you got from Jeff Clark?. Perhaps he meant net short? We are net short about 200 k as of last COT report. Even though the latest report was 315k short we may be lower, much lower if the commercials keep covering there short positions as they did last week when gold dropped. (45k lopped off short position according to last Friday’s report.).
My guess is that the commercials have increased there longs and decreased shorts, which is bullish. Agree we could be close here barring any unforeseen events, quite possibly happened last nite at 1170, the 61.8 decline from first wave up. Cheers
Wow… Gold ate a little too much turkey and got sleepy. Went down for a little nap and woke up feeling really refreshed. Too early to know if the bottom is in, but at least it zoomed up above Lara’s first confidence level of 1,186.44!
Nice 🙂
I have a profit for today so all is good.
Not sure if this link will work for you all, but if it does you can see how awesome is the place in which I am lucky enough to live. Mangawhai.
Good video. Very beautiful. Thanks for sharing!
Lara Thanks for sharing. Mother Earth is very beautiful. Hope we keep it this way and peaceful.
Lara, stop teasing us. ;). Very hard to become a NZ citizen. Need trainig on how to use no. 8 wire, or is that no. 6?
I don’t think they make No. 8 wire anymore?
If you have a bit of cash it’s actually easy to become a NZ citizen.
It’s really easy I think to get a working visa. Once you’re here it’s pretty uncomplicated to begin the residency process.
It is naturally beautiful, but we do have our share of problems. Low wages and entrenched poverty, increasing inequality…. and a housing market bubble ready to pop any day.
Mangawhai is a nice little bubble of niceness. Mostly.
Lara nailed that last thrust down to about 1170 quite well 🙂
Thank you.
But still… not good enough after missing the last two moves down.
I have a small short term buy which is nicely positive and I may close that before I retire for the evening. Taking a profit never hurt. Making up for some losses.
GDX last stand for the bulls?
Dreamer, excellent charts as always.
With strong support here a short term bounce at least should be expected.
Gold’s last stand for the bulls?
Thanks for Lara’s quick update. Not expecting Gold price to get back up past 1182-86 (to correct some oversold) as a good place to add on some more shorts; IMO looking out for downside 1125/1102 given enough time. Lets see how this plays out. GL all and have a good weekend! / Its great to have Lara’s continued guidance and fantastic analysis…. 🙂
Thank you Syed 🙂
Short term a small bounce to last a few more hours looks likely at least. I may take this opportunity to make a short term profit here.
Syed, in recent times you have tended to be more bearish than most and more right than most. In order for another substantial leg down to materialise, you must believe we are back in a full-on bear market. Is that the case?
The commercials on Monday will give a good indication how close we are. Let’s see how much they went long and short. Usually cots reported fri, but with a holiday they will do next week, at least have in the past….guessing they sold another 25-35 k shorts and went long 20k or so….
It appears there is a lot of open interest for GLD that will expire worthless tomorrow about 115 or so. I know there was a person here that used to provide that data. Still around?
He or she may be too busy eating Thanks Giving turkey Dermot 🙂
Well, the primary wave count would finish up at about 1170 where it is about now
If the shares hold up well or make a nominal new low about 170 on the hui; then this could be the finish of 2 down (1375 to 1170)after the 1 up from (1050 to 1375.) Bears careful watching tomorrow…..Happy thanksgiving all? let’s see if gold is done being a turkey.
I have the triangle ending and the fifth wave of subminuette v beginning at 1,186.44.
If it’s over now then subminuette v is just 1.01 short of 0.618 X subminuette i.
There would be good Fibonacci ratios between all subminuette waves.
A new high now above 1,186.44 would add a little confidence in a trend change; at that stage if this is correctly identified as the start of the fifth wave down then upwards movement could not be a second wave correction, and so subminuette v would have to be over.
If that happens then I’ll be looking for an entry point to go long.
Hi Lara. I’m not up to speed on other markets I can trade gold and other commodities after the market closes here in the u.s . Any ideas. I would have like to bought some gold at 1170. …guessing it will close ny at about 1200 – 1205 to expire contracts around that point worthless, at least on Gld that is where the concentration is.
It happens.
1188.60 in the morning hours in europe.