A short, sharp wave down to about 1,170 was expected for Friday’s session. This is what happened. Downwards movement reached 1,172.10 before reversing.
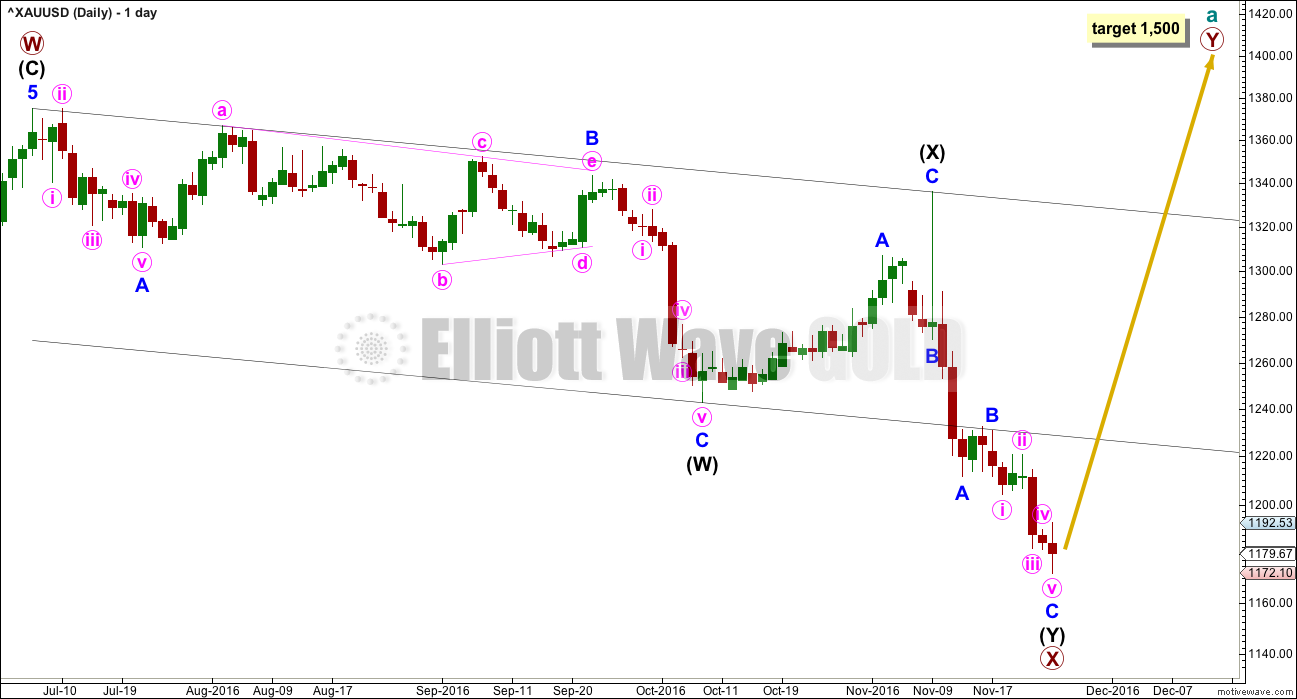
Summary: Gold is in a downwards trend. The main Elliott wave count has little support from classic technical analysis, but it has the best fit and it expects a trend reversal next week with a green daily candlestick for Monday. The target for a six month long wave up is 1,500 and some confidence may be had in this if price makes a new high above 1,192.52, and thereafter further confidence above 1,220.66. The second alternate wave count expects an increase in downwards momentum with the short term target at 1,146. A little confidence may be had in this if price makes a new low below 1,172.10.
New updates to this analysis are in bold.
Grand SuperCycle analysis is here.
Last monthly and weekly charts are here.
DAILY ELLIOTT WAVE COUNT
The larger structure of primary wave X may be either a double zigzag or a double combination. The second structure in this double for primary wave Y may be either a zigzag (for a double zigzag) or a flat or a triangle (for a double combination).
It is my judgement at this stage that it is more likely primary wave X will be a double zigzag due to the relatively shallow correction of intermediate wave (X). Although intermediate wave (X) is deep at 0.71 the length of intermediate wave (W), this is comfortably less than the 0.9 minimum requirement for a flat correction. Within combinations the X wave is most often very deep and looks like a B wave within a flat.
However, there is no minimum nor maximum requirement for X waves within combinations, so both a double zigzag and double combination must be understood to be possible. A double zigzag is more likely and that is how this analysis shall proceed.
Within the second structure, minor wave A should be a five wave structure. This now looks complete.
Minor wave B found resistance at the lower edge of the wide parallel channel about primary wave X. Along the way up, price may find resistance at the lower edge of this channel.
Minor wave C may now be complete at the hourly chart level.
HOURLY ELLIOTT WAVE COUNT
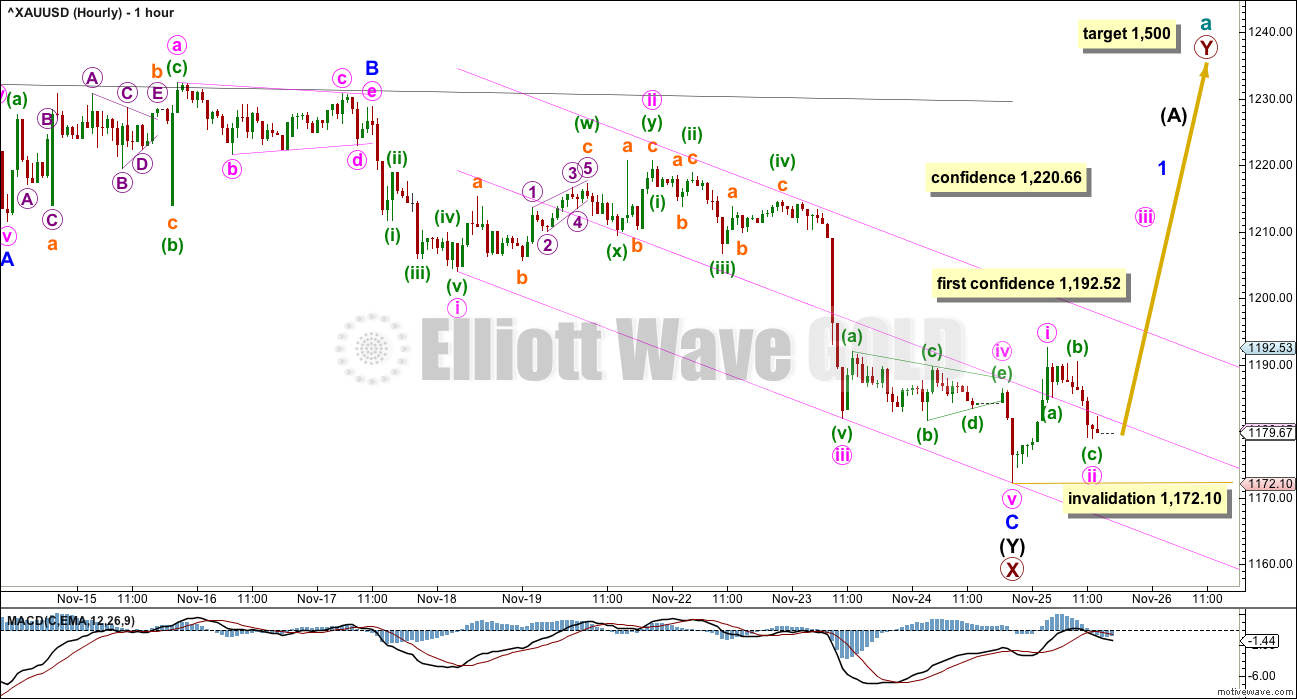
Within minor wave C, there is perfect alternation between the double zigzag of minute wave ii and the triangle unfolding for minute wave iv.
Minute wave iii is just 1.48 short of 1.618 the length of minute wave i. Within minute wave iii, the fifth wave is a swift strong extension; this looks very typical for Gold.
Minute wave v is now complete and 1.01 short of 0.618 the length of minute wave i. Minute wave v ended perfectly at the lower edge of the Elliott channel.
Minute wave ii looks likely to be complete. Upwards movement is expected for Monday. If minute wave ii continues any lower, it may not move beyond the start of minute wave i below 1,172.10.
ALTERNATE DAILY ELLIOTT WAVE COUNT
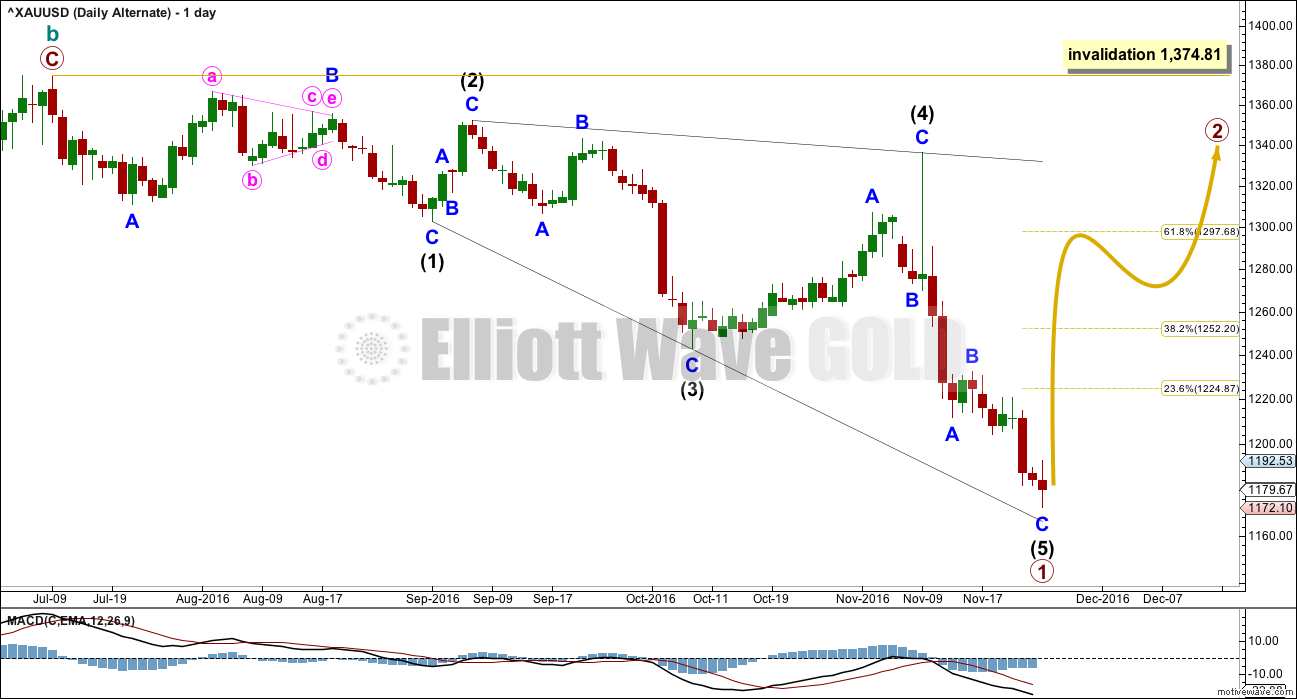
This alternate wave count expects that the large upwards zigzag from the low of 1,046 in December 2015 to the last high of 1,374 in July 2016 is a complete correction. The trend is still down; Gold is still in a bear market.
If there has been a cycle degree trend change at the high labelled cycle wave b, then the new wave down must begin with a five wave structure. At this stage, there looks to be too much overlapping for an impulse, so a leading diagonal is considered.
Within leading diagonals, sub-waves 2 and 4 must subdivide as zigzags. Sub-waves 1, 3 and 5 are most commonly zigzags but sometimes may also appear to be impulses.
Within this structure, all sub-waves subdivide as zigzags. This wave count meets all Elliott wave rules. This diagonal looks correct.
This wave count has a lower probability at the daily chart level because leading diagonals are not very common structures for first waves. When first waves do subdivide as leading diagonals, they are most often contracting and not expanding. This wave count does not rely upon a rare structure, but it does rely upon a less common structure.
At the monthly chart level, if the zigzag up labelled cycle wave b is complete, then there are further implications. That means that the prior wave down to the low at 1,046 on December 2015 must be seen as a five wave impulse. This is possible, but it has a fairly low probability.
Primary wave 1 lasted 94 days. Primary wave 2 may initially be expected to last about a Fibonacci 55 or 89 days. It should be a big three wave structure.
At the hourly chart level, this alternate wave count would be essentially the same as the main hourly chart; minor wave C may now be complete.
At this stage, there is no divergence in expected direction between this alternate and the main wave count. The structure of upwards movement, if it is clearly a three or five, may assist to tell us which wave count is correct in coming weeks. For now this alternate must be judged to have a low probability due to the problems outlined. It is published to consider all possibilities.
SECOND ALTERNATE DAILY ELLIOTT WAVE COUNT
This alternate wave count also suffers from the same problems at the monthly chart level as the first alternate above. Seeing cycle wave a downwards as a five wave structure has problems of proportion and unusual behaviour with a base channel.
However, all possibilities should be considered.
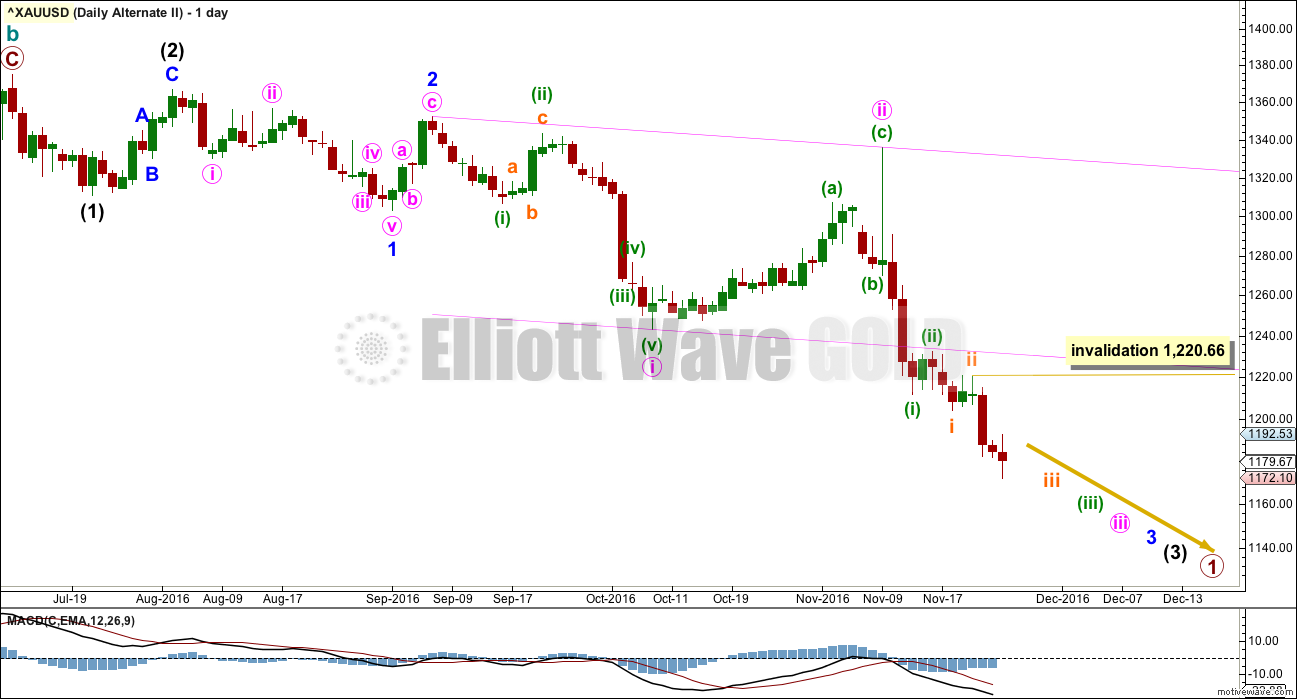
What if a new bear market is underway for cycle wave c? The most likely structure would be an impulse. At this stage, price may be close to the middle of a third wave within primary wave 1 down.
This wave count has a problem of proportion at the daily chart level also: minute wave ii lasted 23 sessions and intermediate wave (2) three degrees higher lasted just 8 sessions. Lower degree corrections should be more brief than higher degree corrections. This is not always the case, but when the duration is substantially different then it must necessarily reduce the probability of the wave count.
The pink channel here is a base channel about minute waves i and ii. Price should continue to find resistance at the lower edge of the base channel now that it has breached the channel.
Within the middle of the third wave, no second wave correction may move beyond the start of its first wave above 1,220.66.
SECOND ALTERNATE HOURLY ELLIOTT WAVE COUNT
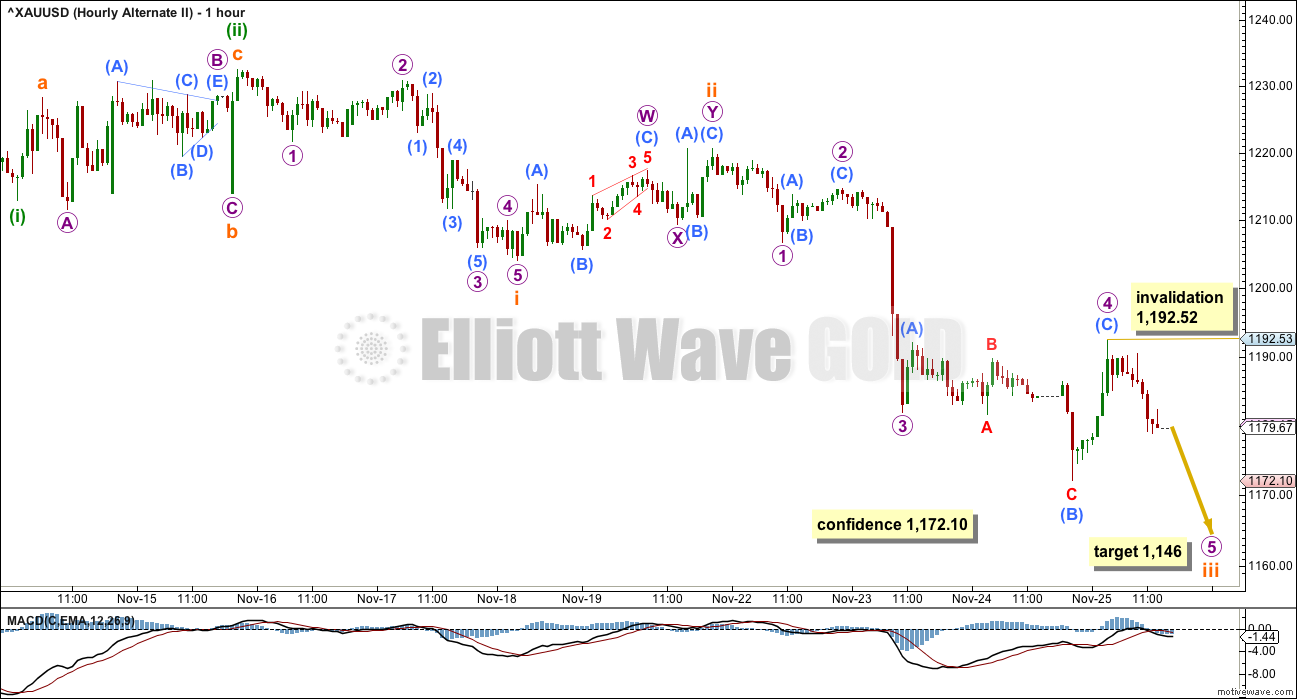
If an impulse is developing downwards, then the third wave within it would still be incomplete.
At 1,146 subminuette wave iii would reach 2.618 the length of subminuette wave i.
Micro wave 4 may have completed as an expanded flat. Micro wave 5 may be a long strong extension, which is typical of Gold’s fifth waves to end its third waves.
Within micro wave 5, no second wave correction may move beyond its first wave above 1,192.52.
TECHNICAL ANALYSIS
WEEKLY CHART
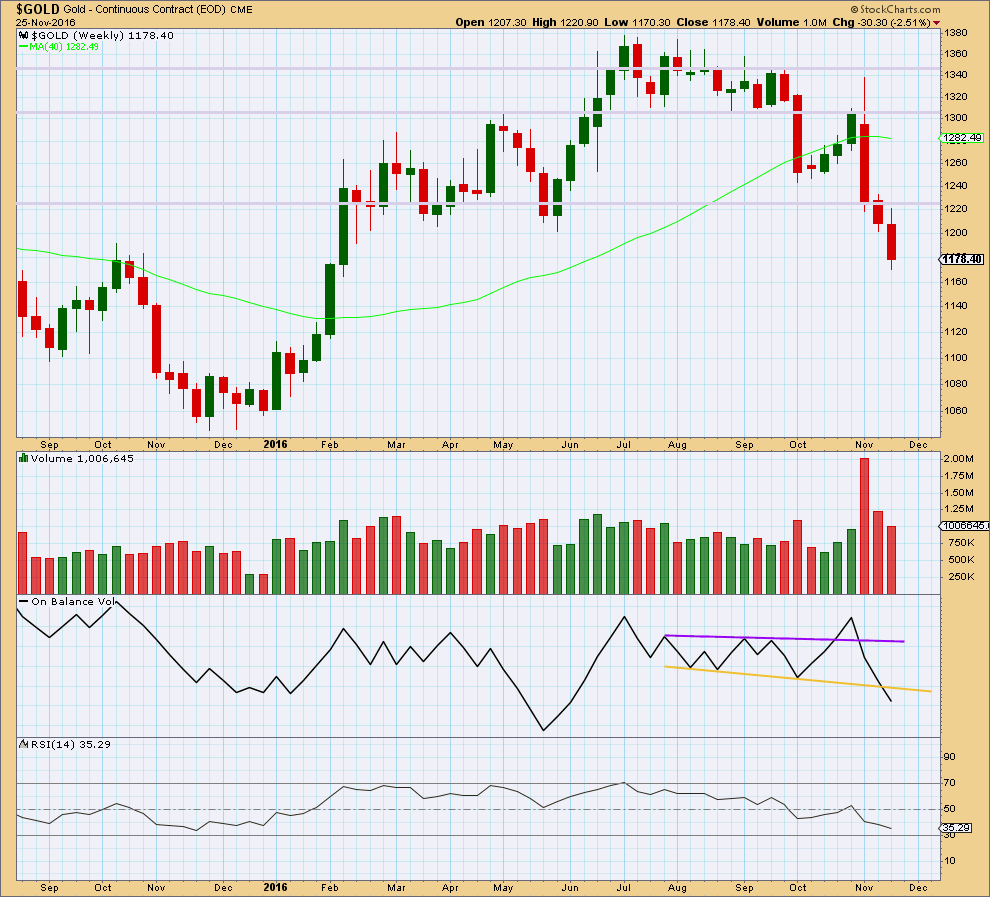
Click chart to enlarge. Chart courtesy of StockCharts.com.
Another downwards week comes with a further decline in volume. The fall in price is not supported by volume, so it should be suspicious.
On Balance Volume this week breaks below the yellow support line. This is a strong bearish signal that supports the second alternate Elliott wave count.
There is no divergence between price and RSI at the weekly chart level to indicate weakness. RSI is not yet extreme. There is room still for price to fall further.
DAILY CHART
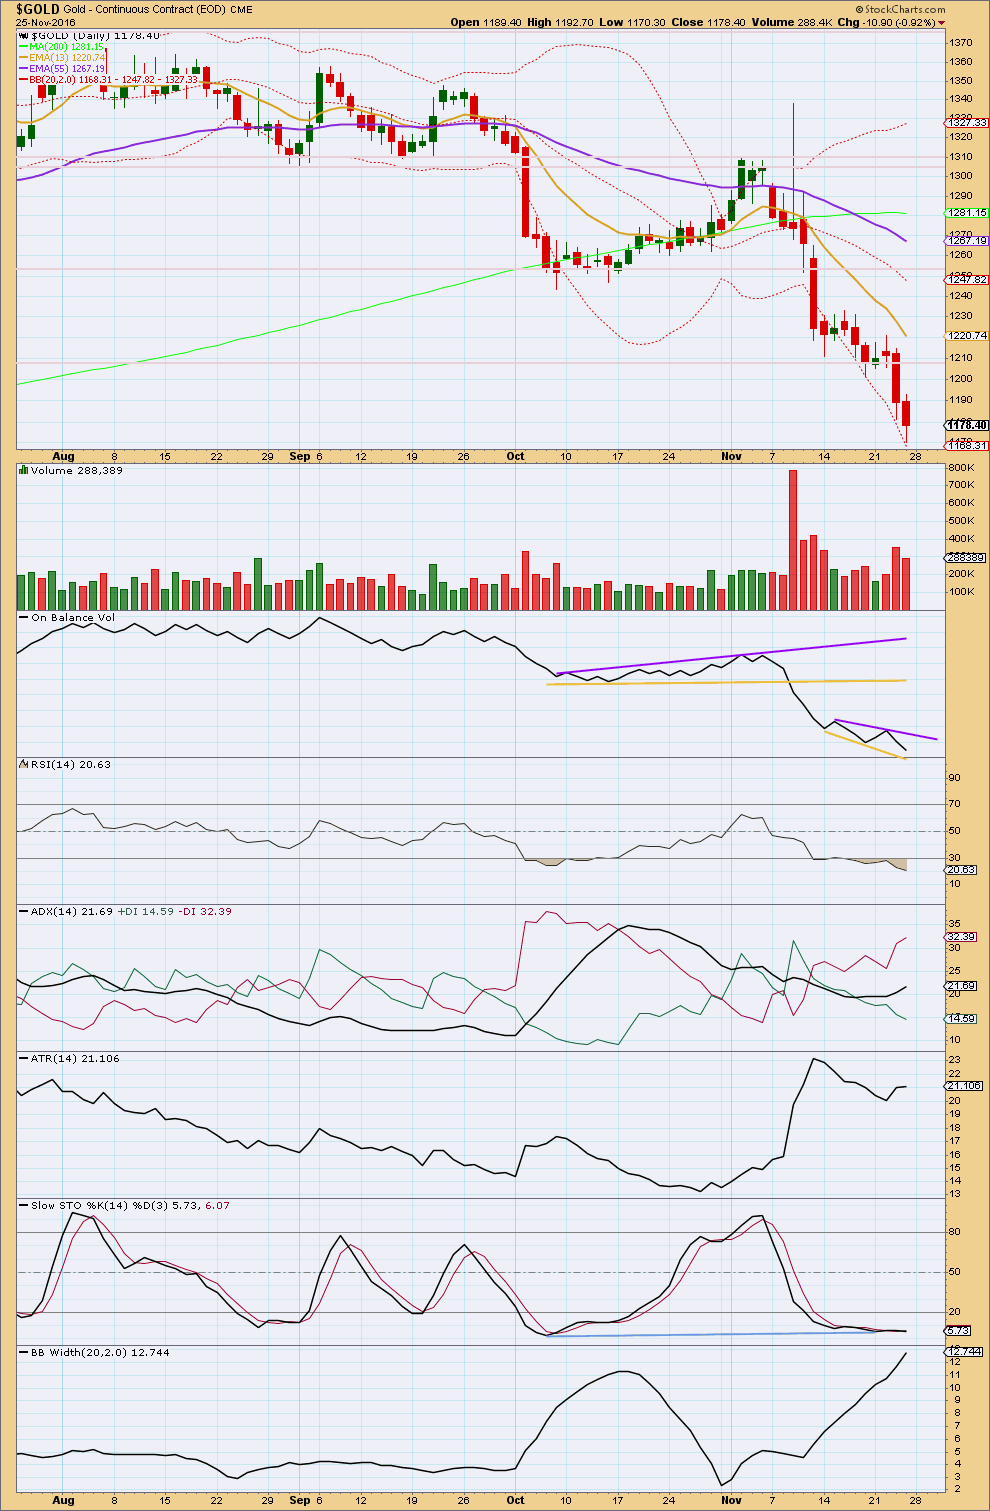
Click chart to enlarge. Chart courtesy of StockCharts.com.
Another downwards day has a low on the lower edge of Bollinger Bands. A decline in volume for Friday’s session indicates bears are tiring. But volume is still heavier than four of the five prior downwards days, so it is possible still that price could fall further.
New trend lines are drawn now on On Balance Volume. These lines do not yet have good technical significance. There is no divergence between price and OBV to indicate weakness.
The bullish divergence between price and RSI has disappeared. There is no short nor mid term divergence between price and RSI to indicate weakness.
ADX still indicates a downwards trend is in place. ADX is not yet extreme.
ATR may be beginning to agree with ADX. It now has two days in a row of some increase.
Bollinger Bands continue to widen indicating a downwards trend is in place.
There is now double divergence with price and Stochastics, both mid and short term: price for Friday made a new low, but Stochastics moved slightly higher. This oscillator can remain extreme for reasonable periods of time during a trending market; divergence is a warning of weakness and not a signal of a trend change.
This classic technical analysis picture is very bearish. The only warning that this trend may be coming to an end is Stochastics.
This analysis is published @ 07:55 p.m. EST.

Cots came in today, 25 k lopped off shorts but 17 k off longs too….this is at tues prices of 1215 or so. Since then we went down about 40 bucks before we started bouncing… tough to tell if 1170 holds. I’m guessing the commercials took off another quite a few shorts on the latest move down to 1170. I want to see them start buying though. Could still have some turmoil in the gold market.
Could be the commercials realized that we were close to a break of 1200 and wanted to pick up some longs afterwards
For the bear case (the alternate wave count) I’m moving the degree of labelling in the current wave down one degree. This upwards day today looks like a fourth wave counterpart to the last second wave.
For the bear case I wouldn’t want to see the middle of the third wave just passed, there is not enough downwards momentum yet. It should still be building.
This is the wave count that has most support from classic TA. Really, at this stage I should be swapping the wave counts over. Last week the picture really did look more bearish.
But the reason why I haven’t yet is the EW structure just has so many more problems for this wave count.
This is an instance where the classic TA and the EW analysis tell different stories in terms of probability of what should happen next. EW is bullish, classic TA is bearish.
Main hourly chart update.
Minuette (ii) overshot the lower edge of the base channel drawn about minute i and ii. That is a very small concern, but it’s not a breach so the channel is mostly intact.
Once gold crosses 1195 there is a reverse symetry (no resistance) up to 1210 to 1215 on one hour chart.
Possible update
Thanks for the chart, a picture is worth a thousand words
I second that. Excellent, thank you Dreamer.
I completely agree with the assessment that if Gold breaks below that lower trend line now then we should be highly suspicious of this rally.
That means a break below the line we should be either neutral or short. Since you posted that chart there has been a spike / overshoot of the line, but no proper breach as yet. So far so good…. just.
Now price is moving up and away…. that’s good. So far.
Is pmbull down??? I just refreshed the chart and came back with invalid symbol error.
Hi Lara
Have you heard of Nial Fuller? He is an Australian millionaire trader who follows pure Price Action. I joined his course many years ago before I had even heard of Elliott Waves. He has also recently won several hundred thousand pounds by winning a trading competition. He doesn’t think much of the EW method.
I think I am going to try to incorporate more Price Action alongside my EW analysis in future and see how it goes.
No, I’ve not heard of him.
I actually don’t know what you mean by “pure price action”. That’s not an analysis method I’ve come across. I’ve probably come across it under another name.
JUST A VIEW: IMO unless something changes, hard to reconcile making a bullish case for Gold price seeing the monthly Macd line gradually heading towards the zero line with a month on month loss in momentum (histogram) and CCI (although a lagging indicator) in neutral territory below 50 also appears to be heading for the zero line…. I guess time & price will tell what is in store next.
Main hourly wave count is completing inverted HnS. Head at price point of 1172, neckline at 1192 (line across wave c and i) and right shoulders the current price point 1179.67.
Next week if gold crosses neckline 1192 then Hns is complete.
This is the same price point in Lara’s report: ” The target for a six month long wave up is 1,500 and some confidence may be had in this if price makes a new high above 1,192.52,..”
Gold is entering seasonal strong period in to Dec-Jan-Feb high.
Looking good Papudi!
Neckline break to the upside and Lara’s 1st confidence level met above 1,192.52
1213-1215 area also coincides with a minor wave 3 up
Yes indeed!!
Now gold needs to go thru 1205 to your target 1216.
Short public post by Rambus on GDM, the feeder index for GDX
https://rambus1.com/2016/11/25/gdm-update-168/
Note the thick, dark blue lines I added to his chart which highlights the positive divergence in RSI, MACD, and STO