
The main Elliott wave count expected a green daily candlestick for Monday, which is what has happened.
Summary: The target for a six month long wave up is 1,500 and some confidence may be had in this if price makes a new high above 1,204.05, and thereafter further confidence above 1,220.66. The second alternate wave count expects an increase in downwards momentum with the short term target at 1,169. A little confidence may be had in this if price makes a new low below 1,172.10.
New updates to this analysis are in bold.
Grand SuperCycle analysis is here.
Last monthly and weekly charts are here.
DAILY ELLIOTT WAVE COUNT
Click chart to enlarge.
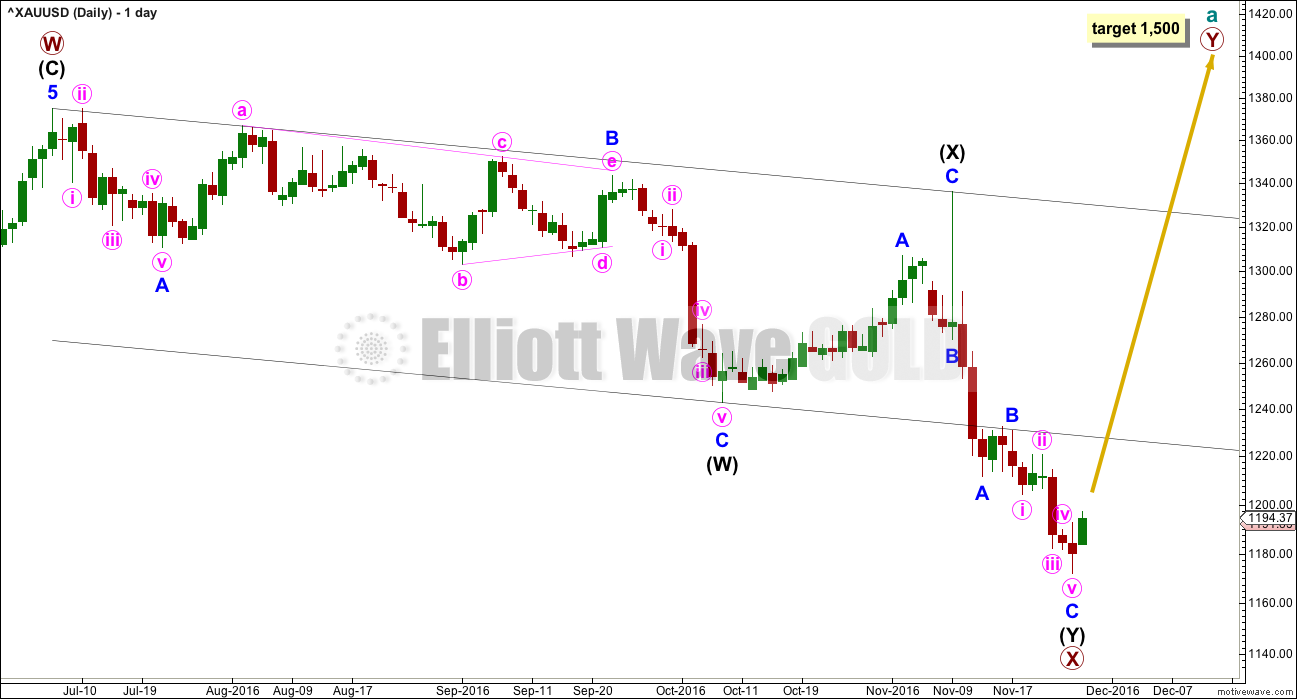
The larger structure of primary wave X may be either a double zigzag or a double combination. The second structure in this double for primary wave Y may be either a zigzag (for a double zigzag) or a flat or a triangle (for a double combination).
It is my judgement at this stage that it is more likely primary wave X will be a double zigzag due to the relatively shallow correction of intermediate wave (X). Although intermediate wave (X) is deep at 0.71 the length of intermediate wave (W), this is comfortably less than the 0.9 minimum requirement for a flat correction. Within combinations the X wave is most often very deep and looks like a B wave within a flat.
However, there is no minimum nor maximum requirement for X waves within combinations, so both a double zigzag and double combination must be understood to be possible. A double zigzag is more likely and that is how this analysis shall proceed.
Within the second structure, minor wave A should be a five wave structure. This now looks complete.
Minor wave B found resistance at the lower edge of the wide parallel channel about primary wave X. Along the way up, price may find resistance at the lower edge of this channel.
Minor wave C may now be complete at the hourly chart level.
HOURLY ELLIOTT WAVE COUNT
Click chart to enlarge.
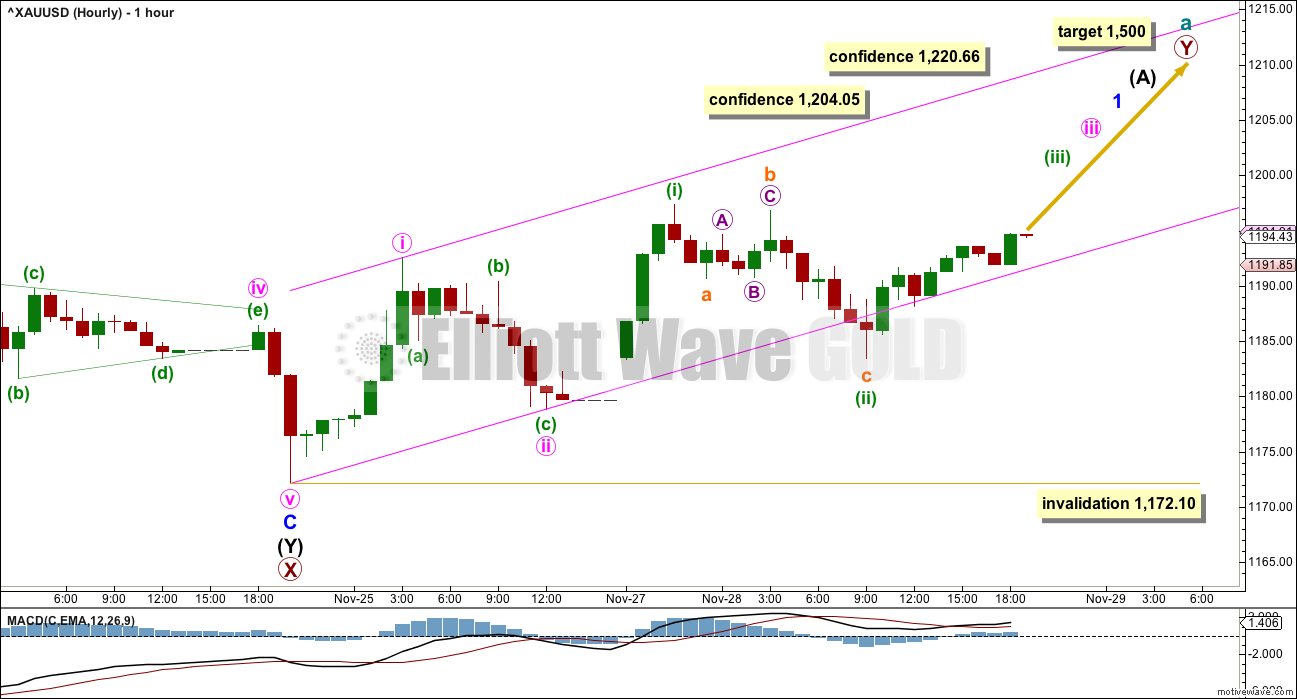
Primary wave Y is expected to be a zigzag. Within a zigzag, intermediate wave (A) should subdivide as a five wave structure. Within the five wave structure, minor wave 2 may not move beyond the start of minor wave 1 below 1,172.10.
So far there may be two overlapping first and second waves complete. This is labelled minute waves i and ii, followed by minuette waves (i) and (ii). This wave count expects to see some increase in upwards momentum over the next 24 hours.
Along the way up, the next confidence point is now at 1,204.05.
The pink channel is a base channel drawn about minute waves i and ii. Most often (not always) the lower edge of an upwards sloping base channel should provide support for subsequent corrections, and lower degree second waves should not breach base channels drawn about first and second waves one or more degrees higher. For Gold this most often works, but not always. Sometimes base channels are breached by deep second wave corrections as Gold often begins its impulses very slowly. A breach of the lower pink trend line would be a warning that the probability of this wave count has reduced, but it would still remain viable.
A new high above 1,220.66 would provide a reasonable level of confidence in this wave count.
At 1,500 primary wave Y would reach equality in length with primary wave W. Primary wave Y may be expected to last a Fibonacci five or eight months.
ALTERNATE DAILY ELLIOTT WAVE COUNT
Click chart to enlarge.
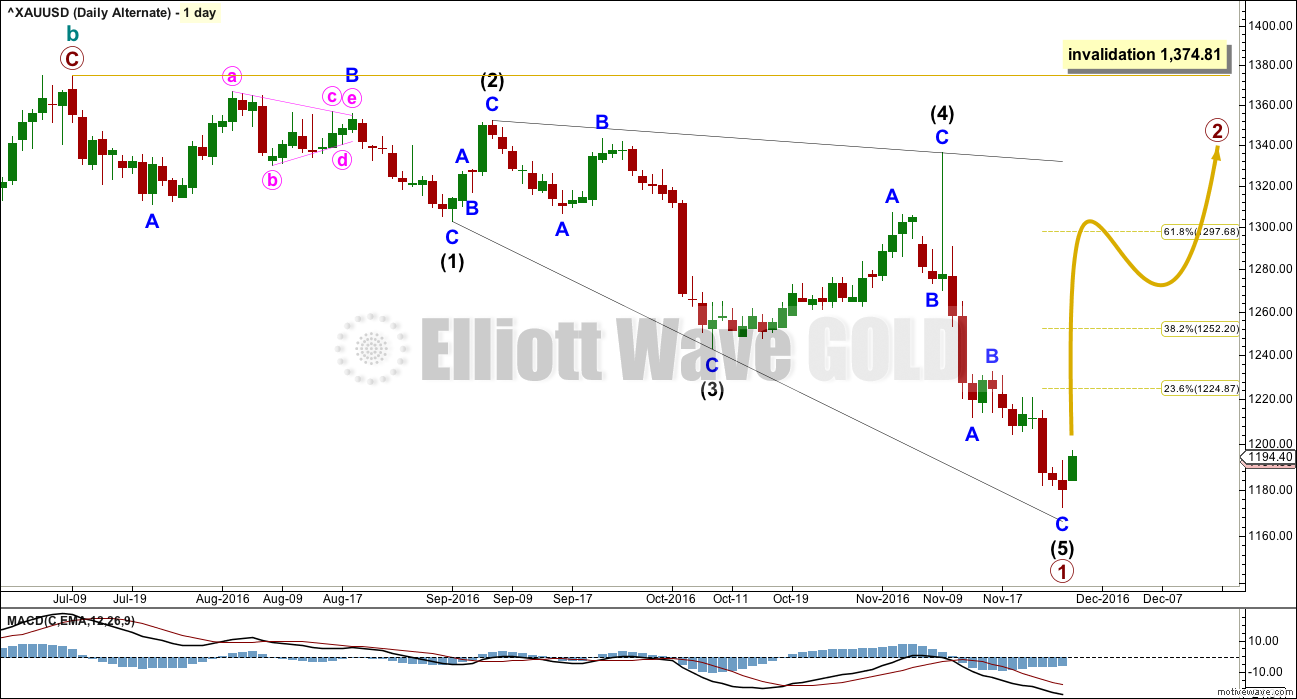
This alternate wave count expects that the large upwards zigzag from the low of 1,046 in December 2015 to the last high of 1,374 in July 2016 is a complete correction. The trend is still down; Gold is still in a bear market.
If there has been a cycle degree trend change at the high labelled cycle wave b, then the new wave down must begin with a five wave structure. At this stage, there looks to be too much overlapping for an impulse, so a leading diagonal is considered.
Within leading diagonals, sub-waves 2 and 4 must subdivide as zigzags. Sub-waves 1, 3 and 5 are most commonly zigzags but sometimes may also appear to be impulses.
Within this structure, all sub-waves subdivide as zigzags. This wave count meets all Elliott wave rules. This diagonal looks correct.
This wave count has a lower probability at the daily chart level because leading diagonals are not very common structures for first waves. When first waves do subdivide as leading diagonals, they are most often contracting and not expanding. This wave count does not rely upon a rare structure, but it does rely upon a less common structure.
At the monthly chart level, if the zigzag up labelled cycle wave b is complete, then there are further implications. That means that the prior wave down to the low at 1,046 on December 2015 must be seen as a five wave impulse. This is possible, but it has a fairly low probability.
Primary wave 1 lasted 94 days. Primary wave 2 may initially be expected to last about a Fibonacci 55 or 89 days. It should be a big three wave structure.
At the hourly chart level, this alternate wave count would be essentially the same as the main hourly chart; minor wave C may now be complete.
At this stage, there is no divergence in expected direction between this alternate and the main wave count. The structure of upwards movement, if it is clearly a three or five, may assist to tell us which wave count is correct in coming weeks. For now this alternate must be judged to have a low probability due to the problems outlined. It is published to consider all possibilities.
SECOND ALTERNATE DAILY ELLIOTT WAVE COUNT
Click chart to enlarge.
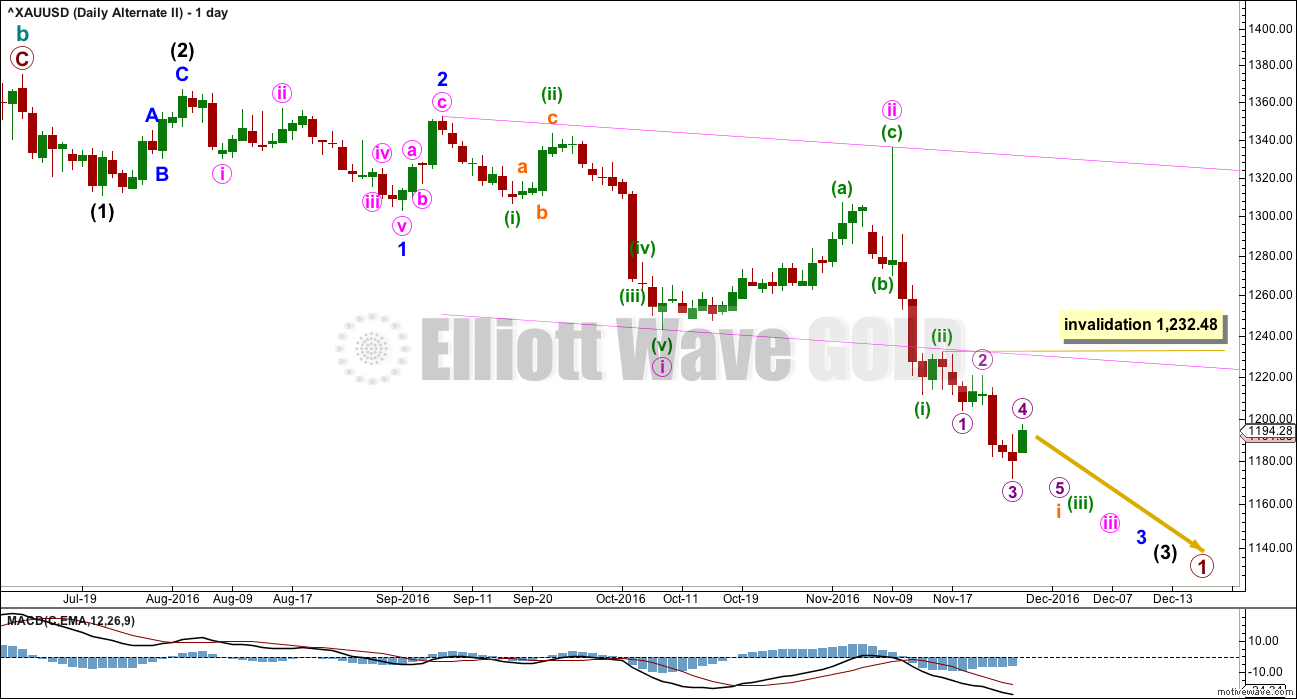
This alternate wave count also suffers from the same problems at the monthly chart level as the first alternate above. Seeing cycle wave a downwards as a five wave structure has problems of proportion and unusual behaviour with a base channel.
However, all possibilities should be considered.
What if a new bear market is underway for cycle wave c? The most likely structure would be an impulse. At this stage, price may be close to the middle of a third wave within primary wave 1 down.
This wave count has a problem of proportion at the daily chart level also: minute wave ii lasted 23 sessions and intermediate wave (2) three degrees higher lasted just 8 sessions. Lower degree corrections should be more brief than higher degree corrections. This is not always the case, but when the duration is substantially different then it must necessarily reduce the probability of the wave count.
The pink channel here is a base channel about minute waves i and ii. Price should continue to find resistance at the lower edge of the base channel now that it has breached the channel.
Within the middle of the third wave, no second wave correction may move beyond the start of its first wave above 1,220.66.
SECOND ALTERNATE HOURLY ELLIOTT WAVE COUNT
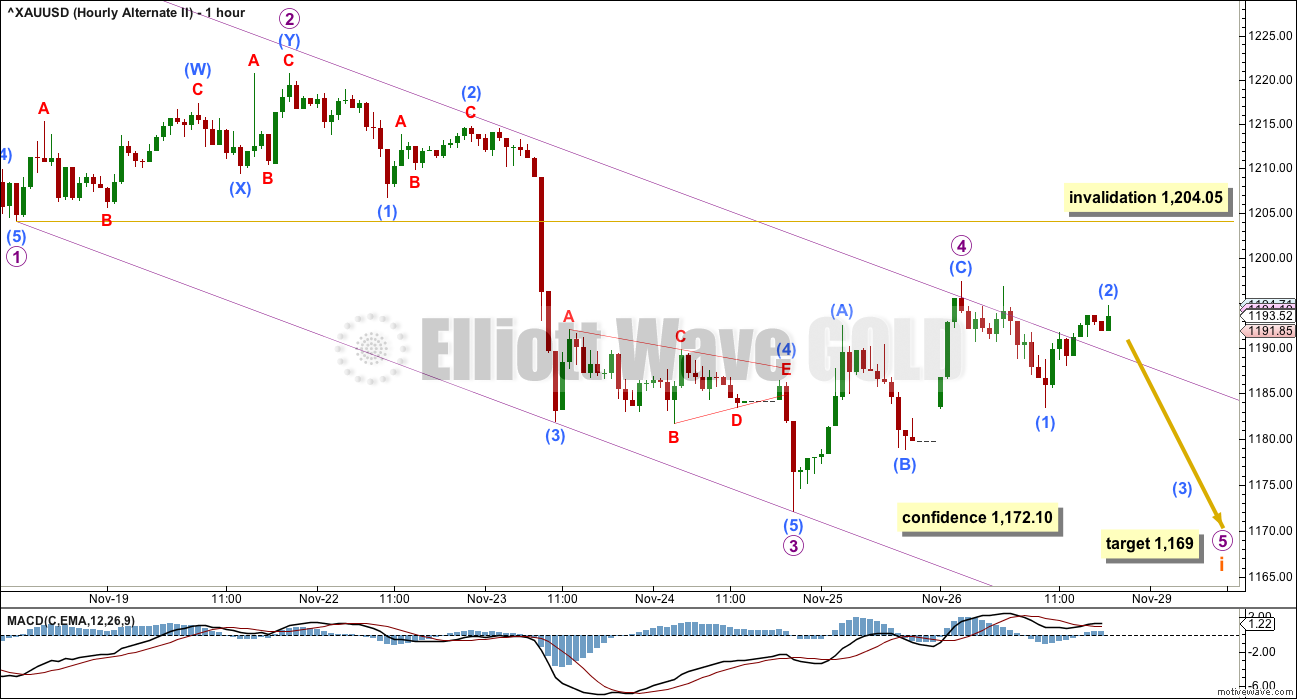
Click chart to enlarge.
If an impulse is developing downwards, then the third wave within it would still be incomplete.
At the hourly chart level, this wave count is adjusted today to see subminuette wave i an incomplete impulse. Current upwards movement looks like a counterpart fourth wave correction to the prior second wave labelled micro wave 2.
Micro wave 4 may not move into micro wave 2 price territory above 1,204.05.
At 1,169 micro wave 5 would reach equality in length with micro wave 1.
The violet channel is a best fit. The first trend line is drawn from the ends of micro waves 1 to 3, then a parallel copy is placed on the extreme within submicro wave (3). Micro wave 4 overshoots the channel, which looks okay. What does not look okay is the current breach. If this wave count is correct, then micro wave 5 should remain within the channel finding resistance at the upper edge.
TECHNICAL ANALYSIS
WEEKLY CHART
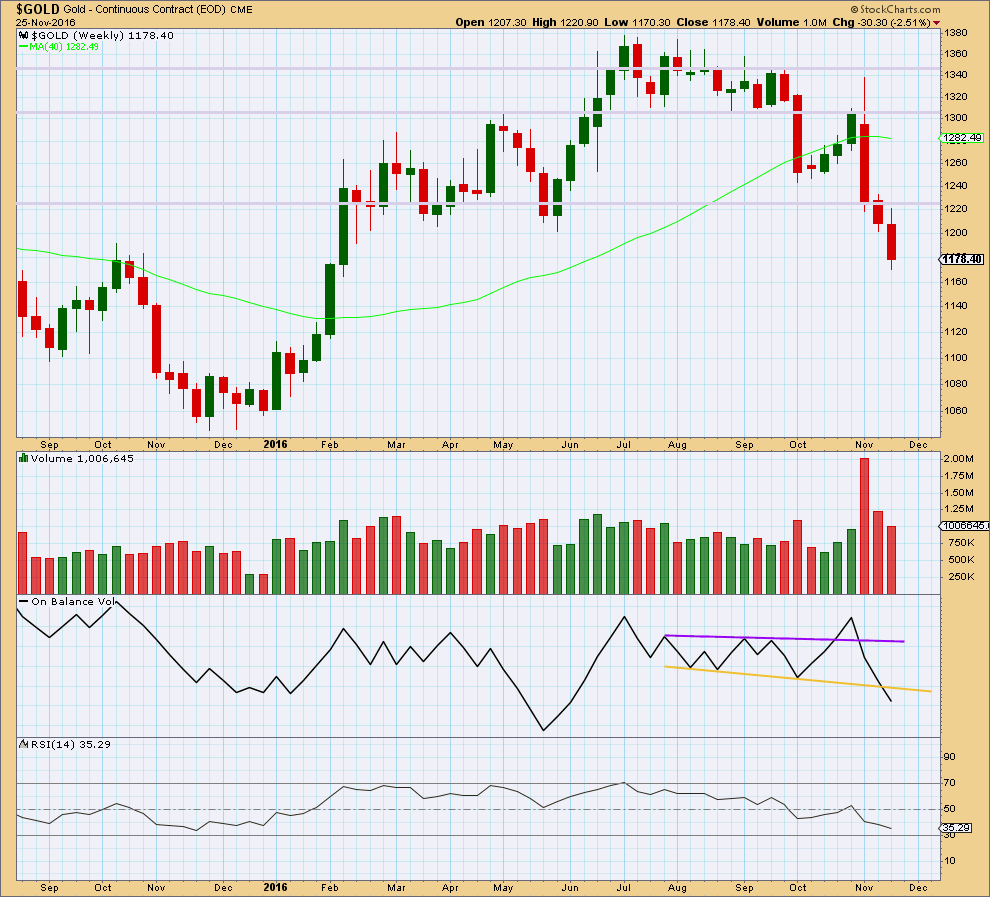
Click chart to enlarge. Chart courtesy of StockCharts.com.
Another downwards week comes with a further decline in volume. The fall in price is not supported by volume, so it should be suspicious.
On Balance Volume last week breaks below the yellow support line. This is a strong bearish signal that supports the second alternate Elliott wave count.
There is no divergence between price and RSI at the weekly chart level to indicate weakness. RSI is not yet extreme. There is room still for price to fall further.
DAILY CHART
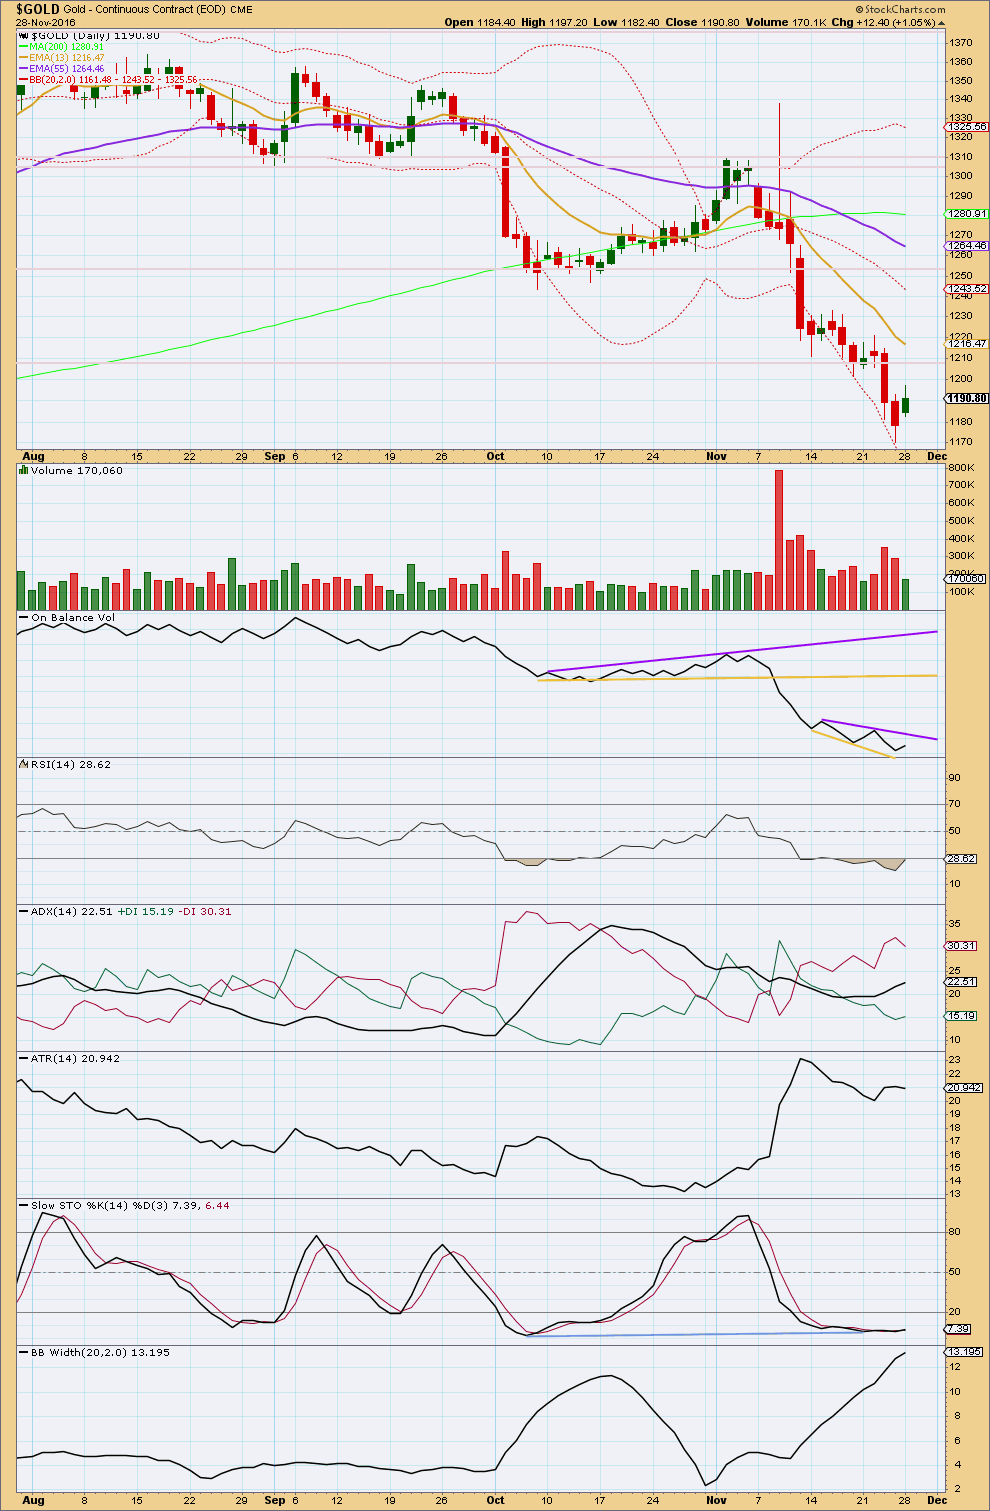
Click chart to enlarge. Chart courtesy of StockCharts.com.
This daily candlestick completes what is essentially a bullish engulfing pattern. The important aspect of a bullish engulfing pattern is that the close of the second candlestick should be above the open of the first candlestick. The open of the second candlestick is not as important, and this one gaps higher which may be read as more bullish.
Engulfing patterns are the strongest of candlestick reversal patterns. The bulls were in charge today. They managed to open the session higher than the close, so they were in charge after hours also. They pushed price far enough upwards to close above the entire range of the prior session. This represents a significant shift in sentiment.
Reversal patterns make no comment on how far the next movement may go, nor even on the direction. The reversal may be from down to up, or equally from down to sideways.
This session comes with much lighter volume; the rise in price does not have support from volume. This suggests that bulls may not have the strength to push price much higher, so price may be about to enter a small sideways correction.
Some consolidation about here after a period of downwards movement finding support at the lower edge of Bollinger Bands is a reasonable expectation. Especially as at the end the fall in price came on declining volume.
On Balance Volume may find resistance at the short purple trend line. However, this line does not offer good technical significance as it is only tested twice and is not long held.
ADX still indicates a downwards trend is in place. ATR overall disagrees now as it is overall declining.
Bollinger Bands still agree though as they continue to widen. This is now reasonably extreme though, so an end to this trend and a larger consolidation may be expected to arrive sooner rather than later.
RSI and Stochastics are still both extreme.
While this classic analysis is still bearish, it does point to a consolidation either here or very soon within a larger downwards trend.
This analysis is published @ 07:45 p.m. EST.
My apologies for not posting a chart today. I am unwell.
Okay enough now to get some work done.
A big THANK YOU to Dreamer and Alan especially for the analysis, charts and comments.
Hope you feel better soon! Just think about your holiday coming up. A little rest and relaxation is good for the soul.
Hi Lara,
take care and get well.
Best wishes
Ursula
Hi Lara.
Hope you get well soon.
Take care and don’t over-exert yourself. Health is very important.
Thank you every body. I’m being as still as I possibly can…. I should be just fine by tomorrow.
And yes, really looking forward to the Christmas holiday.
Please get well soon. Take care of yourself.
@9:35 AM Gold broke thru the down trendline from high of 1192 in 5 minute time period.
Let see if it holds and prove to be a reversal here???
Resistance at 1195,
Papudi, if the main count is correct, the low of 1181.36 today was minuette 2 of Minute 3. It was a combination 1197.32 – 1183.43 – 1194.71 – 1181.36.
The rise to the high so far of 1188.96 should be part of subminuette 1 of minuette 3. If all goes right, we should see strong momentum upwards after the subminuette 2 correction. It would be a strong 3rd wave up in 3 degrees: subminuette, minuette and minute.
Thanks Alan.
Alan, what do you think? One more small leg up as shown below or are you thinking full on bear count?
Hi Dreamer. I really appreciate your tremendous effort to analyse GDX, even without much thanks from the forum members. I do feel disappointed at times, particularly so on a recent occasion when so many of us had called for a drop to the 1170 level, and guess what, the moment that Lara saw our point of view that there were praises for her work.
That said, to me, the bigger trend is still down.
I use the EMA 13 / 34 / 89 to appreciate the trend, and EMA 13 is below EMA 34 which is below EMA 89, suggesting the downtrend is still going strong.
The 1195-1200 level had been staunch support but would now become strong resistance. Yesterday, there were two failed attempts to breach that level. Until that level becomes breached, I would still remain pessimistic about the bull.
I will become bullish should the 1195-1200 level be taken out followed by a rise above 1220.66. The bear count would become more likely with a drop below 1172.10. Those figures are from Lara’s analysis, and they make perfect sense. So, at the moment, I am still neutral, with a slightly bearish tilt.
Alan, be absolutely assured that I put great store in your opinions. I even travelled to your home city on two occasions to meet you without success 😉
Thank you for you efforts.
Thanks Johno. It happens that I travel quite often and we have not been able to meet up.
Alan,
I appreciate your input as well, but must admit that most of the time I am just trying to figure out what you’ve said..let alone knowing that what you’ve said is correct. And by not saying anything on this forum I avoid making it clear to everyone concerned that I’m ignorant about almost all this.
Still learning and trying to make some money for retirement,
TJ
My apologies Thomas. I haven’t been successful in putting annotations on graphs at a reasonable time period. The little I did, I had to do them in MS Word which is quite poor in its graphic ability. I know that describing in numbers is inferior to using a picture. I’ll try to figure out some easier way to do so.
Alan, as you can see, I have settled on using Tradingview.com for most of my charts. You can use EW labels and all of the other annotation tools that you desire. It’s free for up to 5 charts if you can deal with the ads that pop up. I finally started paying to eliminate the ads.
Investing.com is also free to use their charting tools. It appears that they have a deal with Tradingview to embed their chart tools. The problem that I had is that Investing.com kept freezing and I would lose my work, so I gave up on that web site as it was too unstable.
Whatever you decide, charts would be great, but we love your commentary any way you like to share it. Keep up the good work!
And by the way, their data is close to Barcharts numbers, but I often look at Barchart to verify Lara’s exact invalidation and confirmation points.
Alan,
I will try to better understand Elliotwave theory and all the ways to describe what’s happening. I do believe there’s something to all this, but it’s not your responsibility to make sure I understand what you are saying. However, I do appreciate your willingness to try. Thank you all again. All of your analysis combined is a big help to students like me.
TJ
On closer analysis of the wave count, I reckon the point marked capital “B” in black is 1232.48, and the drop from there would coincide with Lara’s 2nd Alternate count. It is very bearish indeed. That count (Cycle C) would drop to a low at best at 832.63, the 0.618 retracement of Cycle A within Supercycle A. It could have been lower.
Scrap the post immediately above this. I saw the point wrongly. “B” had not come to pass yet.
Anyways, I am not confident about this guy’s counts. He had done a fair number for Oil and is as often right as he is wrong. But then, perhaps he made updates to his paid subscribers, and those are not reflected in the public domain.
Thanks for your thoughts Alan. I agree that his accuracy is not the best and this one needs some relabeling. The thing that I like is the concept that gold needs some more time to base before the second leg up gets going. I think a count similar to this can accomplish that.
I’m just having a hard time getting on board with the full bear count and the move up looks pretty weak so far. Need a little more time for some clarity.
My sentiments exactly. Gold is having a hard time trying to break through the 1195-1200 ceiling. Yet, market sentiment does not appear that bearish. I am sure there are many traders sitting on the sidelines clueless, waiting for clarity, wishing that gold goes one way or the other and not just languish in a tight band.
This is another possibility if we turn back up soon.
http://www.safehaven.com/article/43149/elliott-wave-analysis-gold-trading-within-a-complex-correction
Gold price 1172 on watch!!!!!
PM sector continues in the bear trend.
GDX support is very strong here
Dueling H&S patterns ….
You’re right Dreamer, that trend line breach does not look healthy at all for the bullish case.
The bottom line for the bull wave count has to be 1,172.10. It is possible (but much less likely) that a leading diagonal could be unfolding up. A zigzag for the first wave could be complete, and now a zigzag down for a second wave may be incomplete.
But it feels like every time I revert to considering a diagonal because an impulse is invalidated for a new trend, it turns out to be wrong. They really are not that common. I am very wary of them.
For now I’m on the sidelines. But it does look increasingly like Gold remains in a bear market.