
Upwards movement was expected, but this is not what has happened.
Price has moved mostly sideways to complete a small red doji and remains above the invalidation point on the hourly chart.
Summary: The target for a six month long wave up is 1,500 and some confidence may be had in this if price makes a new high above 1,204.05, and thereafter further confidence above 1,232.48. The second alternate wave count expects an increase in downwards momentum with the short term target at 1,169. A little confidence may be had in this if price makes a new low below 1,172.10. Classic technical analysis is still more bearish than bullish. One possible approach to this market at this time would be to enter long above 1,232.48 and short below 1,172.10. Always use a stop and never invest more than 3-5% of equity on any one trade.
New updates to this analysis are in bold.
Grand SuperCycle analysis is here.
Last monthly and weekly charts are here.
DAILY ELLIOTT WAVE COUNT
Click chart to enlarge.
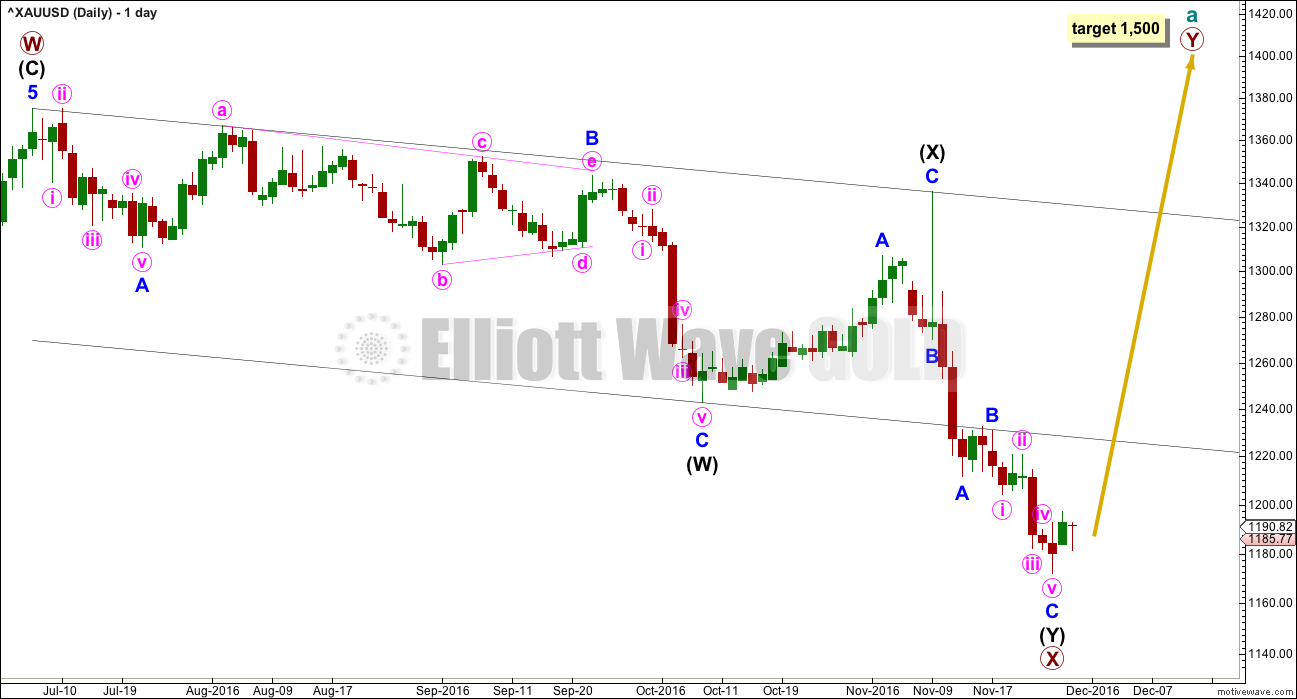
The larger structure of primary wave X may be either a double zigzag or a double combination. The second structure in this double for primary wave Y may be either a zigzag (for a double zigzag) or a flat or a triangle (for a double combination).
It is my judgement at this stage that it is more likely primary wave X will be a double zigzag due to the relatively shallow correction of intermediate wave (X). Although intermediate wave (X) is deep at 0.71 the length of intermediate wave (W), this is comfortably less than the 0.9 minimum requirement for a flat correction. Within combinations the X wave is most often very deep and looks like a B wave within a flat.
However, there is no minimum nor maximum requirement for X waves within combinations, so both a double zigzag and double combination must be understood to be possible. A double zigzag is more likely and that is how this analysis shall proceed.
Within the second structure, minor wave A should be a five wave structure. This now looks complete.
Minor wave B found resistance at the lower edge of the wide parallel channel about primary wave X. Along the way up, price may find resistance at the lower edge of this channel.
Minor wave C may now be complete at the hourly chart level.
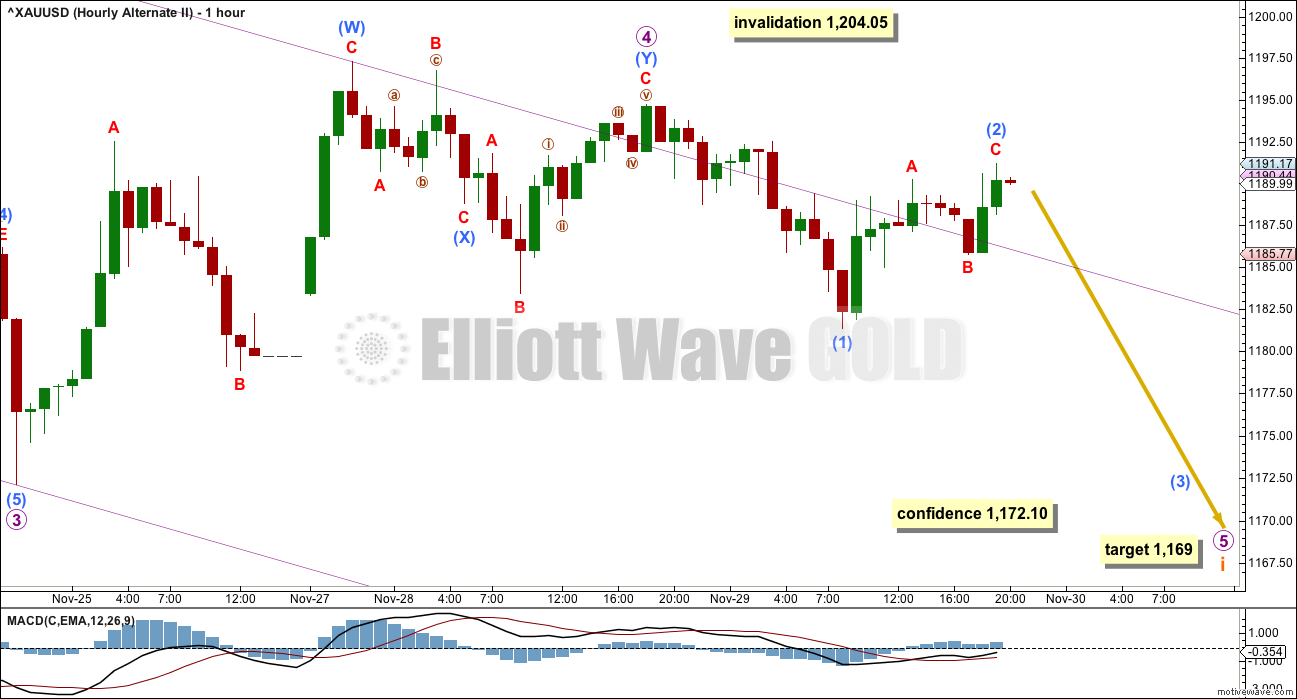
HOURLY ELLIOTT WAVE COUNT
Click chart to enlarge.
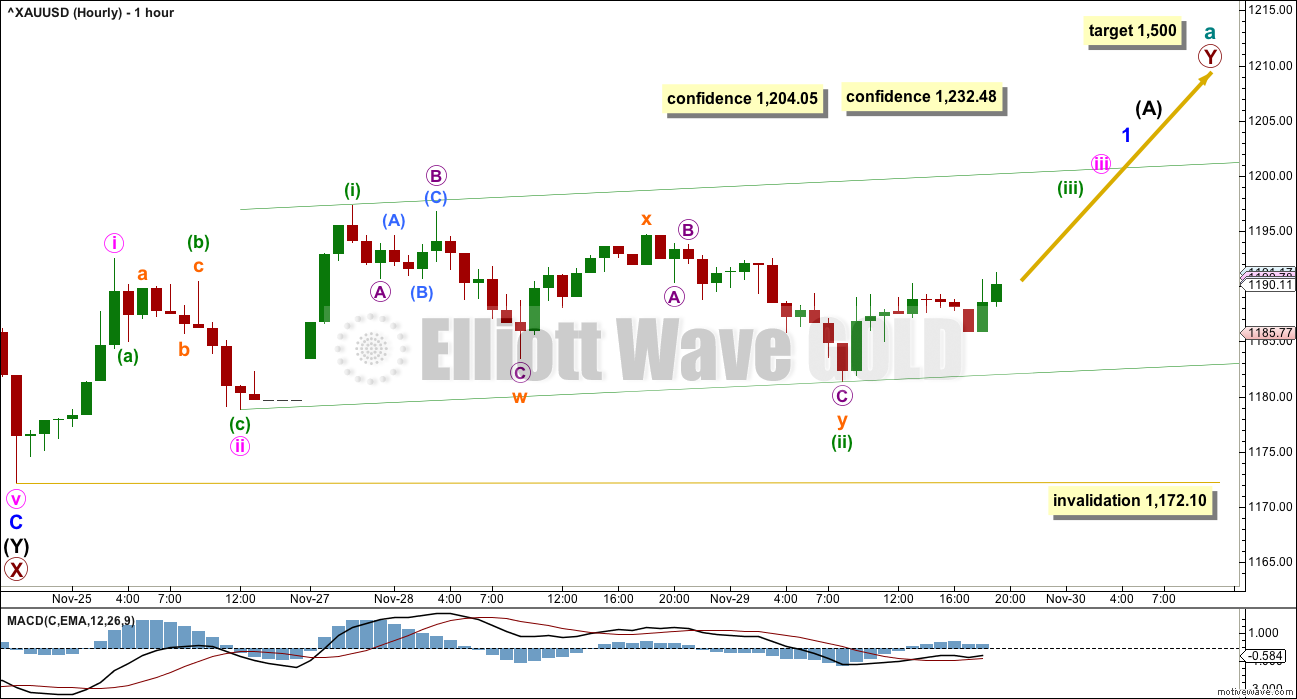
Primary wave Y is expected to be a zigzag. Within a zigzag, intermediate wave (A) should subdivide as a five wave structure. Within the five wave structure, minor wave 2 may not move beyond the start of minor wave 1 below 1,172.10.
So far there may be two overlapping first and second waves complete. This is labelled minute waves i and ii, followed by minuette waves (i) and (ii). This wave count expects to see some increase in upwards momentum over the next 24 hours.
Along the way up, the next confidence point is now at 1,204.05.
The pink base channel did not work because price has broken below it. That channel is not showing where price is finding support, so it has been removed. The breach of that base channel on yesterday’s hourly chart is a warning that something may be wrong with this wave count, but it does not invalidate the count.
Minuette wave (ii) should now be over. It is longer in duration than minute wave ii one degree higher, so this disproportion further slightly reduces the probability of this wave count.
A new base channel is drawn about minuette waves (i) and (ii). The lower edge now should provide support.
There is another possibility which is not charted here today, that a leading diagonal may be unfolding upwards. The first, third and fifth waves are most commonly zigzags within leading diagonals. A zigzag up for a first wave of a leading diagonal may be complete. It would now also be followed by a complete zigzag down. I am very wary of diagonals for first waves because they are not very common. When the wave count that expects a trend change begins by expecting an impulse and then must revert to considering a diagonal, then it mostly turns out to be wrong.
A new high above 1,232.48 would provide a reasonable level of confidence in this wave count.
At 1,500 primary wave Y would reach equality in length with primary wave W. Primary wave Y may be expected to last a Fibonacci five or eight months.
ALTERNATE DAILY ELLIOTT WAVE COUNT
Click chart to enlarge.
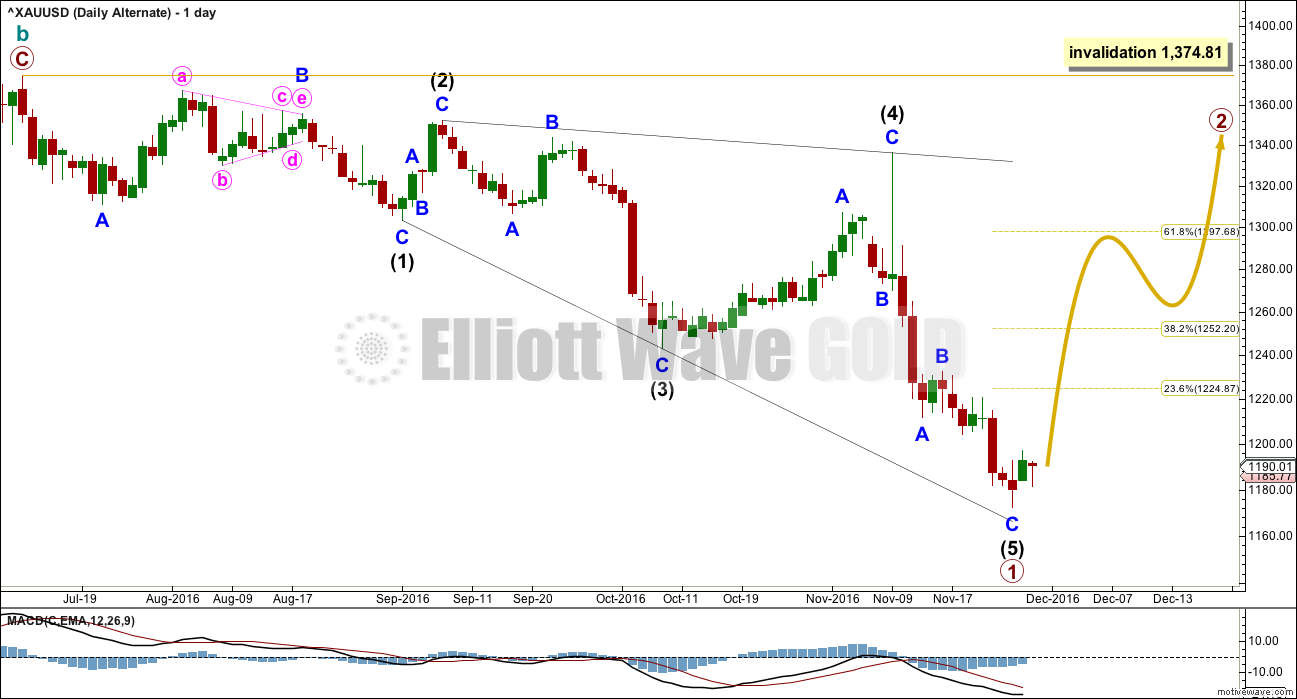
This alternate wave count expects that the large upwards zigzag from the low of 1,046 in December 2015 to the last high of 1,374 in July 2016 is a complete correction. The trend is still down; Gold is still in a bear market.
If there has been a cycle degree trend change at the high labelled cycle wave b, then the new wave down must begin with a five wave structure. At this stage, there looks to be too much overlapping for an impulse, so a leading diagonal is considered.
Within leading diagonals, sub-waves 2 and 4 must subdivide as zigzags. Sub-waves 1, 3 and 5 are most commonly zigzags but sometimes may also appear to be impulses.
Within this structure, all sub-waves subdivide as zigzags. This wave count meets all Elliott wave rules. This diagonal looks correct.
This wave count has a lower probability at the daily chart level because leading diagonals are not very common structures for first waves. When first waves do subdivide as leading diagonals, they are most often contracting and not expanding. This wave count does not rely upon a rare structure, but it does rely upon a less common structure.
At the monthly chart level, if the zigzag up labelled cycle wave b is complete, then there are further implications. That means that the prior wave down to the low at 1,046 on December 2015 must be seen as a five wave impulse. This is possible, but it has a fairly low probability.
Primary wave 1 lasted 94 days. Primary wave 2 may initially be expected to last about a Fibonacci 55 or 89 days. It should be a big three wave structure.
At the hourly chart level, this alternate wave count would be essentially the same as the main hourly chart; minor wave C may now be complete.
At this stage, there is no divergence in expected direction between this alternate and the main wave count. The structure of upwards movement, if it is clearly a three or five, may assist to tell us which wave count is correct in coming weeks. For now this alternate must be judged to have a low probability due to the problems outlined. It is published to consider all possibilities.
SECOND ALTERNATE DAILY ELLIOTT WAVE COUNT
Click chart to enlarge.
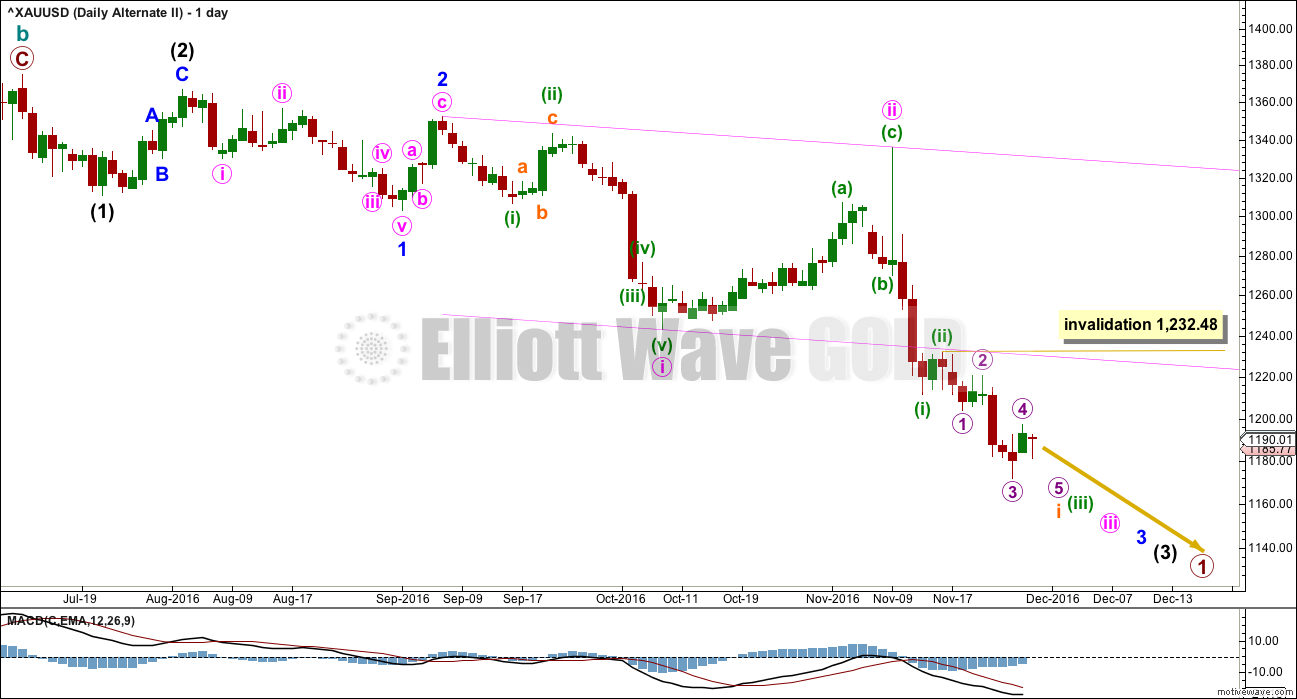
This alternate wave count also suffers from the same problems at the monthly chart level as the first alternate above. Seeing cycle wave a downwards as a five wave structure has problems of proportion and unusual behaviour with a base channel.
However, all possibilities should be considered.
What if a new bear market is underway for cycle wave c? The most likely structure would be an impulse. At this stage, price may be close to the middle of a third wave within primary wave 1 down.
This wave count has a problem of proportion at the daily chart level also: minute wave ii lasted 23 sessions and intermediate wave (2) three degrees higher lasted just 8 sessions. Lower degree corrections should be more brief than higher degree corrections. This is not always the case, but when the duration is substantially different then it must necessarily reduce the probability of the wave count.
The pink channel here is a base channel about minute waves i and ii. Price should continue to find resistance at the lower edge of the base channel now that it has breached the channel.
When subminuette wave i is complete, then subminuett wave ii upwards may not move beyond the start of subminuette wave i above 1,232.48.
SECOND ALTERNATE HOURLY ELLIOTT WAVE COUNT
Click chart to enlarge.
If an impulse is developing downwards, then the third wave within it would still be incomplete.
Micro wave 4 may not move into micro wave 2 price territory above 1,204.05.
At 1,169 micro wave 5 would reach equality in length with micro wave 1.
The violent channel is redrawn today using Elliott’s second technique: the first trend line from the ends of micro waves 2 to 4, then a parallel copy on the end of micro wave 3. The upper edge is still not working to show where price is finding resistance; the channels for neither wave count are working well at the hourly chart level.
Micro wave 4 is seen as a complete combination: zigzag – X – flat. There is a problem within sub-micro wave (Y) though: minuscule wave B is over 2 times the length of minuscule wave A; it is a 2.8 length of minuscule wave A. This is longer than the conventional allowable limit of 2, but there is no rule stating a limit. So this is possible, but it reduces the probability of this portion of the wave count. But the subdivisions all fit well, so that is how it is labelled.
This alternate wave count now expects to see some increase in downwards momentum.
TECHNICAL ANALYSIS
WEEKLY CHART
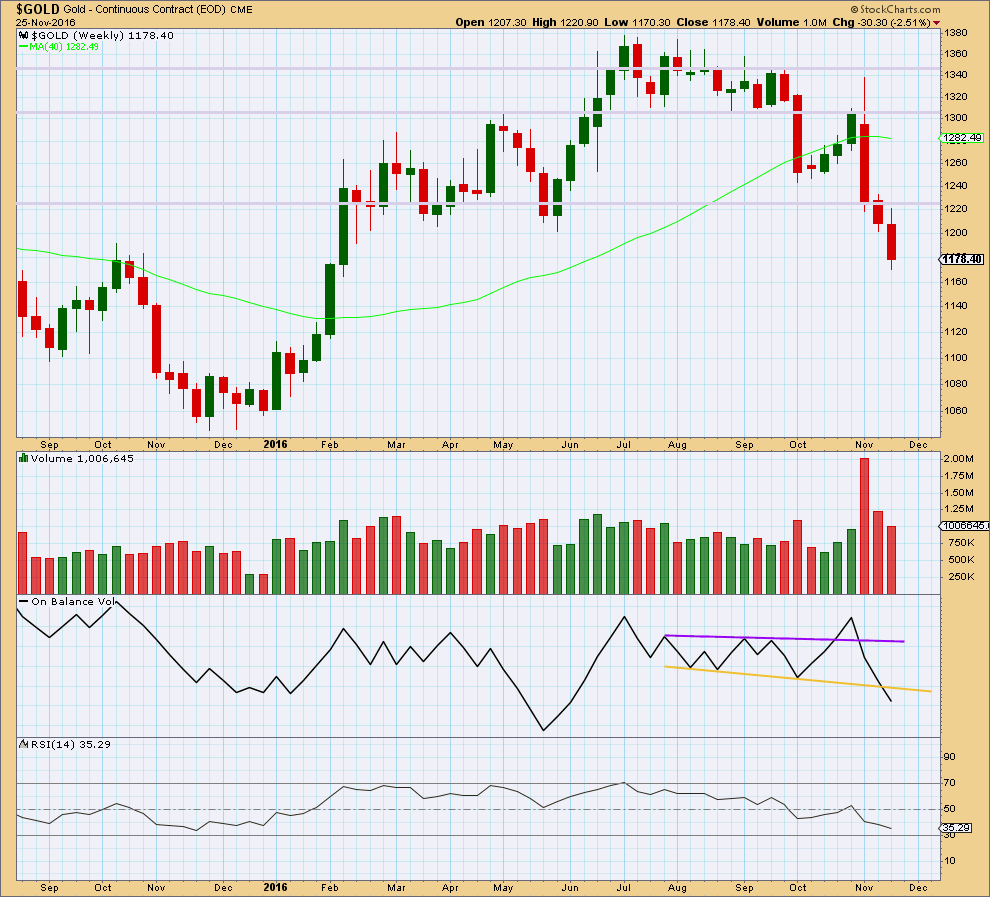
Click chart to enlarge. Chart courtesy of StockCharts.com.
Another downwards week comes with a further decline in volume. The fall in price is not supported by volume, so it should be suspicious.
On Balance Volume last week breaks below the yellow support line. This is a strong bearish signal that supports the second alternate Elliott wave count.
There is no divergence between price and RSI at the weekly chart level to indicate weakness. RSI is not yet extreme. There is room still for price to fall further.
DAILY CHART
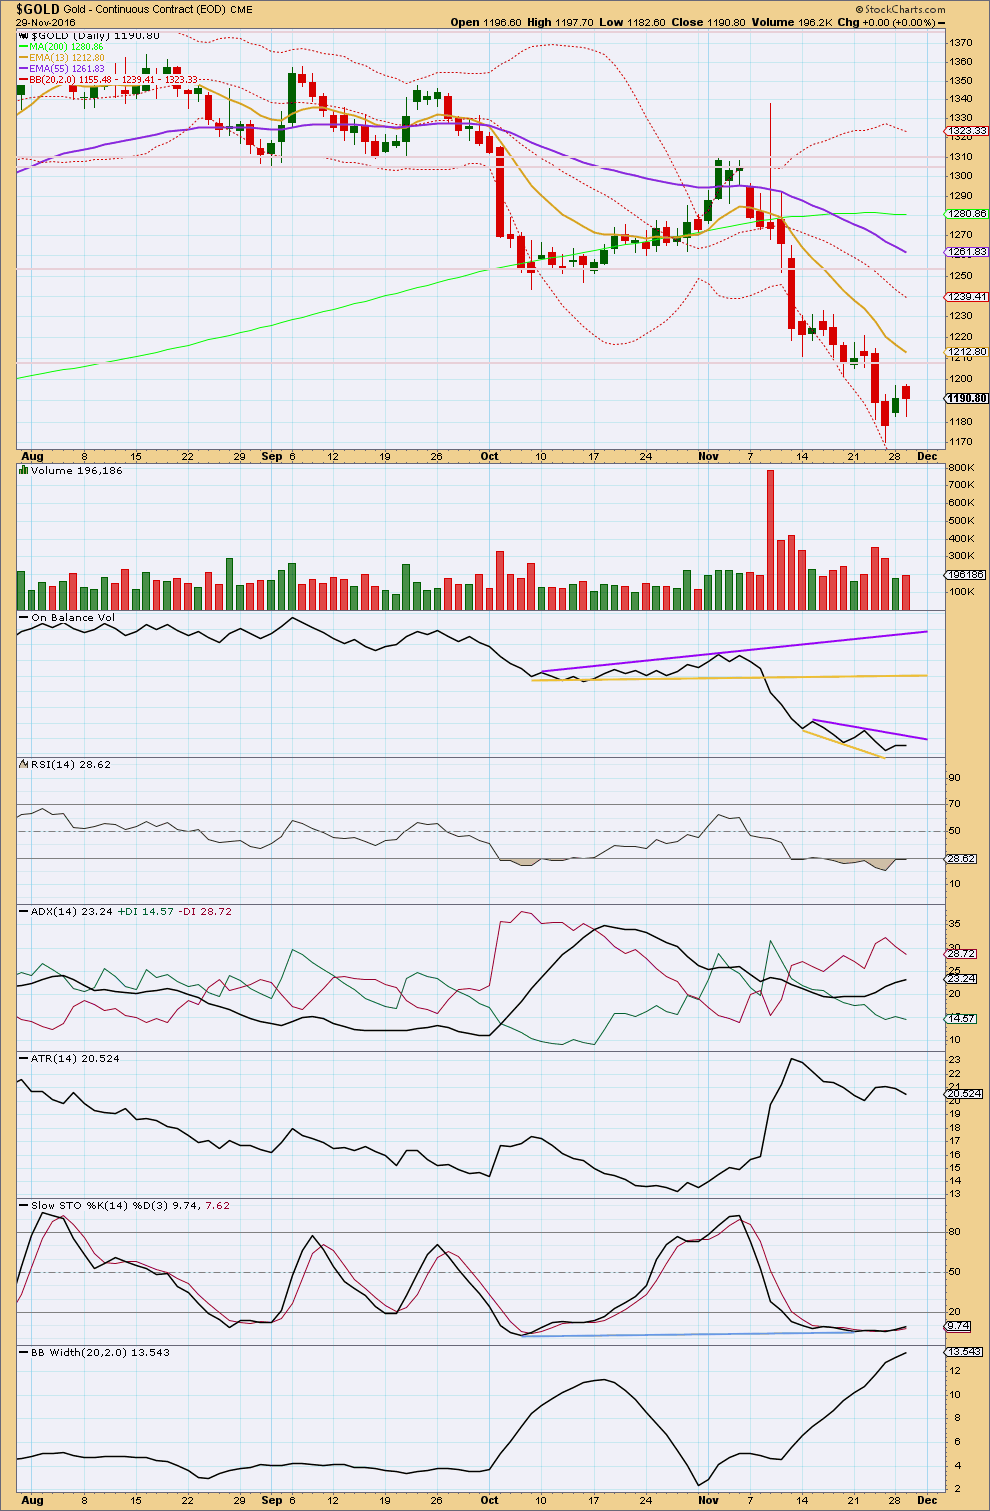
Click chart to enlarge. Chart courtesy of StockCharts.com.
Today’s candlestick has a higher high and a higher low (the definition of upwards movement) even though it closed red. On Balance Volume indicates the balance of volume was upwards within the session. Volume was slightly higher than yesterday, so there is some small support from volume for this upwards movement from price today. However, volume is still very light which is concerning for the main Elliott wave count.
ADX still indicates there is a downwards trend in place. A reasonable response would be to use this upwards / sideways movement as an opportunity to join the downwards trend. ADX is not yet extreme, so there is room still for this trend to run.
However, Stochastics and RSI are extreme, and Stochastics shows some divergence with price at lows. This is a warning that this trend may be over now or very soon.
Bollinger Bands continue to widen and are now extreme. Some consolidation to contract these bands would be a reasonable expectation soon.
ATR is declining for the last two sessions. This may be the start of a consolidation to bring RSI and Stochastics back from extreme.
This classic analysis is fairly bearish, supporting the alternate Elliott wave count more than the main Elliott wave count.
This analysis is published @ 09:05 p.m. EST.
All but most stalwart of bulls (and of course those trading without leverage) should have been shaken out by the spike down the last few hours. I imagine quite a few stops were run with that decline. A move back above 1175.00 by the open would be a good sign that at the very least near term bounce is underway.
Gold is now stretched beyond its elastic limit to the downside. A break below 1160.00 and I am uber bearish…but not quite yet…
Gold bottomed on the 1st Thursday in December last year (Dec 3)
Tomorrow is the 1st Thursday in Dec (Dec 1)
Gold just shot down to the low 1,160’s
This could be the final flush? Coincidence or not?
Lara and Alan,
It looks like we have a bottom of Minute v Or Wave i at 8:25 PM?
This does not look good for the Bull cause with the monthly Macd cross below zero line and monthly CCI also cross below the zero line; lets see if we get a rebound past 1188….
Stupid of me…I just wrote a detailed comment (w/limited time to do so)…hit wrong key and there it DISappeared!!….so I’ll make this very brief…
1. The Daily Gold- Jordan, owner– went Long today, JNUG looking for a target of $1230- 1250 @ BEST. He still believes longer term, gold needs to make lower lows, but for now sees upside thru late January to relieve what he calls a very Oversold condition.
2. Avi Gilburt- I paid for 1 month to get a feel for his site. General stance on precious metals is still Bullish. He thinks as of Today…there still could be a little more downside.
a. He is a bit concerned about GLD (Daily) since it has lost positive divergence on MACD. Could break below 111- 112. He’ll need to see an impulsive reversal thru 114 before he takes all hedges off.
b. GDX (Daily)- down to 19.80 to 18.70 to complete an ending diagonal. Could take a final ‘woosh’ down and reverse quickly as a sign of completion.
c. @YI (144min.)- Silver futures- wants to see 15.77 to complete c of 2.
Avi’s holds enough confidence in his bullish stance because of GDX and several mining stocks holding in well.
3. STU- Prechter’s site– Steve Hochberg– as of Mon, Nov 28, thinks that Primary X is almost done on downside and we are about to reverse. He has shown Alt. counts up to last week. As of this Monday, no Alt. count. (so far this week).
P.S. I will speak for myself (and likely others)….to let you know how Greatly I appreciate Dreamer’s, Alans, of course particularly Lara’s efforts…. and others. It means a lot to subscribers who’s time is very limited to comment on a regular basis because of other demands.
Lara….I know this is your business, but I give you GREAT credit for getting up each and everyday with your husband behind you and going at it again in these challenging markets.
Again….Thank you…Melanie
Melanie, thanks for all the updates. Miner strength and multiple divergences makes me think that the bottom is in or very close.
Thanks for all that input Melanie. You do well when you have little time! I’m still trying to figure out what day it is!
TJ
Gold’s 4 hour chart shows clear bullish divergence with price trending down to low of today. Once again if price breaks here to upside gold may have put in the interim low.
May be some one can post a chart here.
Lara ,
I have not posted before . Here is what I have read and hope it makes sense and helpful . Like what Mr. Alan Tham said , GOLD crashing to new Low is even harder to believe . The % Bullishness in Stockchart, $BPGDM is at 7% and ready to bounce. IF not , at 0% , it will .
The 3 or any of its sub-3 in EW must have the maximum Momentum , which in this case is at Primary X ( 1172), negative Max Momentum for the downtrend .
At 4 , the MACD bounces back to / around zero or neutral .
At 5 , the MACD drops again to the negative side , but it will not be lower than the MACD at the earlier 3 or sub- 3 . This will give a Divergence , saying it will bounce/ reverse soon .
The above mentioned can be observed at your Main Hourly chart .
I think the drop now that just broke to a new Low is looking for its terminal 5 .
For this to work , there must be at least 120 candles from 1 to 5 , so use the Hourly chart , counting from Blue B . Instead of the MACD , it is best to use the EW Oscillator available in NetDania.com , etc . The Awesome Oscillator will work too , but the MACD will do . .
Sorry , I don’t know enough to count , I can only read counted EW .
Great effort , Lara . I trust your work .
Regards ,
Raymond .
I agree Raymond, it’s hard to see Gold continuing much lower from here. Too many extreme readings and divergence at lows.
Good morning everybody, I’m well enough to drink coffee so all is good with the world 🙂
This slight new low for Gold should see me swap the wave counts over…. but I need to really take some time to consider the whole picture before I make that decision. The alternate has some big problems in terms of structure and behaviour with channels that really must reduce it’s probability.
I think I’ll have to go over big picture charts (monthly and weekly) and may do another video for that today.
Gold is currently within a corrective pattern for a B wave. These are the most complicated of affairs to analyse, there are more than 23 possible structures and they exhibit the greatest variety in form. That means currently the analysis is complicated. I’ll give it another shot at explaining the complexity as clearly as possible today.
Short term: Indicators are extreme. If this slight new low shows divergence with price and RSI today then I’ll expect a low is in for now at least and a consolidation may develop here for about a week to resolve the extreme indicators.
The long lower wick on the current candlestick makes me think sub-micro (4) may be incomplete.
For now this is the alternate II updated. I’ll take a look now at how the main might fit.
I think the first thing I need to do is do a quantitative analysis of the frequency of leading diagonals on the daily chart as suggested earlier by John.
Lots of work to do today.
Miners are showing relative strength to gold. They have not made a new low at least so far. The bottom could be in or very close as Alan’s count suggests.
Yep. I kinda backed into a long position by selling 8.0 strike NUGT puts expiring January. I am happy to take assignment as low as 6.5 for a break-even entry price. I don’t think it will get that low…
Good stuff by Gold price. IMO notwithstanding upside risk, anything back above 1185+ should be a good place to short this lol…. Monthly RSI, StochRSI, Macd, CCI indicates a lot more downside to go; keeping downside target open 1166/1123/1101…Lets see how this works for me.// With ADX on the daily at 26 and on the rise, will probably keep shorts open until ADX starts to get to 45
Syed. For me, I will wait for the rebound off 1167-1165 before considering shorting. That rebound could provide a clue whether the market follows the Main or the Second Alternate count (according to my post). As much as I hate it, the bearish scenario appears to be more likely at the present moment, as per my analysis yesterday.
I may even take a quick swipe off the rebound. It might reach 1200 thereabouts.
S&P double top?
Gold double bottom?
Hi Alan. Your feedback and comments are most valuable specially for a newbie like me… 🙂 Presently not expecting a rebound from current level 1175-ish to get back up to or past 1193-97 if at all; keeping my options open though should Gold price manage to get past a rapidly falling trend line at 1219. Lets see how this closes today. RSI on the hourly & 4-hourly is still floating about above 30, I recon there is room for some downside here.
I was looking at the possibilities given the drop below 1172.10.
The popular choice would be that the Second Alternate is in play. The low at 1171.11 was submicro 3 of micro 5 of subminuette 1. After the current rebound to maybe 1180, the drop target of 1167-1165 will be called into play.
I still can’t embrace a bear market (with a target of 832.63, being the 0.618 retrace of Cycle A), and so I was considering if the more bullish scenario, the Main Count, could be resuscitated. I revisited Minor C and considered what if 1172.10 was only minuette 3 of Minute 5, and not the terminus of Minute 5. This yields Minute 5 dropping from 1197.32 in five waves. 1171.11 was the third, and now the drop is in agreement with that of the Second Alternate. What it implies is that the target of 1167-1165 will be the conclusion of Minute 5, Minor C, and hence Primary X. Subsequent movement will then target 1494-1497 (a slight change from 1500).
Let’s see how this will play out.
Alan,
Nice work, thanks. Agree [iii] wave extensions are best counted after completion as they extend so often
I agree Alan, that looks entirely plausible. That’s how I’ll adjust the main wave count today.
So short term both wave counts are in agreement. How high the next wave goes, and how price behaves in the early stage on the way up, will tell us which count is correct.
Thank you very much for your counts and comments Alan.
Main Hourly wave count got invalidated as gold is trading below 1172.10.
Lara will swap the main wave count and gold appears to be in a bearish trend???
Probably final shake-out of few remaining bulls. Sentiment indicators now more extreme than January lows so I suspect a turn is not far off…after all we Elliotticians believe sentiment is what drives price and we are just about out of sellers! 🙂
If you are in the market for one ounce silver coins, the NZ mint’s 1 oz HMS bounty is currently the cheapest one ounce coin on the market. Get ’em while they’re hot! 🙂
Nice, thanks for that info, how do I order?
If you are going to make a large order (10K or more), best to call the mint and order directly. 64 800 696 465
These guys are pretty good on the retail side: https://www.moneymetals.com/hms-bounty-silver-1-oz-999/240
Thanks Verne! I just found that too 🙂
Verne, I’m looking for that on NZMint.com and I can’t find it?
I like the look of this one though. Price per weight looks to be the best. But it’s still much more expensive than the spot price!
From AVI:
“For now, my primary expectation is that the markets are bottoming, and are going to begin their next bull market phase in the near term. As long as silver holds 16, GLD holds the 111/112 region, and GDX holds 19.80, then there is nothing to worry about. However, as I have noted many times, the metals may spike below their ideal supports, and then strongly reverse, which often happens in markets, as it shakes out those counting on support to hold and then turns back up. This is why one should always place their stops just under their ideal support regions.
So, I will note that there is a 15.75 level of secondary support below in silver and 18.70 in GDX, below which the bears can very well take control of the market again to drop it to levels lower than those seen this past December and January. A break below 18.70 in GDX will then set us up for a test of 16.50-17, which if broken, points to as low as 7-9 in the GDX. Again, this is not my primary expectation at this point in time, but I always have to understand the risk in the market at any point in time so that I am seeing the market as it is rather than as I hope it to be.”
https://goldtadise.com/?p=388523#comments