
Another very small range day completes a small doji candlestick. This fits neatly with the expectations short term for the Elliott wave count.
Summary: It still looks like another new low may unfold before Gold either turns or begins a time consuming consolidation. The target is either 1,116 – 1,114 or 1,118.
New updates to this analysis are in bold.
Last monthly and weekly analysis is here, video is here.
Grand SuperCycle analysis is here.
MAIN ELLIOTT WAVE COUNT
The first daily chart will not be published today. The idea is still just valid, but price behaviour strongly suggests it is wrong. For reference it was last published here.
SECOND DAILY CHART
Click chart to enlarge.
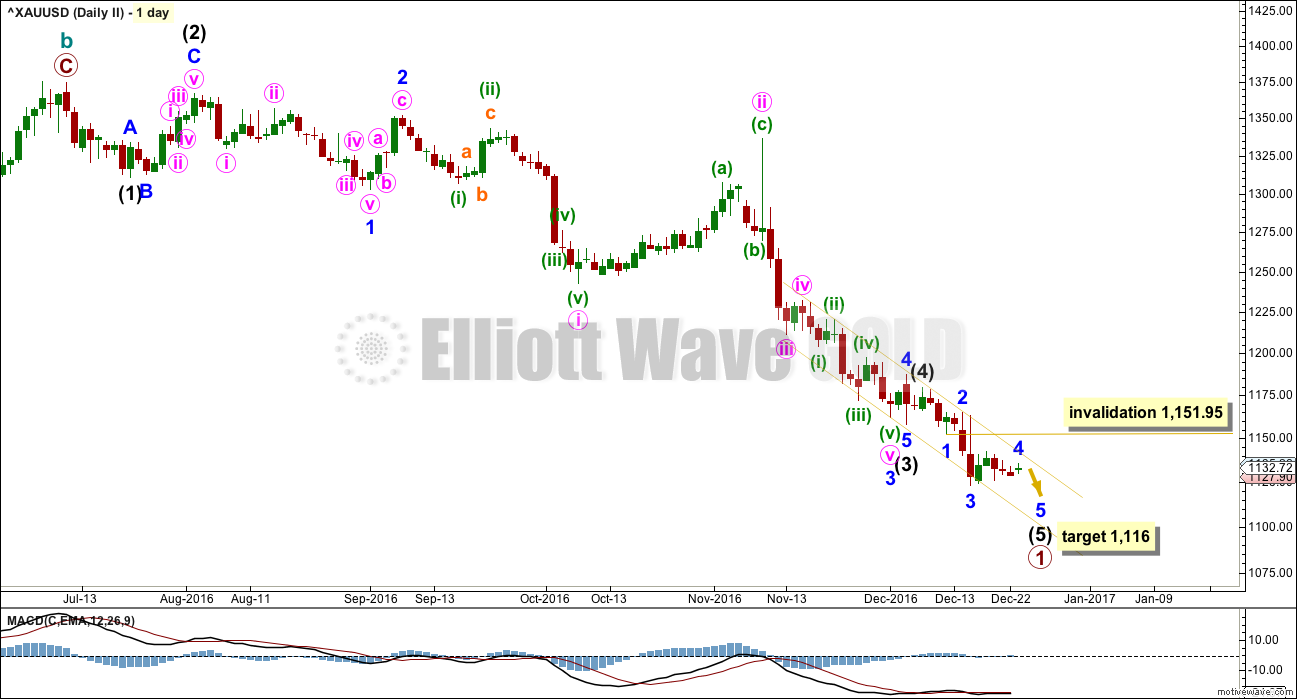
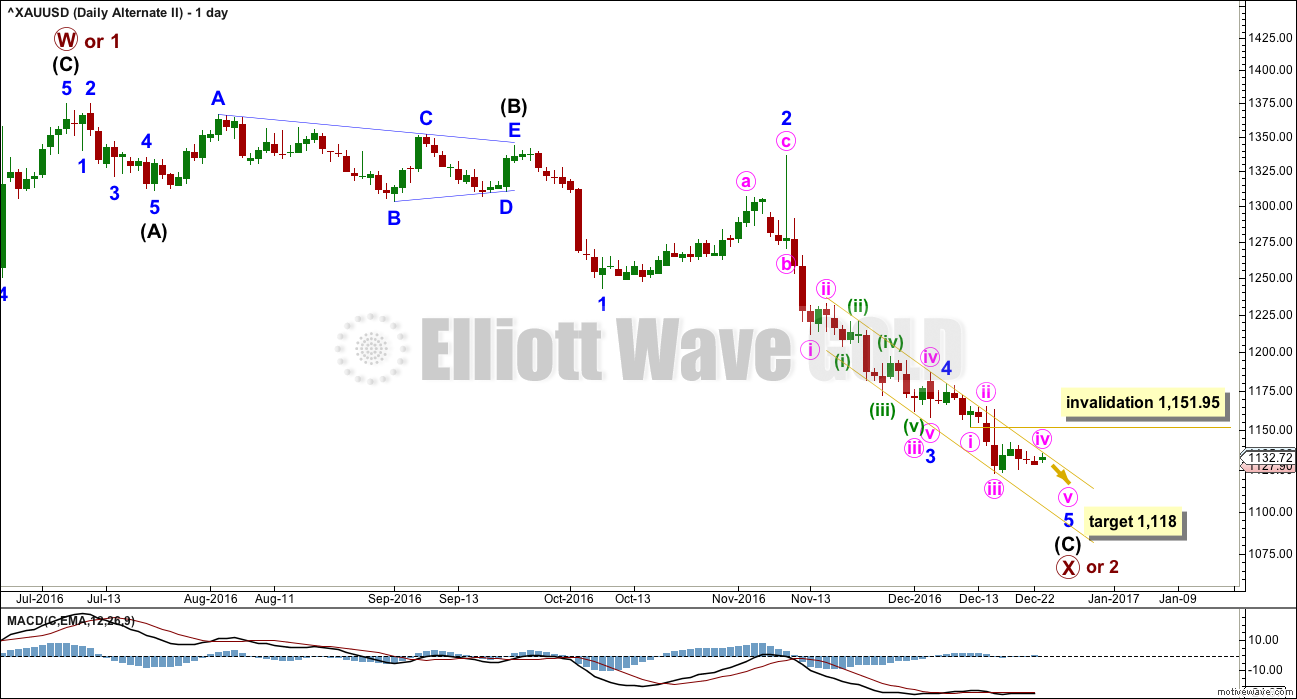
This main wave count expects that Gold remains in a bear market. Downwards movement is seen as an unfolding impulse for primary wave 1 of cycle wave c.
If an impulse is unfolding lower, then there is a problem of proportion between the correction labelled minute wave ii and the two earlier corrections labelled minor wave 2 and intermediate wave (2). Minute wave ii is much longer in duration than second wave corrections one and two degrees higher. This reduces the probability of this wave count.
Also, this wave count must ignore what looks like a fairly obvious triangle early on in this downwards movement; a triangle may not be the sole corrective structure of a second wave.
Intermediate wave (3) has no Fibonacci ratio to intermediate wave (1). It is more likely then that intermediate wave (5) will exhibit a ratio to either of (1) or (3). At 1,116 intermediate wave (5) would reach equality in length with intermediate wave (1).
Ratios within intermediate wave (3) are: minor wave 3 has no Fibonacci ratio to minor wave 1, and minor wave 5 is 1.27 longer than 0.146 the length of minor wave 3.
Ratios within minor wave 3 are: minute wave iii has no Fibonacci ratio to minute wave i, and minute wave v is 2.97 longer than 0.618 the length of minute wave i.
Ratios within minute wave v of minor wave 3 are: minuette wave (iii) is 2.65 longer than 1.618 the length of minuette wave (i), and minuette wave (v) has no Fibonacci ratio to either of minuette waves (i) or (iii).
Within intermediate wave (5) so far, minor wave 3 is 3.31 shorter than 1.618 the length of minor wave 1. Minor wave 5 may not exhibit a Fibonacci ratio to either of minor waves 1 or 3.
While price remains within the best fit yellow channel, it should be expected that the downwards trend remains intact. This wave count expects one more low and then a trend change for Gold.
Minor wave 4 may not move into minor wave 1 price territory above 1,151.95. At any stage, a new high above this point and above the yellow channel would indicate a trend change for Gold. Use this channel and this price point as confirmation of a low in place for Gold.
I have three hourly charts for you in an attempt to cover multiple possibilities for this fourth wave correction. They are presented in order of probability. All three work in the same way for the alternate wave count.
HOURLY CHART
Click chart to enlarge.
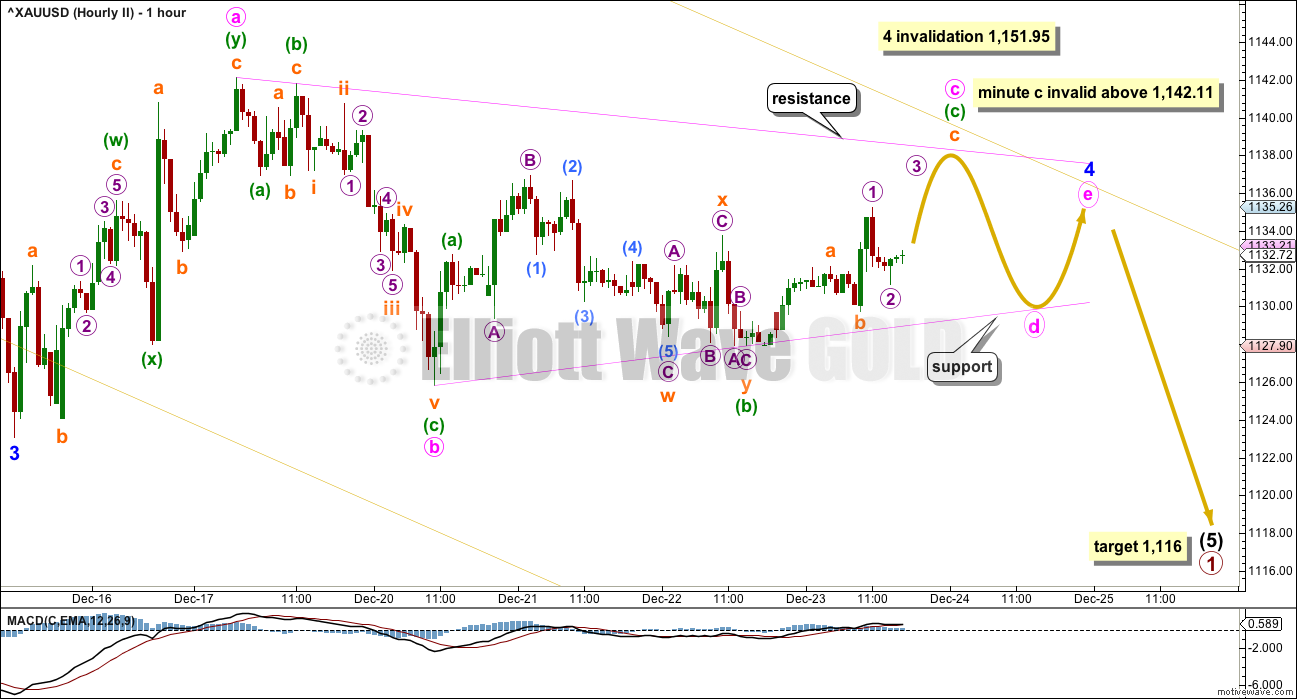
It looks most likely at this stage that the triangle for the fourth wave is incomplete.
Triangles normally adhere well to their trend lines. They may occasionally have some small overshoots but they should not breach trend lines.
The A-C trend line here is drawn across highs. This line may be where minute wave c ends. Minute wave c may not move beyond the end of minute wave a above 1,142.11. This invalidation point for the triangle is black and white.
The lower B-D trend line is also drawn across lows. This may be where minute wave d ends. Minute wave d for a contracting triangle may not move beyond the end of minute wave b below 1,125.80. For a barrier triangle, minute wave d may end about the same level as minute wave b. A triangle will remain valid as long as the B-D trend line remains essentially flat. In practice, this means minute wave d may end slightly below minute wave b. This invalidation point is not black and white; this is the only Elliott wave rule that is not black and white.
The final zigzag for minute wave e is most likely to fall short of the A-C trend line. If it does, it may end when price comes up again to touch the yellow channel. If minute wave e does not end there, then it may overshoot the A-C trend line.
This wave count is perfectly in line with the S&P for the short term; Gold and the S&P are mirror images at this stage.
When a triangle is complete, then expect a following fifth wave down. Gold often exhibits fifth waves out of its fourth wave triangles, which are surprisingly short and brief.
After a new low, Gold is expected to then turn and move overall higher for several weeks. Draw a Fibonacci retracement along the length of primary wave 1 and use the 0.618 Fibonacci ratio as a target for primary wave 2.
HOURLY CHART – FIRST ALTERNATE
Click chart to enlarge.
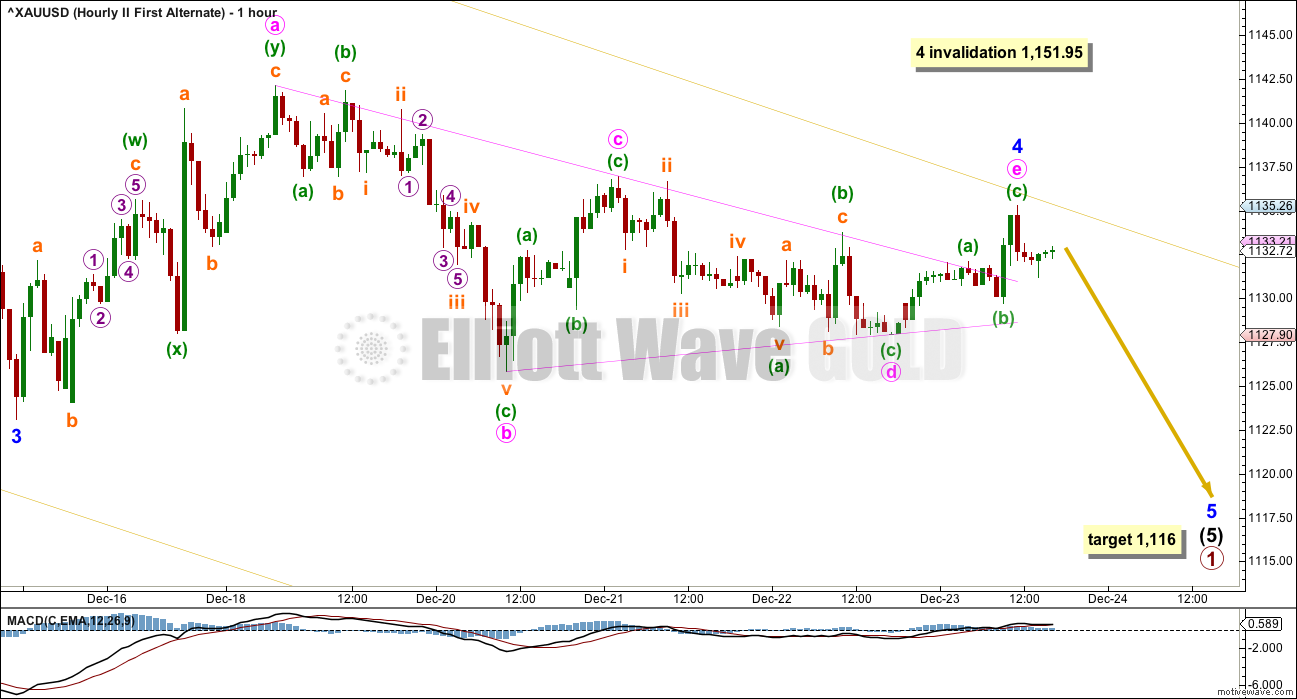
This hourly chart follows on directly from how the triangle was labelled in last analysis. It is possible that the triangle is complete.
The final wave E of triangles most often undershoots the A-C trend line. If it overshoots, then it usually does so quickly and not by too much. The overshoot here is large and time consuming. This does not look quite right, but it does fit and should be considered.
If this wave count is correct, then a new low reasonably below 1,125.80 would indicate it is more likely. At that stage, expect the target to be reached and a new low.
Thereafter, still expect a primary degree trend change for Gold.
HOURLY CHART – SECOND ALTERNATE
Click chart to enlarge.
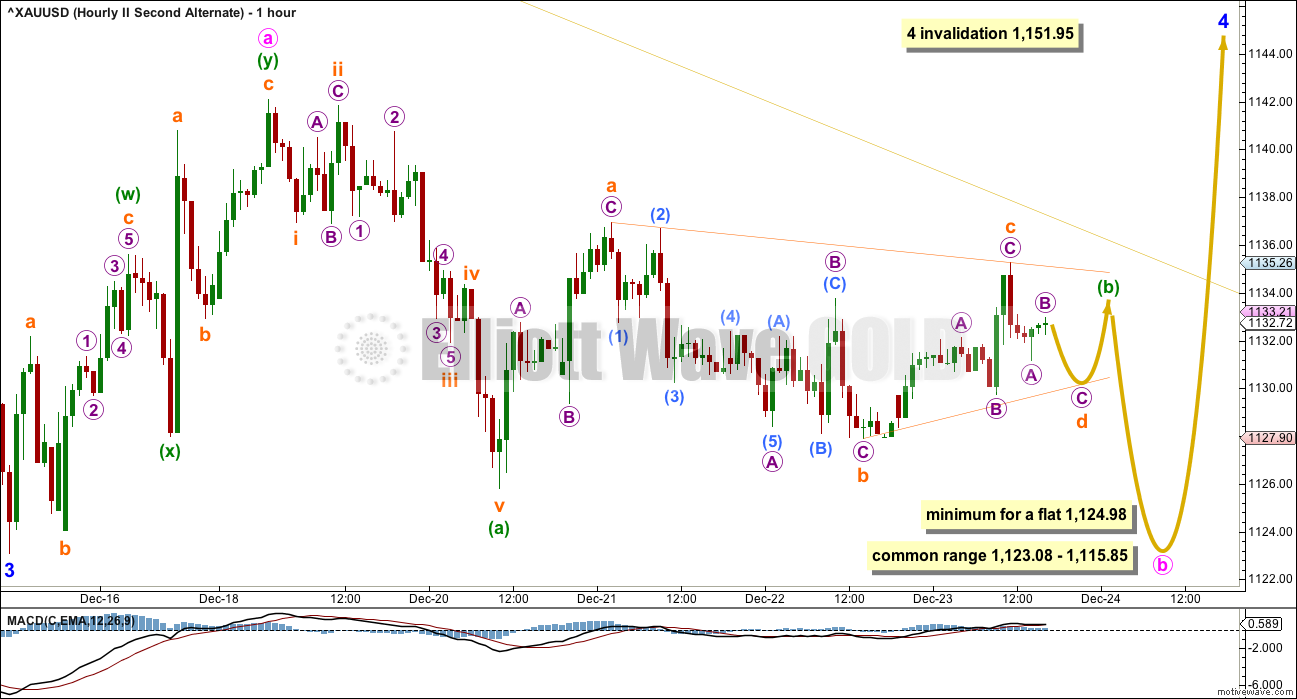
What if Gold is not completing a fourth wave triangle? What if the fourth wave is unfolding as a flat correction?
Within a flat, both waves A and B must unfold as three wave structures.
Minute wave a here is a double zigzag, which is classified as a three.
Minute wave b may be completing a zigzag and within it minuette wave (b) may be a small triangle.
Within the flat, minute wave b must retrace a minimum 0.9 length of minute wave a at 1,124.98. This minimum has not yet been met, so minute wave b cannot be complete.
The normal range for minute wave b within a flat correction is from 1 to 1.38 the length of minute wave a at 1,123.08 to 1,115.85.
This wave count expects essentially the same movement next as the first hourly wave count: a little more sideways movement, followed by a downwards breakout to about the same point, then a reversal. The risk here is that it will be impossible to know for sure which one is correct if price follows this expected pathway, and as they both expect the same subdivisions a careful analysis of Elliott wave structure will not be helpful either.
This wave count essentially illustrates the risk that not one but two more lows may be seen before Gold finds its final low.
At its end, minor wave 4 would see a substantial overshoot of the upper edge of the yellow channel. If this is quickly reversed, then this wave count would be possible. But if the overshoot is deep and time consuming, then this wave count should be discarded.
Minor wave 4 may not move into minor wave 1 price territory above 1,151.95. This is the price point which will differentiate between the main hourly chart and this second alternate.
ALTERNATE ELLIOTT WAVE COUNT
The first alternate daily chart will also not be published today. Price behaviour does not support it at this stage.
SECOND DAILY CHART
Click chart to enlarge.
This alternate wave count expects that a zigzag is unfolding downwards within a larger continuing bull market for Gold. When primary wave X or 2 is complete, then this wave count expects the bull market to resume for Gold to new highs.
This triangle for resolves the problem of proportion that the main wave count has. It sees a triangle unfolding early on in this downwards movement as intermediate wave (B).
Within intermediate wave (C), minor wave 3 is 15.48 longer than 1.618 the length of minor wave 1. This is a big difference but less than 10% the length of minor wave 3, so it may be considered a reasonable Fibonacci ratio.
Ratios within minor wave 3 are: minute wave iii is 6.44 short of 0.618 the length of minute wave i, and minute wave v is just 0.34 short of 0.236 the length of minute wave i.
Ratios within minute wave iii are: minuette wave (iii) is 2.56 longer than 1.618 the length of minuette wave (i), and minuette wave (v) has no Fibonacci ratio to either of minuette waves (i) or (iii).
Within minor wave 5 so far, minute wave iii is 3.31 short of 1.618 the length of minute wave i.
At 1,118 minor wave 5 would reach 0.618 the length of minor wave 1.
Minute wave iv may not move into minute wave i price territory above 1,151.95.
Hourly charts will not be provided here for this alternate. They would look exactly the same as the three hourly charts for the main wave count. All three ideas also work in exactly the same way for this alternate wave count. For this alternate, the degree of labelling at the hourly chart level would all be one degree lower.
TECHNICAL ANALYSIS
WEEKLY CHART
Click chart to enlarge. Chart courtesy of StockCharts.com.
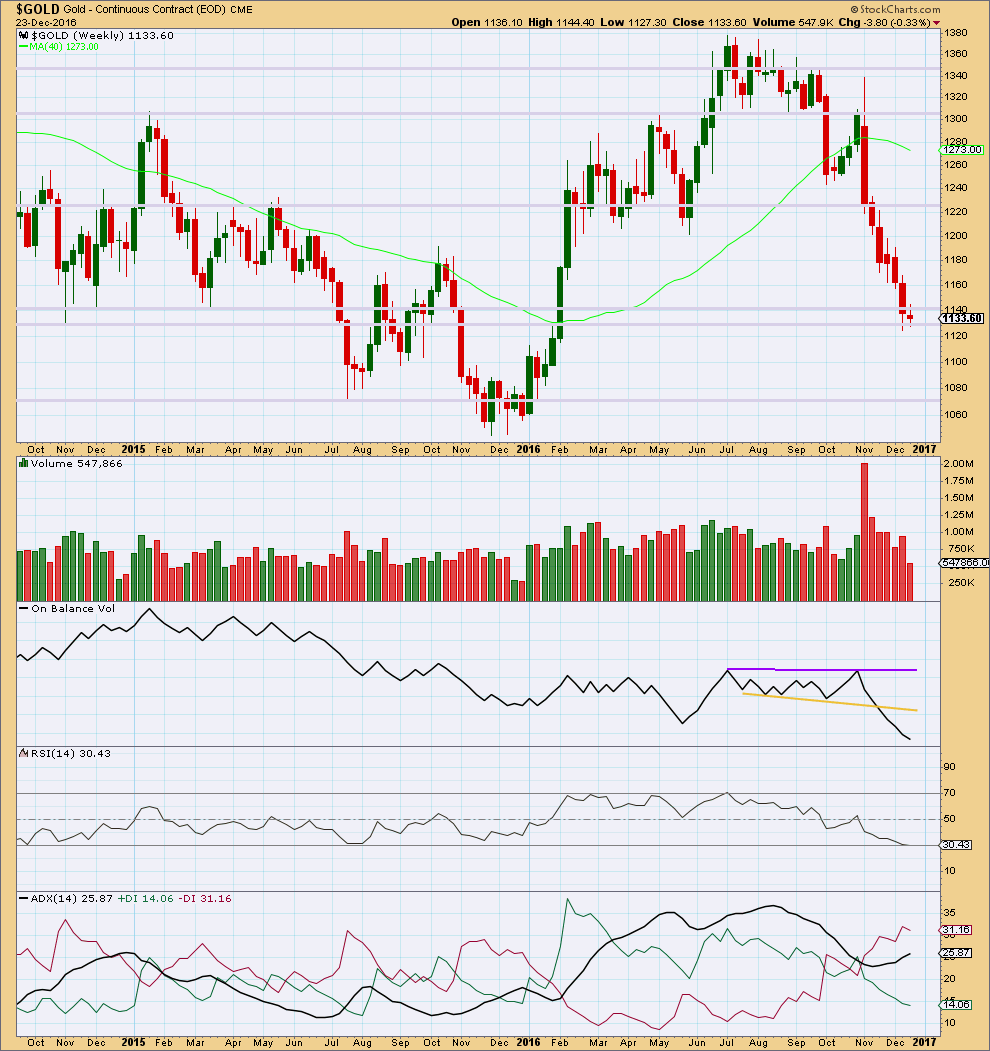
A small inside week is finding strong support about 1,130. Overall, the week closed red on lighter volume. The fall in price was not supported by volume this week. This looks like a small consolidation.
Price for the last three weeks is falling with declining volume. The fall in price is not supported by volume; the market is falling of its own weight. This is not a sign of a healthy sustainable trend.
There is no support line close by for On Balance Volume.
RSI is close to but not yet oversold. There is room for price to fall further.
ADX is indicating a healthy downwards trend with plenty of room to continue. It is not extreme as it is below 35. The -DX line is above the +DX line. The black ADX line is not above the -DX line yet, so this trend is not extreme.
DAILY CHART
Click chart to enlarge. Chart courtesy of StockCharts.com.
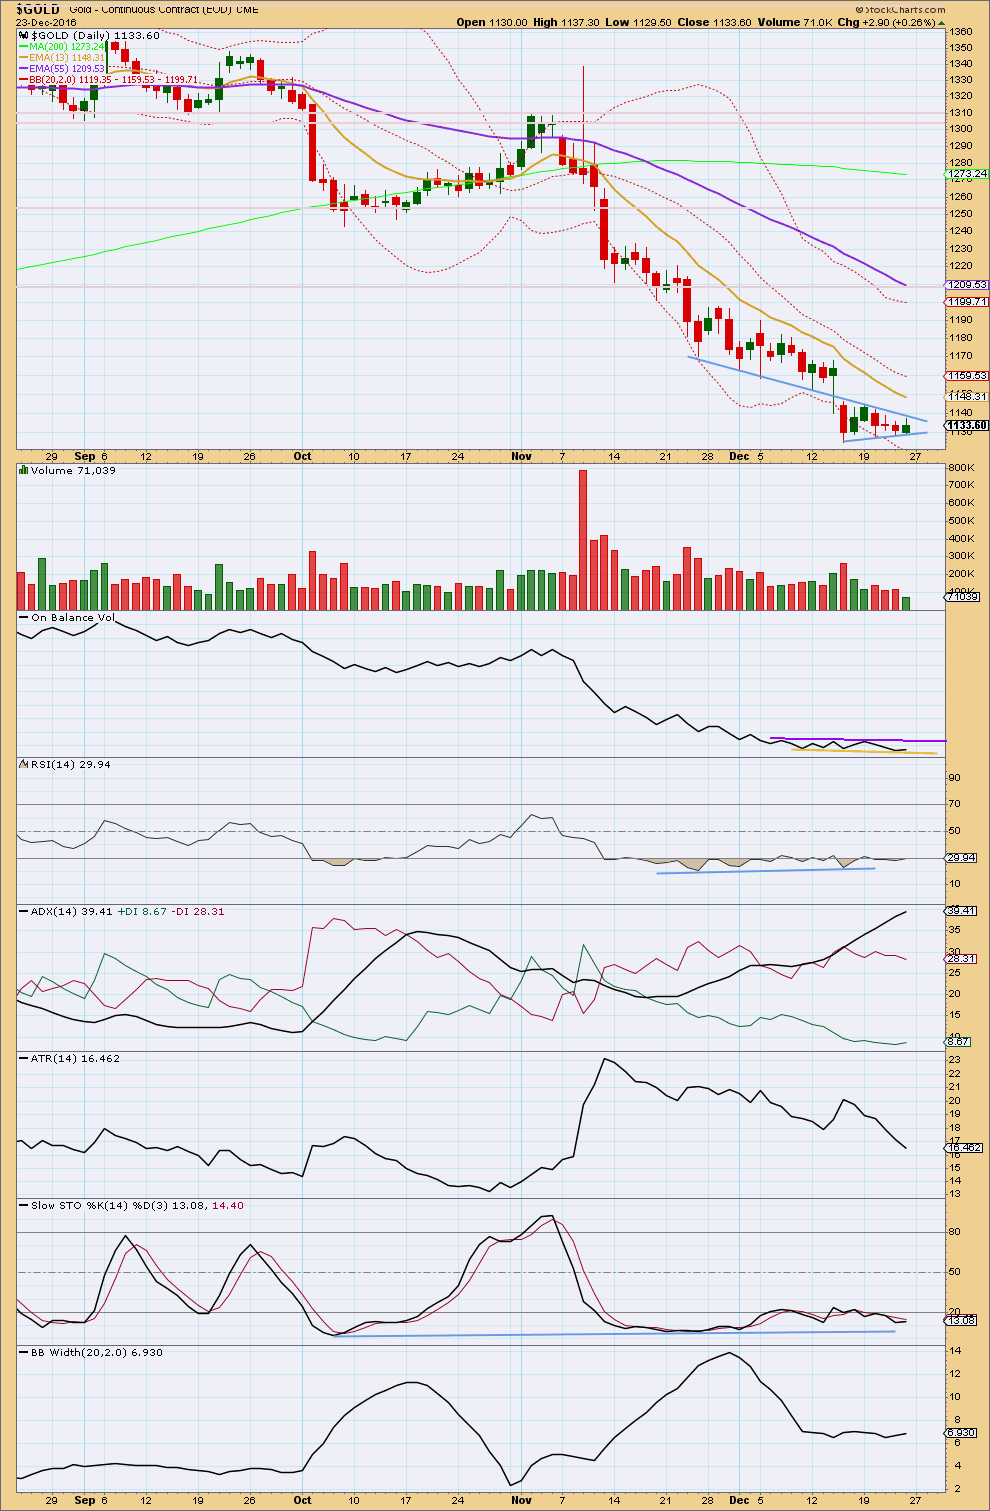
A small pennant pattern is unfolding. These are fairly reliable continuation patterns. The breakout is most likely to be downwards.
The pattern is supported by declining volume as price moves sideways.
A target about 1,085 is calculated using the measured rule.
On Balance Volume remains constrained. A breakout may indicate the next direction for price.
The trend is down. Price is below all three moving averages and all three are pointing downwards.
The trend is extreme though. ADX is above 35 and the black ADX line is above both -DX and +DX lines.
ATR is declining as price moves sideways in the pennant pattern. This is normal for a consolidation.
Both Stochastics and RSI are oversold and both exhibit divergence.
The trend is nearing its end, but the pennant pattern indicates at least one more low before it turns.
GDX DAILY CHART
Click chart to enlarge. Chart courtesy of StockCharts.com.
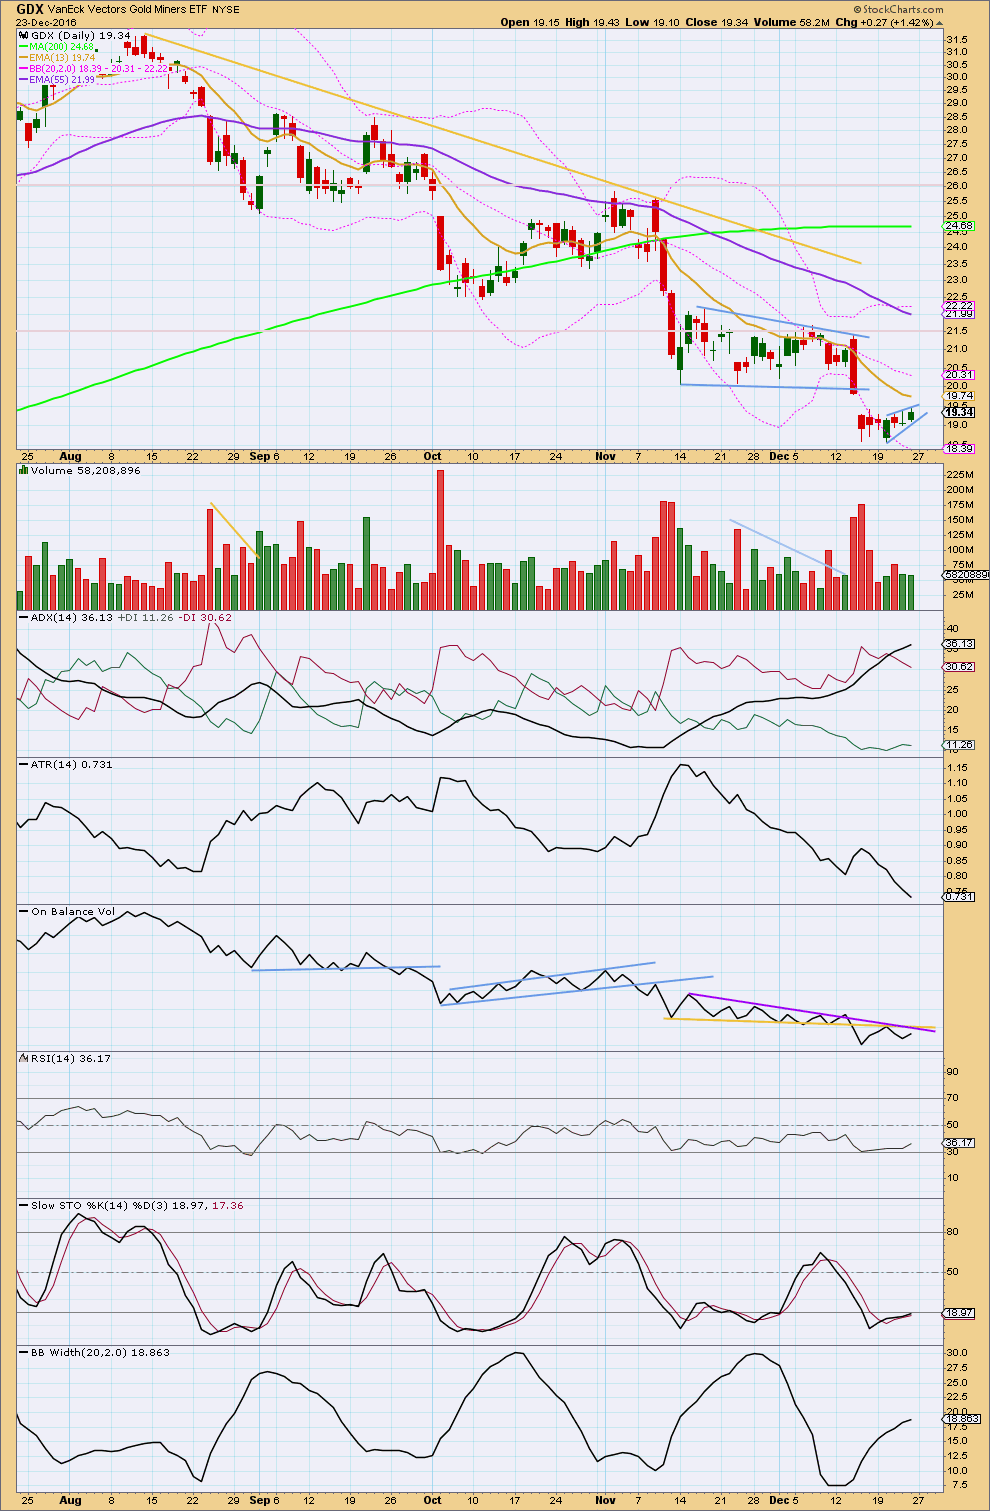
The larger flag pattern gives a target about 14.50. The breakaway gap out of the pattern is still providing resistance.
A smaller consolidation looks like it is unfolding. I have drawn tentative pennant pattern lines across it today. If this pattern is correct, the breakout should be downwards. The mast is 2.8 in length, so the target would be about 16.2.
ADX is now extreme above 35. The black ADX line is now above both the +DX and -DX lines indicating an extreme trend.
The target at 14.50 may be too optimistic.
The yellow line on On Balance Volume is slightly adjusted. This is now providing resistance. A break above either of these lines would be a bullish signal from GDX. If that happens, then a low may be in place.
This analysis is published @ 12:15 a.m. EST on 24th December, 2016.
I reckon that for the Main Count, 1170.87 was the termination point of Minute 4. The subsequent rise was part of Minute 5.
With the rise to 1185.53, if the Alternate Count, with Intermediate 1 set at 1184.12 is correct, then 1170.87 would be Intermediate 2, and we are now in the third wave. However, I favour moving everything down by one degree.
Nugt, big miners, lagging Jnug, small miners by large margin, seems like large miners not buying this rally.
Could it be possible that this may be an expanded flat for 4.?
We never got down to 1167 the .618 retrace level
They should stay above the channel breakout. A flat is possible. Could be Intermediate 2.
Welcome back Lara, hope you had a wonderful Christmas and started 2017 with some great waves. I am looking forward to the Oil update, really interested to see if we still expect much more movement up or is it starting to turn down now?
Kindly
Ursula
I will be updating Oil later today.
I’m onto the S&P now.
On PM Bull in 4 hour period one can see a clear confirmed bullish divergence of price to MACD.
Lat low came in at 1124 on 12-15-2016 vs on 11-13-2015 gold price was 1212 while MACD had dropped to -13+.
It appears gold has seen the low at 1124.
Almost 7PM EST now and gold is trading around 1173 and silver at 16.52.
Four hour HnS that formed last week in silver/gold have been back tested on Jan 5 for silver. The back test came at 16.25 right at the NL of HnS.
But gold has not back tested the break out of Jan 04.
So far 4 hour HnS is holding as bullish pattern. If prices drop below RS than HnS will be negated.
Have a good trading next week.
When Lara buys I am ready to buy.
So much to consider! I have a lot of work to do for tomorrows report. I’ll be doing a video also as I think it’s necessary after the holiday.
Thank you all very much for your understanding that time off is necessary. I didn’t have a holiday for six years, and last year it became apparent that if I didn’t take one annually that this website would have to be closed. And I’m pretty sure there are plenty of folks who don’t want that to happen, including myself.
It looks like we have a low in place for Gold now, it didn’t make that one final new low that I was expecting.
How high this next wave goes and what structure it takes may tell us which wave count is correct, and whether or not Gold is in a new bull market or the bear continues.
The move down on Friday took price out of the channel I had drawn for it. It now looks to be too big to be minute iv, it would be disproportionate to minute ii.
I can handle disproportion to some extent, and it’s common for Gold to exhibit longer lasting second waves than it’s fourth waves. But for a fourth wave to be that long in duration doesn’t look normal for this market.
So I’m considering what if intermediate (1) is over already, no final high may eventuate. Intermediate (1) (or A) may already be over. The first deep correction may have begun on Friday.
Updated hourly chart:
Hi Lara. Thanks for your timely update, and the warning that the Alternate count could be correct.
I am wondering if you would want to consider, at least at the back of the mind, the possibility that everything after Primary 2 be moved down one degree. That means Intermediate 1 becomes Minor 1. In that way, there is no need for a big spike in price at the third and/or fifth wave level to reach the target of 1452 / 1655.
Alan
What is the target for wave (2) deep correction? May be .618 fib down to 1147??
Yes, Papudi. That is what I think too.
Yes, another good point.
I’ll be spending some time going over charts before tomorrows report, and this is one thing I need to consider.
I’ve labelled it at intermediate degree so far because that looks right after I’ve gone back and looked at what happened after the December 2015 low.
This sharp drop may coincide with some short covering spike in the stock market.
Lara, when you look at the daily channels that I have charted here, both gold and GDX broke above their channels on Thursday and back tested them on Friday. If this is a true move off the bottom, I would think that they need to go higher before a deep correction.
That would allow them both to stay above the channels with a second, deeper back test. A deep correction now would make it look like a false breakout and would jeopardize the idea that the bottom is in.
Just my thoughts. We’ll see what next week brings.
That’s a good point Dreamer. I’ll look at your trend lines and I’ll probably have more than one count for each at the hourly chart level.
I agree, once breached and back tested those lines are likely to hold.
I’m also looking at what happened after the low in December 2015. The first in a series of three deep second wave corrections was a 0.97 depth.
A look at the gold daily downtrend channel and breakout
Thanks for that great chart Dreamer. I can also see three waves up so far in SLV with a fourth wave correction now underway. A drop back to test that broken down-trend line seems to be underway. hopefully followed by a strong extended fifth wave up to conclude the current impulse.
I’m replicating that channel on my daily chart Dreamer, and I’m not sure that it is going to work as you may be expecting.
I really would much rather pull the upper trend line much lower to sit across all the highs that were made from 15th November to 15th December, in other words, the gold channel I have on my daily charts in the main body of the analysis posted above.
A trend line that may very well provide support quite soon would be one drawn from the lows of 21st July to 7th October, shown in the chart posted here in lilac. It was also tested neatly on 14th November then broken through on 23rd November. Backtested on 28th November. Now it’s been breached two sessions ago.
Will it provide support now?
I don’t see any reason to change Lara’s last hourly gold count. It still looks like one more leg up is needed to complete Intermediate wave 1. The move may end in the 1,190’s near the top of the channel.
I agree with your view. Lara’s wave count is still intact. At the market close, we were just negotiating subminuette 4 of minuette C. One slight drop would complete Minute 4, on Monday. The drop should take us close to the 0.618 Fib of Minute 3, at 1166.86. Thereafter, Minute 5 ought to rise above 1184.12 (the high of Minute 3) in order to prevent a truncation. I had deliberated on this at length in my previous posts. If the 5th wave shows any strength, it may target the 1190s. At equality with Minute 3, it would be in the region of 1194.
Alan, thanks for your comments. Always good to have a second set of eyes and I like your detail on Fibs and targets!
I was waiting for that fifth to end Friday but it never came. I bought a bit of Jnug just in case we get a quick move down to 1167 and then a move up Sunday night when the us markets are closed.
Also I thought the trade deficit being 45 billion vs. 44 expected plus the employment numbers starting to wane a bit as bullish for gold. The u.s markets are a conundrum to me and while I would expect a correction soon after 20000, it may take some short covering spike before that ends. If this is the case it would probably strengthen the dollar and be negative for gold and push it down further than the 61.8 correction currently anticipated.
Gold technical indicators are also looking good, albeit not as strong as GDX.
Very nicely done Dreamer, thank you very much for that 🙂
The back test today came within 2 cents of my 22.00 back test target. While it’s possible that GDX corrects more sideways / down, if you look back at January 2016, you will see that corrections in GDX were shallow and quick.
Today was an opportunity to join the uptrend. Strong moves off the bottom usually do not offer many good opportunities to join the move.
GDX back tested the upwards breakout Friday. Technical indicators continue to favor the bulls. Miners are leading the move up.
Nice chart and work, thanks. Let’s see what happens on Monday.
I know, being Friday and after yesterdays run, it is extremely quiet. I am uploading a 15min XAUUSD chart, Investing.com (Invalidation of Minute i @ 1163.89), snag taken @ 1:45pm.
1. Minute iv of Minor 5 is now more than 3x as long as Minute ii and getting close to 0.382. The interpretation on this chart is that we may have a small Micro 5 to go and then a turn up to finish Minor 5. If this is correct, Targets: from 1170.06 , 1.0=1186.18, 1.382=1192.34, 1.618= 1196.14.
2. My alternative is that we have Topped in Minor 5, but action seems too slow and sideways for a top to have come in and it doesn’t look quite right on daily/hourly charts.
Anyway, I am uploading this (if successful). Would appreciate any feedback.
Happy weekend!
I am not doing any trades till Tuesday. Like to read Lara’s new report on Monday.
Lara will be fresh , energized and full of new ideas on the EW counts.
Very Excited.
Every one did good job posting their ideas and wave counts. Thanks to all.
And yet, this may be the best time to enter before wave 3 up.
According to Lara’s chart it looks like we are going down to 1166.86, a .618 retrace. If not then maybe a 5 that was shortened. Appear to have made an a down and b up move, now in wave c down perhaps to about 1167. 1162 is Lara’s invalidation of this possible 5th wave up.
Hi Dermot – Thanks for you guidance this morning!!!
To Dreamer… excellent charts on topics that benefit all traders. Keepers for sure!!
Melanie – Thank you for offering a reply to my stop loss question. In short, managing stop losses can be quite difficult without access to the futures market.
Lara mentioned the possibility of a blow off top following the NFP report. It sure looks like that took place. If so, then this would indicate that Intermediate 1 is complete and Intermediate 2 would begin. Lara indicated that Intermediate 2 would be a deep correction. Does anyone have a guess as to how long Intermediate 2 would take to complete?
Ironically, gold continues to show strength and climbing after reaching 1170 – 1171 (depending on the chart you’re using).
If anyone can give a shout out as to when they’re going long, I’d appreciate it.
Well, 1167 has not been reached. I’m not a EW expert. The count may have changed and I’m sitting on the sidelines until it becomes clearer to me.
Video: Gold Stocks Showing Positive Divergence
https://thedailygold.com/video-gold-stocks-showing-positive-divergence/
Can you buy and hold 3x ETF’s?
The answer is yes, but you better be sure that you are holding during a strong trending (impulse) move. You can then “compound” your gains and get a return even greater than the daily 3X amount that these instruments are designed for.
Caution is advised though. If the trade goes against you, you can lose your money just as quick!
Here’s an example of GDX and NUGT. See comments on chart for details.
Here’s the same comparison for GDXJ and JNUG. Even bigger gains are possible, but beware, big losses are possible if the trade goes against you.
GDX is acting like it did off the bottom last January. Shallow and quick corrections that offer little opportunity to join the rally.
Today gapped above key resistance. It may be one or two more up days before a reversal and short correction. For those that want to buy the miners, I don’t think GDX will go much below 22 which will be a gap fill and back test of the breakout.
I moved my labeling up one degree as this rally is very strong.
Melanie, you asked about NUGT leading gold?
Here’s a chart of GDX:$GOLD. As you can see, GDX led Gold all the way up from Jan-Aug. In a healthy Bull market, I think you’ll always see miners leading. A NUGT:$GOLD chart looks very similar.
GDX also looks like the move below support was a “false move”.
Gold back in the Green channel.
Thank you for your comments Lara… I know you are making an effort to watch as you’de like to trade this opportunity also….BUT it IS VERY KIND of you to take time from your vacation to help us….thanks.
Lara, I appreciate the comment on (iv) @ 0.382. Price seems to be consolidating sideways instead of downish. Looks like things are Bullish upward towards 1200 for now.
Stephen…I am sure others may have insight to add, but on NFP…it is backward looking. We just completed the Holiday Season. They had to hire additional help no matter whether Retail (excluding Amazon) did well or not…so wouldn’t this help to likely stabilize the number somewhere in the range of consensus….
From Fidelity Research:
Consensus:
Released On 1/6/2017 8:30:00 AM For Dec, 2016
Prior Consensus Consensu Range, Jan 06
Nonfarm Payrolls – M/M change 178,000 175,000 151,000 to 210,000
That said news reports today suggest many Brick and Mortars did not do well this Holiday. Even if NFP is within range….don’t things Remain Uncertain for retail, inflation, and the fact that we have a New administration coming in. These factors may just drive gold to 1197ish as Alan is indicating regardless. I will agree. It is just a short term trade. As Lara indicates, the longer term opportunity Is the wave (2) pullback. I don’t know of any great way to use stops in this instance.
I have not been a futures trader, but have watched everyday for a few years. I have decided to take a brokerage firm in Chicago that Dick Diamond used for years. I feel that they can mentor me a bit as I learn rather than going with one of these larger firms. To take Advantage of these quicker moves…seems to me to have a better outcome…you have to have access to futures. Also seems as though many of these gold trades start very early in the morning when Asia and Europe open and if there is an opportunity, they are ready to pounce in the ‘wee hours’ (for those of us in the USA).
NFP tomorrow should see a spike in volatility for Gold. That may be the blowoff top for minor 5, followed by a sharp reversal for the start of intermediate (2) down.
That would be my estimate of how this market may behave tomorrow.
Blowoff tops are really typical of commodities, on all time frames. Not just daily. Markets are fractal, just as EW is fractal.
Updated hourly chart. I may consider moving everything down one degree, this may only be minor 1 completing.
The fifth wave is extending, I did warn to look out for this. It’s typical of commodities.
The first second wave correction in a new trend is usually very deep for Gold. Look back at what happened after the December 2015 low. There the first in a series of second wave corrections was a 0.97 depth.
Gold starts it’s new trends slowly, so if you’re patient and have the right wave count it lets you in early. Often there will be two or three good entries. So my order didn’t fill and I’m now waiting patiently for the second wave correction.
Short term I’d look for minute iv to move lower to the 0.382 Fibonacci ratio at 1,173.
When minute iv is over then I can add to the target calculation at minute degree. At that stage the target may widen to a zone or change. I may be able to do that tomorrow.
For this chart, when intermediate (1) is complete then we will be expecting intermediate (2) down to be very deep. Probably deeper than 0.618.
Hi Lara. I think we have already been to 1185.5 on kitco for the move to 3 up. You have the target for 5 as 1183.
Okay. My data from BarCharts so far has the high at 1,180.96.
At this time I can only calculate the target at minor degree, at 1,183 minor 5 = minor 3.
But minor 3 already has a ratio to minor 1, so minor 5 may not exhibit a ratio to either.
Thanks Lara. I didn’t read the fine print where you stated you would update the target. I know this market is a magnet but hope you get some rest and catch some really good waves. I was going to kayak today, waves are nice sand calm, but mr market wouldn’t let me.
Lara. Dermot is right. Minute 3 as labelled stands at 1184.12 in BarChart. 1183 target implies truncation.
Anyway you cut it, whether Minute 5 equals 1.0 Minute 1, or 0.618 Minute 3, the target ought to be in the 1190s. If the 5th wave is an extension capitulation, then it could hit 1197 as I presumed, maybe even higher if buyers are frenzied.
Forgot to include this previously. There are indeed scenarios for Minute 5 to be sub-1190. (1) Minute 4 drops to 0.618 of Minute 3. (2) Minute 5 is wimpy; no blowoff, just a whimper. And of course the truncation.
You’re right Alan. I was reading the low not the high for that candlestick 🙁
Thanks for the chart Lara. I was wondering why SLV did not fill its gap at 15.87 with today’s strong move so may that will happen with final fifth wave up sometime tomorrow. Lots of upper BBs penetrations today so a reversal could be close at hand.
Lara. I like the statement “moving everything down by one degree”. That is the scenario I use for the bull count, the one in which price rises to 1452 (where Primary Y = Primary W). It could be even higher as sometimes the third wave extends beyond 1.0 extension.
Great Thanks to Alan, Dreamer and Verne for their specific and intelligent trading help.
If you all are there, can you comment:
1. Currently looks like we are in minute iv.
Just finished minuette (a), now minuette (b) possibly forming before a drop in (c) to
0.382…1179.43/ 0.50…1177.50/ 0.618…1176.02 (currently on Investing.com XAUUSD).
2. Do you think my interpretation is on right track and do you think we are more likely to see 0.618 or at least 0.50 since minute ii was shallow?
3. I notice that JNUG is not dropping much. I think Verne’s insights are correct that the leveraged ETFs are running a bit ahead of Gold’s thinking??
Would love comments from you all…thank you…
Melanie
I echo Melanie’s comments on big thank you’s as well!!!
I’d like to add a question if I could…..
Tomorrow morning at 8:30 am Eastern, the Employment Situation report is going to be issued; known as NFP (Non Farm Payrolls)/ Unemployment/ Average Hourly Earnings, etc…
This report is a significant market mover if expectations are not met.
How do traders manage their stop losses? If opting to purchase JNUG/ NUGT/ or GDX today and willing to hold overnight, the stop loss won’t trigger until the market opens at 9:30 Eastern? Should gold fall after the report is issued, the stop loss price will actually be the market price at 9:30 and therefore, could be significantly lower than your desired stop.
Thanks in advance for your insight!
As Melanie has commented, JNUG is extremely bullish; up 24% today.
We will be pretty much at the mercy of the NFP announcement as it comes out before the open. I could be the occasion for the minute four correction in Gold with a blow off top to follow as trend-followers enthusiastically buy the dip. I sold half my NUGT position today and will be selling the rest as soon as it makes a new high above the BBs. I think a correction is near.
Tim Knight was indeed stopped out at the open (was short the miners) but he remains convinced a turn is near and is still nibbling on DUST. I may join him if we get a bearish engulfing candle tomorrow. I noticed that SLV did not fill its 15.87 open gap which I was definitely expecting to happen today, and that is a bit of a cautionary tale imo…
Hi Stephen K.
You are right that it is difficult to manage stops in ETFs simply because they trade during market hours whereas gold trades almost 24 hours. That is for overnight purchases. As a rule, I don’t buy overnight because there are more than 14 hours of gold trade that I cannot do anything about. Worse, these hours are in my normal waking hours, so it is extremely distressing. The only time I do that is if I’m 100% sure that the tide won’t turn against me in that 14 hours.
Like Dreamer said, 3X ETFs are a two-edged sword. On a STRONG trend, they are well-behaved. But, once there are turns, they drop much much faster than the market does. A case in point is DUST. On the small rise recently, it has lost nearly half its value. These instruments are not for buy-and-hold. I don’t hold them for more than a couple of days. My cardinal rule is:
Unless the trend is strong and likely to continue strongly, never keep them overnight.
Normal stops are useless. Their price can drop in value drastically. And, one can almost never recoup such losses.
Examples of strong trends.
I traded DWTI in early November 2015 through mid February 2016 on a buy-and-hold. I did that because I went for an eye operation and I could not trade for a month or so. I calculated that the downtrend in oil was very strong. DWTI price went up 400%.
I then switched to NUGT and held until early July. Price went from 20 to 160, an 8-fold increase.
Those were VERY STRONG trends. Once gold decides to go bull (rise to 1452 or higher) or bear (down to sub-900), I am sure the same phenomenal gains will re-emerge.
On another note, I am waiting for S&P to correct strongly. TVIX and UVXY have been very strongly suppressed. In the scenario of a S&P correction, better yet, crash, the returns will be at least 10-fold, may even be 100-fold.
The moral of the story is: play 3X ETFs for the third wave. Otherwise, just scalp daily for pleasure. It’s just like a game of poker: tease with ordinary hands; go for the big kill!
Nice success stories on the 3X ETF’s. Like you said, they are dangerous. That’s dangerously good at times and dangerously bad at others….
Stephen K, you are right, it is extremely difficult to use tight stops on the 3x etf’s like NUGT or JNUG. I base all my entry/exit points based on the 1X etf’s, GDX and GDXJ.
For example, if you decide to buy GDX at 23.15 and you don’t think it will decline below 22.50, you might put your stop at 22.40. That’s about 3.24% below your purchase price. Based on that, if you chose to buy NUGT instead you would need to put your stop at 3 x 3.24% = 9.72% below your comparable NUGT purchase price. If you made a good buy point decision, then you can move the stop up over time to protect your gains.
If you don’t give the 3x etf’s a little room to run, you will constantly be stopped out for losses. The 3 x etf’s are not for the inexperienced or faint of heart.
Another strategy is to just use the 3x etf’s to trade the larger wave 3’s or wave C’s. If you time those correct, you can ride them for days to weeks and take advantage of the compounding affect. Trying to trade 3x etf’s in a choppy/sideways market is dangerous and subject to decay which will hurt your results.
Hope this helps.
I’ll be expecting the 0.382 Fibonacci ratio for minute iv because it would find support at a channel. Even though minute ii was also shallow.
Come Monday we look forward to new wave counts in this report.
All published wave counts are now invalidated.
Is gold still needs to make new low to 1118-1116 area?
OR the low has been established?
Papudi.
I didn’t elaborate enough in my response to Dreamer’s reply to your post.
There are two scenarios that I am considering, with the demarcation set at 1270-1280 region. For the bull case, a small drop will be followed by a rise to 1450 or so. For the bear case, the drop will be a sinkhole targeting just under 900.
Hence, I cannot now unequivocally answer your question about whether the current low is the LOW.
Thanks Alan.
Sounds good track for gold until proven otherwise by price.
Alan, do you see an interim correction coming – as in Lara’s most recent chart below? I can not make heads or tails of a wave count since the recent December lows. This gap up in miners has me wondering if I should just jump in or be waiting a bit. (I don’t see Lara has gone long yet herself) If not long since December lows what do you think?
Ah, oops, I just saw your Jan 5 2:02 am post regarding A target and anticipated B drop. Just really hard when I can’t see a visual. And I see NFP is due.
Hi dsprospering.
We are in Intermediate A Minor 5, currently completing Minute 3.
The end of Intermediate A should be near to 1200 as Papudi intimidated. I have it at 1197.55.
I reckon Intermediate B should correct down to the 0.618 level. It would be 1151-1152, the value of course depending on where Intermediate A ends. That is my intermediate low. Following that, Intermediate C would be a strong wave to complete the Primary 2 bounce. I reckon it is at 1.618 extension, bring price to 1272-1278. Do note that Pr 2 = 0.618 Pr 1 at 1278.65.
Hope this helps.
PS. Oops, just saw your response. Anyway, this sums it up so I will leave it.
Papudi, I did post a chart below in comments with an update.
Bearish RSI, MACD, and STOC divergence favors a larger correction in the $USD. Bullish for Gold and Miners.
GDX is at key resistance. Mixed technical signals (low volume) had me expecting a deeper pullback, but it looks like GDX is going to be stronger than expected short term and will gap over the resistance.
The inverted H&S targets around 26.
The ongoing skepticism regarding this break-out is telling. Even the comments from some of our members who seem to doubt the reality of what is unfolding is quite revealing. Don’t get me wrong folk; I actually shorted Gold yesterday, then thankfully canceled my order after I saw how it was staunchly resisting attempts to drive it down. Tim Knight of Trading the Close took the plunge on the short side but I am betting he will be covering promptly at the open tomorrow. The projected price targets folk are citing really need to be considered from the perspective of the depth of pessimism at the recent lows – it was absolutely historic, exceeding the pessimism when Gold was trading for 250.00 an ounce. I think we should expect an extension of this possible minor fifth wave up.
Yep. It’s almost at the target, and it’s not complete.
Hi Verne , Dermot ,
The USD has reached its (v) and reversed down . A very short (v) . I expect the USD’s reversal to be multi- weeks . http://stockcharts.com/h-sc/ui?s=%24GOLD&p=D&yr=1&mn=0&dy=0&id=p72717379657
The smart Commercials maybe behind it . If that is the case , I think they will not bash GOLD Down for a while .
GOLD Daily has done 5 waves Up and should pullback soon for a Buy any time .
SP500 is on its way Up from (iv) to (v) and it will likely be a short subwave Up .
The US Bond price and GOLD synced at their recent reversal : http://stockcharts.com/h-sc/ui?s=SHY&p=D&yr=1&mn=0&dy=0&id=p83544637120
I think Lara has nailed the Bottom proper for GOLD .
I have still not heard of anyone who made the call as precisely .
Best of luck to you all ,
and thanks , Dreamer for your GDX charts .
Regards ,
Raymond .
Note the time of this post.
Gold/Silver have broken out of bullish inverse HnS pattern.
For silver near target is > 17.23 and Gold above 1200.
Many PM leading indicators have been flashing reversal and have broken out of consolidation.
Good trading!!!
Yep, 1,200 on gold is looking possible before a bigger correction.
That is what I think too. My Intermediate A target is 1197.55, the 1.382 Fib extension for Minor 5, instead of Lara’s 1183 at 1.0 Fib.
Forward looking, I am eyeing a 0.618 drop in Intermediate B followed by a strong 1.618 rise in Intermediate C to 1272 – 1278 (where Pr 2 = 0.618 Pr 1).
In my scenarios for future price movements, Intermediate C is the critical juncture. There will be a price drop from there. How far this drop goes demarcates the bull/bear divide.
For the bear case, it would be a cataclysmic drop in wave 3. For the bull case, a shallow one followed by a rocket lift.
GDX is at resistance. I see two options:
1) The correction is not over and GDX moves down tomorrow toward my target of <20. For this to happen, gold may need to be forming an ending contracting diagonal and will start correcting overnight
2) GDX gaps over resistance tomorrow as Gold continues up
An awful lot of Elliotticians are insisting that metals have another leg down to new lows and I am frankly not so sure they are right. We have clearly moved out of the down-trend channel and making a series of higher highs and higher lows, which defines an up-trend. Silver has blasted past what I thought would be stiff resistance at 16.50 and what was for me a long-standing buy point. While we may be getting close to a second wave pull-back, it seems to be that price has firmly established that we have had a change of trend from down to up. The failure of SLV to fill this morning’s gap open is bullish, and I expect the 15.87 gap from December 14 to be promptly and decisively filled tomorrow. If that happens I will be back to long 1/2 full position as soon as it does. Can’t say I regret being disciplined and selling this morning as SLV closed exactly at the price I sold by 15.00 calls at 15.58 and I got a better price than was offered at the close. Gotta be nimble! 🙂
I think the bottom is in…. I was just looking for a deeper pullback, but it appears that GDX is going to gap over resistance since gold continues higher tonight. Shallow pullbacks are another sign that the bottom is in.
The metals and miners are hanging tough. Canceled my GLD put order. I think it best not to short these guys ATM. Back to the sidelines!
Gaps from this morning open already filled by leveraged ETFs. SLV and GLD are probably both next. Buying a few GLD puts. 110.50 strike expiring next week selling for 0.89 per contract.
Looks like a move down is starting. The 15.45 open gap from SLV close yesterday should remain open. If we fill it before the close I will be opening a small position in a bearish 15.00/15.50 call spread expiring next week; risk of 50 per contract if SLV closes above 15.50 at expiration.
Sold a 6.50 NUGT call expiring this week for a small loss, which was off-set by closing a few bullish naked 5.00 strike JNUGT puts for a small gain. I am now entirely on the sidelines wrt the metals and miners.
Sound and fury….prices steady to a tick higher, futures prices ticking upward a bit. Obviously not even close on those “stick bids”.
Back to watching from the sidelines for now…
As we have seen on so many occasions, these “announcement” or “event” triggered moves very rarely have any lasting impact on market direction. One trick I like to use is to open “stink bids” on a position I want to enter ahead of these moves and get filled at a ridiculously low price. I am offering 0.40 for SLV 15.00 strike calls expiring next week. Current bid is around 0.66. Let’s see what happens! This is small and speculative of course. I can always add to it later if I get filled. 🙂
JNUG and NUGT turning down once again…. *Sigh*
Dojis on deck in both SLV and GLD!
You spoke too soon.
FED minutes out in about 25 minutes. The upward movement is choppy and over-lapping so it is really tough to go full bore on a long position. If any pullback on the FED release stays above 16.00 for Silver I think I’ll nibble.
Where is everybody today? Things are eerily quiet!
Quite confusing action. We have the Feds minutes being released which usually pushes the market around a bit. We have obamas legacy in the balance, imagine him saying the Dow got to 20k during his watch, the fed would only have to hint of loosening for this to happen and they are all democrats. Then there is the final up of Lara’s last wave count to 1180 or so. Do we go down hard first? Do we go up and the do an abc correction? If the fed hints of 2 cuts or any language that would scorch the Spx shorts it could push gold up as well. Then there is the thought the commercials could always push this gold market down one more time and break out on the downside of the descending wedge before we get a whipsaw up. So…..I dont know anything.
I hear ya and completely agree. The other peculiar thing is how the markets and the metals have been moving together which is quite unusual. Somebody has a fake-out up their sleeve….
SLV seems to be striving to fill open gap from Dec 14 at 15.87.
If this one is filled in the next day or two, there is an good chance that the other close one at 16.31 from November 11 will also be filled.
SLV encountering some resistance in the area of 16.50.
Whether or not it breaks through will I think say quite a bit about near term prospects for a continued march higher. Keeping powder dry for now…
The leveraged ETFs are reversing from this morning’s lows. That is bullish.
Sold remaining 1/4 position of SLV calls. Got filled a penny better than last sale. I have noticed that whenever the leveraged instruments (JNUG, NUGT) start heading South the metals tend to follow shortly thereafter. It is looking to me that we either get a chance to join the new uptrend here, or we learn that this was nothing more than another corrective move ahead of a leg lower. It is also true that sometimes these up-trends see deep intra-day pull backs only to continue the march higher by the close. I think the leveraged ETSs will again give a clue which way price is headed.
Hi Verne – I enjoyed following your trading so thanks for your posts.
Today, the FED releases the FOMC minutes which point to 3 rate increases in 2017. This news should cause gold to drop and suspect it bounces once the dip gets purchased.
Nice move to grab your profits per your “broken market” post. Agreed!
Hi Stephen. I had forgotten about the FED minutes today and I think you are right that it will cause a temporary move in the metals. I have to say I seriously doubt anyone is taking their three rate hike threats very seriously. I would not be at all surprised to see a rate cut before we see another hike. Call me crazy. 😀
Sold 3/4 of my long SLV position for a modest profit. Looking for a near term pull-back to test 15.90-16.00 Silver spot price for a re-load, or a break above 16.50 whichever comes first.
One hard lesson I have learned about this broken market is never leave profits, even small ones, unclaimed. Unbelievable whipsaws have been the norm, even when trading with the trend as bot traders now account for most of market volume. The markets are a dangerous place to remain exposed for any length of time. I plan on exiting most of my long slv position at the open although Gold probably has another 15 points of upside before a second wave correction. It should present a very good entry point imo.
Follow up on inverse HnS on PM metals.
Silver broke NL in 4 hour period HnS yesterday at 16.23 and now to day Gold just broke inverse HnS NL at 1164.23 and trading higher. Both HnS have been confirmed.
PM has put in the bottom and waiting for Lara to switch the main counts next week.
GDX looks like the correction is not over and it needs one more leg lower. That said, if gold moves higher as Lara expects, I may be wrong and this could just be a 4th wave correction for GDX and a new high may come first before a bigger correction.
Volume was low today, not supporting the move up.
I don’t believe it! I set an order yesterday before markets opened to open long at 1,146. I expected price to come down and touch the channel then bounce up. It did. But only reached 1,146.17.
Oh well, I’ll let this one go. There’ll be another opportunity.
Minor 3 has a Fibonacci ratio to minor 1, so we may not see minor 5 exhibit a Fibonacci ratio. This makes target calculation unreliable. So this target may not be met.
Minor 5 should be expected to be an extension, this is most common for commodities so look out for it. At 1,183 it would reach equality with minor 3.
When there is more structure within minor 5, specifically when minute i through to iv are complete then a better target may be calculated at minute degree. So this target will probably change.
I’ve redrawn the channel to be a better fit, minor 4 overshot it.
I’ve noticed over the years that many set their buy and sell limit orders on round numbers. I always set my buy orders on an odd number slightly above my target and my sell orders on an odd number slightly below my sell target. I don’t have any quantitative analysis on this, but I think it has helped my probability of order execution over time.
That sounds like a really good approach Dreamer.
Silver just broke out of 4 hour period inverse HnS. NL at 16.28.
Silver to gold ratio will lead the PM sector to uptrend soon.
Finally silver needs to cross 17.23
I think the break-out upwards in Silver is the real deal. I am taking profits on my current position and moving into the SLV ETF with a good sized position. The banksters tried to smash it down over-night but the bulls were not having anything of the sort. The alternate count called for a third down at multiple degrees and I think it is safe to say that that ain’t happening. Hi Ho Silver!
??
Just wondering: Why long Gold when the Macd line has crossed below the signal line on the monthly. Keeping it short on any bounce towards 1150’s with upside risk 1160’s/1170’s…. Lets see how this plays out.
I hope your stops are tight! 🙂
Rambus public post on gold. A break below the 1,100 range would be very bearish
https://rambus1.com/2017/01/02/weekend-report-part-2-6/
Methinks Minor 4 has decided to become a combination. My first target for it to end is in the 1144 – 1145 region.
Starting to look like SPX doing the same thing in the opposite direction.
Lara,
why there is no update since dec 23 2016???
Irwan
Because I take a 2 week holiday once a year. I emailed the membership in December with dates.
I need to take a holiday to be able to keep doing this year on year. The best time to take a holiday is Christmas / New Year when NY is closed for at least 2 days and markets are usually quiet.
Give the lady a break. You have your annual leave when you are employed. She deserves much more. She has been working very hard day in and day out, even on weekends when the markets are closed. Barring any extenuating circumstances, her Friday reports had always been out before markets reopen the next week. How many people do you know of who put in a full day’s work over the weekends?
In any case, some of us magnanimously try to cover for her, although we do not have the acumen nor the resources to put in a detailed report. We do it for the camaraderie. We do it in all sincerity: we trade what we preach, we have put our money where our mouth is.
Calm your jets, man. He only asked a question. Sheesh.
Don’t be too hard on Alan. Some of us are very protective of Lara and do get a bit warm if we think anybody is giving her grief. You are right though in saying the gentleman apparently simply did not know about Lara’s annual break. Carry on! 🙂
Forgive me if I misconstrue the writer’s intentions. To me, the use of multiple question marks or exclamation marks borders on rudeness. As a question, it implies aggressiveness. It demands a response and the response had better be to the writer’s liking. Likewise, the use of multiple exclamation marks tantamounts to shouting at the intended recipient of the missive, even screaming. I deem this to be on the same level as using all caps in a sentence.
However, if this is the modern style of communications, then it is a learning experience for me. Schooled in the etiquette of yore, I get very worked up whenever I encounter such an occurrence.
I do agree with you here Alan.
I do though bear some responsibility for any new members being confused or annoyed about the lack of updates these two weeks.
It is in the FAQ and the welcome email to each new member, but I don’t think many people read those.
It should have been clearer right at the top of the website.
It’s all okay folks.
And Alan may have replied due to misconstruing the intent of the question, and because he knows my comments policy is very strict.
To be fair I think I have managed the notification of the annual holiday poorly this year. If anyone signed up after I sent the global email to the membership they would justifiably be wondering what on earth is happening here.
I should have had a notice at the top of every page of the site with a short message and dates. Will do that next year.
So to Irwan, if this is the source of your confusion I apologise. Email me and we can sort something out for you this month.
To anyone else wondering about the holiday, I didn’t take one at all for six years. Last year it became apparent that if I didn’t start to take one I would have to close down the sites. And I’m pretty sure we don’t want that.
John, if I never took a holiday I would burn out and this website would close. It’s a simple as that.
Lara, I finally found another EW analyst that calls out EWI for violating their own rules for an ending contracting diagonal. Check out the video starting around the 13 min mark.
He also has some “different” views on how to label the 4 year move down and how to label the 2016 current move down.
https://youtu.be/TYYOwtgnCZQ?t=13m15s
Thanks for the link Dreamer. It’s nice to note others are noticing the rule violation by EWI.
I see the alternate idea he has there for an ending diagonal. I don’t think it looks very good, I think wave 1 is far too long. But it’s viable.
They have published some of the sloppiest EW counts I have ever seen to be quite frank. In some instances, remarkably, they don’t even attempt to label the chart!
The last few years of my subscription (now terminated) Steve would absolutely refuse to actually state what he thought the actual count was and would essentially end up saying the market is either going to go up, or it’s going to go down. Try trading on that kind of analysis. For may years he and Prechter would give these dogmatic pronouncements and not even offer an alternate count, despite being hopelessly and consistently wrong about what the market was doing. It seems to me there has to be a reasonable middle ground but it still eludes EWI. I ended a long term subscription last year.
In the mean time here is Trader Joe EW analysis which is similar to Lara’s count except the gold’s Grand Cycle wave count.
Wave Analysis included for SPX,USD,US Oil and Gold..
https://www.youtube.com/watch?v=TYYOwtgnCZQ
Hi lara, when will you post the analysis in 2017?
Regular schedule should resume after the close on Monday, January 9
do you mean we will see Lara’s update after jan 9?
irwan
Exactly. Until then I am trading Gold so will be publishing charts here in comments.
GDX hourly update
Alternate daily chart updated.
A new bull trend may have just begun.
The first target would be for primary Y to = primary W.
The second target would be for primary 3 to = 1.618 X primary 1.
No second wave correction may move beyond the start of the first wave below 1,123.08.
Updated hourly chart:
For now both the main and alternate need to see a five up complete, so both would have the same labelling at the hourly chart level.
It looks like a fourth wave may be either complete or very nearly compete. If it moves lower it should find support at the lower edge of the best fit gold channel.
Minor 3 is just 1.24 short of 4.236 X minor 1.
Minor 5 may be a strong extension, typical of commodities. It does not have to be like this, but be alert for this possibility. If it behaves like this it may offer an excellent trading opportunity.
I will be entering long when markets open, placing my stop a little below the lower edge of the channel on this hourly chart, that’s about 1,142.
If minor 5 is equal in length with minor 3 then a target would be around 1,180 – 1,185.
Hi Lara, hope you are enjoying your vacation. What time frame would your first target of 1452 be reached in. Thanks
About three or five months. If it exhibits a Fibonacci duration.
Happy New Year every body. May 2017 bring us all good profits 🙂
There was no final low, price has broken out of the channel upwards. Updated main daily chart here.
This upwards movement is now expected to be either a deep correction (main count, this one) or a new bull trend (alternate).
If it’s a deep correction then the 0.618 Fibonacci ratio at 1,272 is a reasonable expectation. That may take a few weeks, in a big overlapping three wave movement. The first piece up should be a five for a movement at primary degree, so the invalidation point for this main wave count for now may remain at 1,123.08.
Thanks for the updates Lara!
Thanks Lara! We have a clear price point that tells us a trade on the long side is wrong. I am lowering my stop on my long silver trade to 15.50
HAPPY NEW YEAR – Auld Lang Syne by Sissel
https://www.youtube.com/watch?v=Rtajxo8d7js
Enjoy!!!
Happy New Year to everyone, specially Lara & her team! Following Alan Tham comments closely…. IMO expecting Gold price to break below 1149 to be curtailed 1147-46 for a bounce back up to meet resistance and possible topping 1155-1162 (50%-61.8% of H 1187 / L 1123) to drop back and test a break below 1133…. Keeping it short, lets see how this plays out. GL all.
Looking at the big picture, GDX still has to prove itself. A move back over 23 in the coming weeks would significantly increase the probability of hitting one or both bull targets shown
Back to business…
We know that Daneric has labeled the big move down slightly incorrectly, but what I want to bring to your attention is that he now thinks Gold may have bottomed and is on its way up towards 1,500 where he always highlights the middle of the 3rd wave down as the target.
Move to 1500 from current low 1124 will equal to the move from low of 1245 to 1377 wave W.
Approximately 31.7% to 33%.
Wish you and all members of this forum a Happy New year 2017.
2017
Thank you so much Dreamer!
Wishing you all the best!
All dreams to come true!
BEEEAUUUUTiful !!
Hope you don’t mind, I snagged a copy.
This is the best fireworks scene EVER!
Thanks Dreamer, best wishes for the New Year.
Awesome resolution! A really amazing pix!
The bearish engulfing candle today a bit of a cautionary not imo. I have tightened my stop on Silver to 15.75 Depending on price action next week I may lower it to 15.50 but we go possibly see one more downside move prior to a final low.
Best wishes for a happy and prosperous New Year everyone!
Hi ,
Look at Lara’s GOLD Hourly count in this thread . It is valid if you just shift the 4 higher and to the right , You can’t miss it , it’s where GOLD starts to fall today . The 5 is the last drop for GOLD , then reversal Up .
Lara’s GOLD 4 tallies with the (iv) in the USD and USDJPY Hourly but their (v) is Upwards , last rally before reversal Down . USD and USDJPY both move in opposite direction to GOLD .
Some of you trade EURUSD . Its (iv) is a Spike Up . So it should also fall to its (v) .
The SP500 may complete its (iv) tonite . Its (v) will be a rally before a deeper correction . The SP500 is correlated with the NIKKEI . When NIKK falls, YEN ( inversed USDJPY ) strengthens and YEN / GOLD moves together in the same direction . YEN is the traditional safe haven and carry trade currency .
GOLD and GDX Daily chart : they have bounced in 3 waves from their bottoms . That can be an abc or a 123 …. . The c in GOLD is Lara’s 4, Hourly chart mentioned above , to be shifted .
What drove GOLD’s strong rally the last few sessions ? Here is my guess .
The US Bond Yield Pullback :
http://stockcharts.com/h-sc/ui?s=%24UST2Y&p=D&yr=0&mn=6&dy=0&id=p87827373000
The US 2 year Bond yield in red/black
Here is the US 30 year Bond Yield :
http://stockcharts.com/h-sc/ui?s=%24UST30Y&p=D&yr=0&mn=6&dy=0&id=p79349063172
This is just my opinion , observing inter markets and they tally with Lara’s last GOLD Hourly count , expecting a last drop ( for GOLD ) , ….. or rally, depending on the assets mentioned above .
Happy New Year to all of you .
Regards ,
Raymond .
Interesting. Some analysts are seeing the Euro just completing a C up of a minor two, ABC correction ahead of a sharp minor three to the downside. Looking at the decline out of the triangle Dec 8 which would be labelled minor one down, this implies the next move down should take the Euro to parity and below if it is indeed a minor three.
A close back above spot price of 16 by the close would to my mind be exceedingly bullish. The bearish engulfing candle today could presage a deeper near term decline though.
I’ve been unable to participate with comments lately but have been perusing them and watching gold’s moves. Am anticipating the Sharia law change will be adding to this correction upward and looking forward to it. Looking at an oil entry also since I think we passed the ‘daily candle not touching trendline’ test.
I’m hoping Christmas this year was pleasant for all here, and I sincerely want to wish everybody a Happy New Year! (Lara, vacation time, what’s that? I’m jealous 🙂 ! )
To Ursula – persevere on girl, your message gave me a wake up call. You’re on the other side of trouble now. Also, enjoyed the Harry Dent post.
To Tham – its good to see you posting your wonderfulness again. Hope we keep seeing you regularly.
Papudi, Dreamer, Verne, Raymond keep up the good work.
Love to all,
d is prospering
Thanks dsprospering. It’s nice to see you around.
Happy New Year.
Where is the bottom in gold? I’m looking to long, but the price keeps dropping today.
Thanks to all, and HAPPY NEW YEAR!
I like vernes trade on silver at 15.75. If you have a long term view it may work very well. It is possible we come out of the gates running and silver opens at 16.50 on tues. It is important to own ones trades. You put the odds in your favor and then let it roll. Like Lara keeps telling us though don’t put all your eggs in one basket. Best of luck and happy new year all.
Spoke too soon it would seem. Price in the metals and miners undergoing a deeper pullback. I think we are being given a great opportunity to join a new trend. 🙂
I agree Verne. And if my wave count is right (at least short term) then this pullback has come after some trend channel confirmation of a change.
Reloaded second half of long Silver position as price briefly slipped below 16.00.
It would appear a few orders were triggered as price reversed quite swiftly. I was expecting to be under water for a day or two as price headed a bit lower to the 15.75 area.
I agree. The commercials have probably gotten rid of quite a bit of their short positions in preparation for at least a bounce at the beginning of the year. Those who got in late have sold there longs for a tax write off. Since we are in a bullish descending wedge, a move above 16.50 or so should give a nice pop. Perhaps we stall there for a bit but when it breaks it may be a sizable move up.
Great chart that wedge Dermot. I do think we are going to see price fall toward the bottom trend-line prior to a break above the upper one. If I get stopped out at 15.75 I will wait for the break and following re-test of the top line to re-enter long. I think the 16.50 price range looks just about right and was the price point at which I had originally planned to add to my long position. Sometimes the great pop you can get from catching these turns is worth the risk of not getting the exact bottom. IF we are not there, we are probably quite close.
Watching Silver price action with great interest. I am waiting for price to hit 16.00 but it seems to be hovering just above. I still think we are going to spike below it and then reverse so I imagine when I get filled I will be under water for a bit but that is acceptable as I think we have had a trend change.
Since Nov 9 gold has been in a water fall decline.
If gold closes above 1200 then the down trend is broken and gold should move higher resurrecting Lara’s bullish wave count again.
All PM sector ratio indicators have been flashing gold’s turn is coming.
These ratios are Silver to gold, XAU to gold and XGD to gold on daily, weekly and monthly basis.
The move up in GDX today was stronger than expected. It does, however look like a 5th wave up may be complete or very close. This will complete a “5” up, then a “3” wave correction is due. Be aware, if a true Intermediate bottom is in for GDX, that corrections may be shallow like they were back in Jan/Feb.
There’s a possibility that an Intermediate low is in for GDX at the 18.59 low, although GDX must still break through overhead resistance to prove itself.
I’m having a hard time reconciling GDX with Gold at the moment as it doesn’t look like the first leg up in gold is impulsive. Need to see what Lara comes up with for Gold.
GDX had a big up day today on a significant increase in volume, although volume was not higher than several down days over the last few months. This is the strongest rally for GDX since the top in August. The move up today looks like a strong 5th wave.
A correction is likely due in the next couple of days. The picture is looking brighter for the bulls, although there is still significant resistance overhead that GDX must break to prove that a bottom is in.
Note that OBV broke above resistance that has held for the last couple of months.
Hi ,
In case the link below is messed up :
https://www.barchart.com/futures/quotes/GCG17/technical-chart#/technical-chart?plot=CANDLE&volume=0&data=DO&density=X&pricesOn=1&asPctChange=0&logscale=0&indicators=MACD(12,26,9);RSI(14,100);STOSL(14,3)&sym=GCG17&grid=1&height=500&studyheight=100
Regards ,
Raymond .
Hi ,
https://www.barchart.com/futures/quotes/GCG17/technical-chart#/technical-chart?plot=CANDLE&volume=0&data=DO&density=X&pricesOn=1&asPctChange=0&logscale=0&indicators=RSI(14,100);STOSL(14,3);MACD(12,26,9)&sym=GCG17&grid=1&height=500&studyheight=100&timeframe=4%20Days
This is GOLD Futures from Barchart .
The 78.60 % Fibonacci retracement is at 1117 . That’s very near where GOLD has hit . IF we can count 5 waves Up from its Bottom on this chart , I will seriously consider looking for a GOLD ‘s Bottom . That will be next week .
Note that GDX does not have to bottom with GOLD at the same time . Check if it breaks out of its overhead trend line in the Daily chart . Above 22.50 / 23 may do it , from just a casual look .
I will still respect the USD and USDJPY counts . But if GOLD has strong Buying pressure , it can do whatever it wants .
On Lara’s GOLD Hourly chart posted below , at the spike where she has tagged a 4 , I have my count where the spike maybe a (iii) . So the new High just made a few hours ago maybe a (v) , 4 . Don’t invalidate her count prematurely .
The last tag in a live count is always subject to change , especially Hourly chart count .
Regards ,
Raymond .
This is a summary of the path forward from here following my recent play for resuscitating the 1st count.
The low was already there at 1123.08. And that is Primary 1. Primary 2 ought to be a deep wave. I’ll use 0.618 Fib as the target. This will yield 1278.65.
Once the price rise in this current Minute 3 wave ends, Minute 4 will follow. My strategy is to use the low in Minute 4 as the entry point for the ride up to 1278.65.
Yep! I am looking at the 15 minute chart of Silver and I think this corrective wave is going to stay above 16, the approximate area of the end of the fourth wave triangle, and not the 15.50 area I had originally expected. I am opening a buy-stop at 16.00 even.
Thank you for helping us new members out Alan, while Lara is on vacation. Your efforts are much appreciated. Please post your price points for minute waves 3 & 4, when you see them in your charting. I too am looking to go long on gold. Thanks
I guess it will be a little lower than 1151.95$
Hi Allen,
Do you have a target for Minute 4 ?
Happy New Year
Hi Robert.
The drop should be ending soon, most likely when markets close today, or very early on in the new year.
My target for Minute 4 is the 0.382 Fib at 1149.58.
Minute 3 ended at the new high of 1162.98.
The time consuming Minute 4 is underway and is nearing completion. My target is the 0.382 Fib at 1149.48.
Happy New Year, everyone.
Over 1152, see if silver follows, Jnug up 50 percent and more over last few weeks.
Wishing all the members a very happy, healthy and profitable 2017. Last 2 years has been simply awesome since I joined this site. Hope this continues 🙂 X became 1.9X this year. Was up 2.4 X at a time. Did not play the fall from high as I would have liked. But will take 90% increment. 64 trades this year with 51 trade as success.
Thanks everyone for all your input.
Sold half my long position in Silver ( 20% gain) as we hit 16.00 price target. Will look for re-entry on any break below 15.5. Will reload on any close above 16.50.
I cannot help but be intensely curious at the universal expectation of market participants and observers that DJI 20K is a foregone conclusion. It does make one wonder, does it not? 🙂
Especially those thinking it will happen early next year. I’m guessing we have a some selling for locking in gains. I think there are a lot of people who made some money here and don’t want to pay taxes on it, so they will wait till next year. Opposite with gold, lots selling for tax purposes.
Hi ,
Check the SILVER Hourly chart . The 3 to 4 forms an abcde Triangle , elusive in GOLD .
The a to e ,4 line at the pattern top forms a nice tapering Wedge with the lower b to d line . So the next move is Down towards 5 , confirmed when the b-d line breaks downside .
Regards ,
Raymond .
I looks to me like Silver is tracing out an impulse up and is now completing a fourth wave triangle. I will be looking for a three wave correction for an re-entry on the long side.
Ursula , Lara and fellow members ,
Ursula , you have gone thru’ a lot , get well soon , brave girl .
Reading your piece has encouraged me to sit up for a few hours and look at some charts . Here are my readings :
A) The USD Hourly is completing its e , (iv) and will rally ( GOLD falls ) to its (v) , 5, (3) . From there it will Pullback multi- weeks to (4) , the first target is 99 ( GOLD rallies ). The e means it has completed its abcde from its (iii) . So I expect GOLD to fall first as its next move .
B) The same with USDJPY Hourly , also about to complete its (iv) . Its next move is to rally to (v) , its TOP at say 120 , which means that GOLD is about to fall to Lara’s 1115 Target , near the the Fibonacci 78.60 % retrace . After that , the USDJPY will reverse from its (v) , Top multi- weeks and we will see GOLD rally .
C) Last nite drop in the SP500 may have completed its (iv) . So I expect we will see a Rally next , for the New Year and January effect to its (v) , 3 ( GOLD will fall thru NIKKEI ‘s rally and YEN falling, likewise GOLD ) . When its (v), 3 completes , the SP500 will pullback say 80 points multi- weeks / months to its 4 . That will support GOLD , thru NIKKEI’s fall / YEN strengthens / GOLD too . We will see the YEN’s carry trade unwinding . How else can the weak YEN ever get stronger than the USD ? YEN here is JPYUSD .
In short , my reading at the inter- markets agrees with the charts posted here by Ursula , Dreamer and Lara , calling for a drop in GOLD right ahead . There is one point about Lara’s Hourly posted here . The 4 at the spike says GOLD has one more fall to 5 left to do before Reversal . I have the same Four or ( iv) that says the USD , USDJPY and SP500 also have one more rally to do to Five or (v) before Reversal , all at the Hourly chart .
As for how high can GOLD rally , after the coming drop ,
(a) to 1270 and then crash sub- 1000 , or
(b) to above 1375 and resumes its rally from 1045 ,
I don’t think anyone knows for sure . The Elliotticians like Lara , EW International and Avi Gilbert can’t even agree how to count the 1045 /1375 rally . EWI and Gilbert have counted that rally impulsively , but Gilbert even considers the rally from 1045 a new Bull run , not Lara or EWI . I only know that Lara has counted rigorously with internal checks , not sure of the other two and many others . I will do my own checks with other inter- markets when the time comes .
Lastly , here is the last COT USD : https://www.wellenreiter-invest.de/cot-daten/us-dollar-index
The blue Commercials are very short USD , right at the bottom in the negative segment ( the 0 is on the left scale ) . They will have to Buy USD to cover their short but I can’t read when, ( not many can except Briese , etc ) . The blue can hunt around the ” bottom ” week after week , for them to find the right moment . When they are ready , they will trigger the price ( gray ) to fall before they Buy . They only Buy in a falling market , hence ” smart money ” . The red Hedge Funds will follow the price Down , ie the red falls ( selling their longs to the blue ) . Like all of us , the red are price followers . So like in DEC 15 in this chart , I expect to see the blue rising , gray falling , red falling , ie despite all the fundamentals supporting a strong USD , weak EURO and weak YEN , I expect a reversal soon . As for the Timing , I will have to rely on Technical analysis and EW . I can’t read the Commercial’s trigger point from the COT report , until after the fact .
In the GOLD futures market , be aware that the Commercials are not just the metal producers , jewelers and other GOLD merchants . It is widely believed that the Bullion Banks ( like JPMorgan, HSBC , Barclays , Nova Scotia , etc ) are classified inside the Commercials . They can raid the GOLD and SILVER prices down brutally , and sometimes ” not for profit ” but for the Central Banks . For the ” not for profit” part , read the Conspiracy theory going around .
Happy New year everyone .
All the best to your trading 2017 .
Raymond .
Price has now risen above the previous high of 1148.61. The inference is that my (1) scenario is invalidated. We are in (2).
The implication is that, as described in (2.1), Minor 4 is now a combination. If price exceeds 1151.95, then (2.2) is called into play — we revert to the 1st count. I hate this one. It would make me wait for a much longer time before I can reap the profits from going long.
Let’s wait for more clarification.
For the 2nd Count, it is obvious by now that Minor 4 is a combination: 1123.08 – 1148.61 – 1136.22 – ? It is currently in minuette 4 of Minute 4. I reckon the drop should stop at 1144.84 (where minuette 4 = 0.382 X minuette 3). Now, unless minuette 5 is very short, it should breach 1151.95, thereby invalidating the 2nd Count.
The only saving grace is that 1151.95 has been tested 3 times and it held. Maybe it can be fourth time lucky.
In the event that 1151.95 is breached, I will revive the 1st Count. I have the breached value (>1151.95) as the ending of Minute 3 of Minor 3 of Intermediate A. The implication is that following a drop to Minute 4 in which I will go long (my entry point), my final target will be in the vicinity of 1278 (in which Primary 2 = 0.618 X Primary 1). Niagara Falls will ensue, taking price to the 800s, an ideal shorting event.
Most unfortunately, I’m right.
The 1st count is now in play. The low is already in at 1123.08.
Thx everyone for sharing your thoughts. Personally I’d sell my house and all in gold if it ever drops below $700. ?
Just sharing a chart form an experienced NON EW trader.
Link: https://www.tradingview.com/chart/XAUUSD/47jiyjZe-Gold-Major-Resistance-at-1150/
I wish you all all the very best for 2017: health, love, happiness and success.
Health is more important than many think,… I went trough a lot this year, be grateful if you are healthy and treasure it. I have a good prognosis and 98% survival rate, and I am still in treatment, but I tell you breast cancer can hit EVERYBODY (men and women, even with the healthiest lifestyle). So, PLEASE take care and look after yourself.
Love and kindness to you all
Ursula
Longer term forecast from Harry S. Dent Jr
http://www.dentresearch.com/
I like Harry Dent’s work and think he is a very capable researcher, especially when it comes to demographics. He has sadly been quite wrong in his market calls for the last five years, having first called for a top in 2012, then again in 2014 when he identified what he thought was a megaphone DJI pattern suggesting a top around 17,000.00 He recently sent out a letter to his subscribers acknowledging this to be the case and I really do admire his honesty. Like so many other market participants, Harry has come to realise that we are dealing with markets that are completely broken due to constant central bank intervention and price manipulation. He stated something in that letter that I concluded a few years ago, namely, formerly fairly reliable price discovery metrics no longer work the way they used to in the current market. That is exactly what he stated about several of his indicators. What makes this market such a dangerous place to be right now is that broken metrics work both ways. Once true price discovery becomes next to impossible due to constant central bank intervention, the fact is that no indicator can really be fully trusted. Trade safe! Be sure to hedge!
All the best to you for excellent health in the new year!
Ursula, best wishes for your good health in 2017 and beyond!
Ursula. I am very sorry to hear about the trauma you had gone through. But I am glad that your chances of a good recovery are high. Personally, I would like to wish you the best of health and a speedy recovery. My prayers will be for you. Take care.
Ursula, much love and hugs to you 🙂 I know of two women who have survived breast cancer, and 98% are pretty darn good odds.
So glad you’re still with us
Thank you all very much for your warm & best wishes.
Kindly
Ursula
My EW count also supports a pullback. The target may be about 19.25
Yep! I think this is exactly what is happening. If it is an excellent entry point should be just ahead.
GDX met it’s iH&S target today and may be ready for a pullback. A successful test of the neckline may be a buying opportunity.
GDX had another good up day, albeit on low volume. Price is attempting to breakout of the bullish falling wedge.
OBV is at resistance. We’ll need to watch OBV closely for a breakout or pullback here.
Nice to see rising volume with rising price there
I also wanted to thank Lara and Cesar for the wonderful Tui bird recording. A very thoughtful gift. These birds are very calming and peace giving to listen to during a work day.
Thank you!
That’s lovely, thank you.
I use it as an alarm if I need one. It’s much nicer waking up to birds than an electronic sound.
Hello ALL,
Warm Wishes to everyone and some relax time during the Holidays!
Meanwhile, some of you may want to take a look at this. I am curious as to what Alan and Dreamer think of the Below post from an Elliot Wave perspective. Jordan of the daily gold sees a very similar target somewhere by Spring 2017. Jordan has mentioned the 1089 – 1050 level for a possible bounce, but sees good probability of lower prices into the 900s eventually. I wrote him about posts/counts I was seeing going to 600-800. He responded that he saw very Little probability of that large a decline.
https://goldtadise.com/wp-content/uploads/2016/12/Goldman-Sachs-Charts-That-Matter-in-Q1-2017-Gold-12-18-.png
Here is a brief quote from Jordan in his Dec 26 Letter: “The miners formed weekly hammers (bullish reversals) last week and
odds favor higher prices into early January. We noted the possibility
of a weak rally and then a drop to $1085-$1095. Its also possible the
weak rally is the medium term (2-months) rally and it started last
week.”
Jordan does see lower prices after this bounce into the 1st half of 2017.
If you notice ‘BooBooMan’ does not see gold above 1205 on a ‘bounce’. Jordan of TDG is targeting about 20.50 on the GDX and 30 on GDXJ before another decline.
Hi Melanie. Technically, the count is probably OK after a few adjustments. The ending diagonal at the end of a major 3rd wave instead of a major 5th wave seems a little out of place. The move down from the top labeled IV seems to ignore a triangle.
Gold should have a good bounce soon. We’ll have to see how that goes. Overall you could probably make this count work, but there are likely better options. Lara would have this as one of her counts if she thought it was high enough in probability.
Hi Melanie. I’m sorry not to have replied earlier. I was taking time off from trading gold as I was awaiting clarity regarding whether we are still in Lara’s 2nd count or do we revert to the 1st. I had set my upper bound at 1151.95 and the lower bound at 1123.08. (You may see my full discussion somewhere below). Anywhere in between is only good for a quick trade but only if you are very nimble. The concentration level is intense and since this is the holiday season, I’ll just let it slide.
Coming back to your post, the count looks probable but I would consider it low probability. In the big picture, we are in SuperCycle : 1923.70 – 1046.38 – 1374.81 – ? This means that price has to drop below 1046.38 to avoid an ugly truncation. So, the 900s may be a possible landing zone. A quick waterfall event in the fifth is needed to precipitate this. However, the current movement suggests it is too lethargic to do so. Also, I somehow dislike the idea of an ending diagonal in a third wave. It usually is the fifth. That is why it is named “ending”. Other than that, we may have to look at lower timeframes to check the validity of all the turns.
In conclusion, I will still stick to my count unless proven otherwise.
Thank you to both Alan, Dreamer and Raymond for very well thought out scenarios. I see this quick trade happening NOW…Alan. I will also sit on my hands for lower entry.
Raymond makes very rational points about current movement in various markets.
NOTE: once this PM rally really gets going, Note the weekly Diag. Trend line that stopped the rally in July 2016 @ 1375. This of course coincides w/ a strong resistance point as mentioned by Raymond and Alan of about 1259 – 1278 for bounce/rally to come.
Thanks to all. Great Health and Prosperity to Everyone for 2017, especially Ursula…be well and positive.
I should be surfing, not looking at charts. But I want an entry for Gold to go long.
I’m more sure of my wave count today for the S&P than I am for Gold. I cannot resolve the structure of minute a. Minute b is < 0.9 X minute a so the minimum for a flat is not met. So it must be a zigzag. But I cannot see minute a as a five. Maybe it will fit on the one minute chart. Or... maybe the low for Gold is in. The price point that will tell us that is more likely is 1,151.95. While price remains below 1,151.95 the possibility of another low is very real. However, today Gold has broken clearly above the parallel channel which contained the waterfall down. That is an early signal that the low might be in. Now for price to give more confidence, then I'll look for my entry.
This will work actually.
Thanks for the quick chart!
Thank you Lara for all you do for us.
“Surf’s Up”
I may have jumped the gut a little but I thought the duration of the existing extreme sentiment made a long trade fairly low risk. I am fully long Silver with a very tight stop at 15.75 to protect profits and so far the trade is doing quite nicely. I plan on taking profits on half my position once we clear 16.00 and reloading on any pull-back under 15.50 or a re-purchase of position if we clear 16.50.
Nicely done Verne 🙂
Trying my EW skill !!!!!
The second alternate Hourly II is invalidated because it is no longer a triangle while wave e is much above the wave c?????
Did I pass???
Yes, pass 🙂
Before the election there was the thought that trump would be good for gold. After the election and a spike up to 350 gold took a nosedive. Selling fed on itself. I believe there were a lot of people that went long after the election that have been selling for tax loss reasons. I believe this will abate after the beginning of the year. It may be just a relief rally and if that is the case I’m sure Lara and the commercial traders will guide us. There is always the Spector of trump going a little far with the Chinese or North Korea. The knife cuts both ways with him so he could also push prices down further. The commercials are gathering longs and selling their short positions for a nice profit since they were short a net 300 k at 1375 or so. They are now about 100k net short. (. They are usually net short to hedge themselves since they buy gold for jewelry, coins, decorations, etc). There is also the opportunity for gold to run on trumps spending, although I believe he will be cutting the fat along the way too.
To summarize, there is still some room to fall but the probability for a move up to higher levels than here in the near future is favorable in my opinion.
” After the election and a spike up to 350 gold took a nosedive. Selling fed on itself. I believe there were a lot of people that went long after the election that have been selling for tax loss reasons. ”
I was watching the market and election results coming in. As Trump chances of winning increased gold went up. Moment s later it stared to slde and general market went up.
For gold the reason is right at that moment across the world in the morning 9AM declare top bank notes Rs 500 and Rs 1000 no longer a legal tender from that day on.
India is the biggest gold retail market in the world. 100% of the gold jewelry is purchased by cash only.
Since that time on gold has been sliding and gold stores are ghost town.
Gold reacts to any monetary changes in important countries.
Market mood has changed.
Meant 1350. Yes, sure that was a huge hit but I don’t think it will hold because of the black market in India for gold. We will see what the new year brings. Thanks for the clarification on why gold fell.
Also I find it highly improbable that this could occur at the same time gold is surging. This seems like a calculated event perhaps in collusion with a large entity that was short gold at the time. I would not be surprised once those entities get on the right side of the trade that India reverses position. (When the commercials have gotten on the right side of the trade). Unfortunately we will probably never know.
Folks. This is just a big picture to get us orientated as we navigate the labyrinth of the turns in the gold price.
First and foremost, the overall trend is DOWN. If you look at the moving averages, EMA13 < EMA34 < EMA89, and price just poked its head slightly above EMA13. This is a bear market. I am not convinced by those people out there clamouring for the moon shot.
I am playing for a rebound somewhere (to be discussed below) towards 1278 thereabouts before the large drop to the 800s.
Consider the current count. This count is predicated on the premise that the interim low has not been reached yet. Lara's target is 1116. As I see it, all three hourlies appear to be in jeopardy with the rise towards the high of 1148.61. Minor 4 is most likely to be a simple zigzag or a combination. It doesn't really matter. I can't really tell whether the third subwave (minute c or y) has ended yet or it still is at its third subwave. It is possible to squeeze in the 4th and 5th subwaves to make Minor 4 = 1148.61, and this at the 1-minute timeframe. I am not too happy with that. The picture is rather ugly. If anybody can throw light to this, I will be most grateful.
(1) If ended, then Minor 4 = 1148.61.
(2) If not, then one high is required.
(2.1) If this high < 1151.95, this count is still valid.
(2.2) If above 1151.95, then the more arduous 1st count needs to be revived.
The 1st count assumes that the interim low was in at 1123.08. It too will target 1278 thereabouts but it would take a more circuitous route. My current count is that there needs to be two 4-5s before Intermediate A ends, and we have the B and C before reaching 1278.
I am awaiting clarity as to whether 1148.61 ended Minor 4. If no new high is reached, then this is it.
Small inverted H&S pattern in play for GDX
Possible EW count update for GDX. Gold can still make a new low while GDX corrects for Minor wave 2 without making a new low.
GDX showed some positive signs today, although there are no significant breakouts yet:
> Price closed the GAP from over a week ago, proving that it was not a breakaway gap to the downside. Volume remains low, not confirming the move up.
> RSI shows multi-month positive divergence and is moving up toward 50
> A bullish falling wedge may be forming
> Slow STOC has a positive cross and has moved above 20
> MACD has crossed positive, although it remains below zero
> OBV is still sandwiched between trend lines
Thanks Dreamer for filling in for Lara, I was going through withdrawal
Gold reached $1,151.00 last night. This is still below the invalidation point of $1,151.95
What does everyone think? Are we still on target for $1,116?
Thanks in advance.
I’m guessing that we are now on the hourly chart – second alternative posted above.
We had a sharp spike up to $1,151.00 last night, followed by a quick reversal down.
Who agrees with me on this?
Using Lara’ Grand super Cycle wave count (lime Green) following table of corrections and extension is computed. I assume gold prices for the year are average price. So it does not correspond to the highs/lows in the year.
Based on Alf Field’s theory of gold’s typical correction and extension pattern (with in EW) attempt is made to find the next top.
All prices are in USD:
A complete history of Price of Gold.
Year: 1923-1931= 8 year
21.73 to 17.06= -4.67, -21.5%
1931-1936= 4 years
17.06 to 34.87= +204%
1936-1949= 13 years
34.82 to 31.39= -3.48, -10.0%
1949-1969= 10 years
31.39 to 41.09= +31.0%
1969-1970= 1 year
41.09 to 35.94= -5.15, -12.5%
1970-1975= 5 years
35.94 to 161.02= +448%
1975-1976= 1 year
161.02 to 124.84= – 36.1, -22.5%
1976-1980= 4 years
124.84 to 612.56= +491%
1980-2001=21 years
612.56 to 271.04= -341.52, -55.75%
2001-2012=11years
271.04 to 1668.98= +616%
2012-2016= 4 years
1668.98- 1045= -623.98, 37%
Projection: 2016- ????Any guesses, will it repeat; +616%,448%,491%,204% of the past from the current low?????
@ median 350% rise when gold turns to bull trend:
POG= 1045×3.50= $3657!!!!
Considering The Rule of Alternation last down year was 21 years, current correction has lasted 5 years equal in magnitude of price correction from recent top.
This is a look at the forest while every one is looking at the grass???
Surfing Santa!!! Short video.
https://www.youtube.com/watch?v=tuFr76btbnE&feature=youtu.be
Wave Mastery wave counts almost like Lara’s with various optional wave counts.
Elliott Wave Analysis of GLD, Gold & Silver as of 24th December 2016
https://www.youtube.com/watch?v=16_Sy-6XAKE
He’s right. There are plenty of options open at this time for Gold. And he’s also right that it’s best to be aware of all options.
He’s got a highly truncated running flat in there though. It’s an interesting variation for the count, but I don’t like it.
His EW looks like he’s following all rules, it looks pretty solid. Good link, thank’s Papudi
*full disclosure: I only watched a bit of this video and looked at his Gold spot charts. I don’t like watching too much video 🙂
Gold daily sentiment at 29 year low…may be setting us up for a bottom or at least a strong rally
http://www.elliottwave.com/Metals/Is-Gold-Setting-Up-For-A-Rally?sc_camp=29CA88E06F4C4E55A3BEFCAACE2104FE
Happy holidays to all!
Great job Lara. Excellent EW analysis.
Soon 8 year cycle in USD will come to head and a turn in trend will to come.
————————————————————————
The Dollar Bull Overstays Its Welcome
As this current dollar bull stands, it is now been on the go for eight years and eight months, which is one year above the average and two months off the longest ever bull. In other words, I would say this dollar bull is getting long in the tooth and will soon be replaced by a dollar bear which will run for an average of seven years and eight months………..
http://www.321gold.com/editorials/silveranalyst/silveranalyst122416.html
Dear Lara and all fellow traders on this forum: a happy holiday to all (and to fellow believers, a time to remember the birth of Jesus and its significance).
May I add my trading strategy based on Lara’s three alternatives outlined above:
(1) If price moves above 1135.26 in the short term, then the Main Hourly is highly favoured.
(1.1) If the next three waves stop below 1142.11, then the move is still valid. Note that this next drop will be followed by a rise, not exceeding 1151.95, before a southerly course is set. If it exceeds 1151.95, then the discarded first count, or some variant thereof, needs to be resuscitated.
(1.2) If the next three waves move past 1142.11, then the discarded first count, or some variant thereof, needs to be resuscitated.
(2) If price does not break 1135.26 in the short term, the hourly alternates will be the favourites.
(2.1) The next critical bifurcation is at the 1123.08-1115.85 region. If price continues to sail past this point southwards, then the Hourly First Alternate is correct. I will drop anchor at the end target of 1116 and change course to a northerly one.
(2.2) If price moves up strongly above the 1123.08-1115.85 region, then the Hourly Second Alternate will be in play. The limit to this rise will be at 1151.95. Price should then chart a southerly course towards the target of 1116. However, should price exceed 1151.95, then the discarded first count, or some variant thereof, needs to be resuscitated.
I think I have covered all bases. I will continue to post updates as and when I see any deviation from this battle plan.
A most excellent plan, thank you Alan for outlining this clearly.
Nice work Alan. Thank you for your views. I am sure a lot of members here will be looking out for your updates. Undoubtedly a most eloquent, brilliant and thorough analysis by Lara with so much clarity to help us tide through to new year~! MERRY CHRISTMAS and happy holidays to all the avid members wishing all good trading~!
Thank you Alan, for that deeply appreciated reminder that we celebrate the birth of the King. A blessed season of Emmanuel to all!
I guess we are getting resucittated? Perhaps tax loss selling is abating but new highs in stock markets may hold us in check. Cleared the 1142 hurdle and close to 1151.95 but no cigar, yet. Perhaps we are in two down of 3 up