
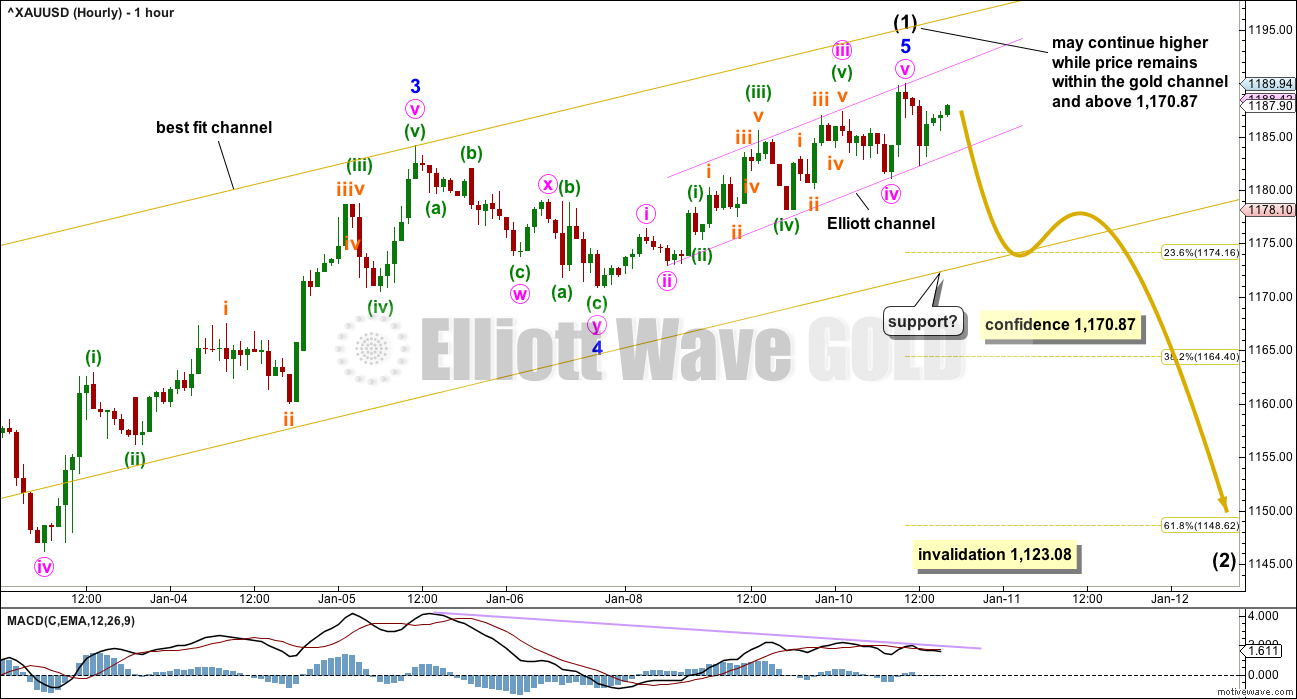
Some weakness is seen in this upwards movement and price remains within a narrow channel on the hourly Elliott wave chart.
Summary: Gold is in a new bull trend. In the short term, a downwards correction should be expected to have begun either today, or very soon, and this will offer an opportunity to join the trend when it completes. The correction may be very deep; the 0.618 Fibonacci ratio at 1,149 is the first expectation, but it may be deeper than this. Look for a breach of the pink channel on the hourly chart first before any confidence at all may be had that the correction has begun. Price confidence will come with a new low below 1,170.87.
New updates to this analysis are in bold.
Last monthly and weekly charts are here. Last historic analysis video is here.
Grand SuperCycle analysis is here.
MAIN ELLIOTT WAVE COUNT
DAILY CHART
Click chart to enlarge.
This main wave count has a better fit for prior movement. To see the difference between this main wave count and the alternate below please refer to last historic analysis linked to above.
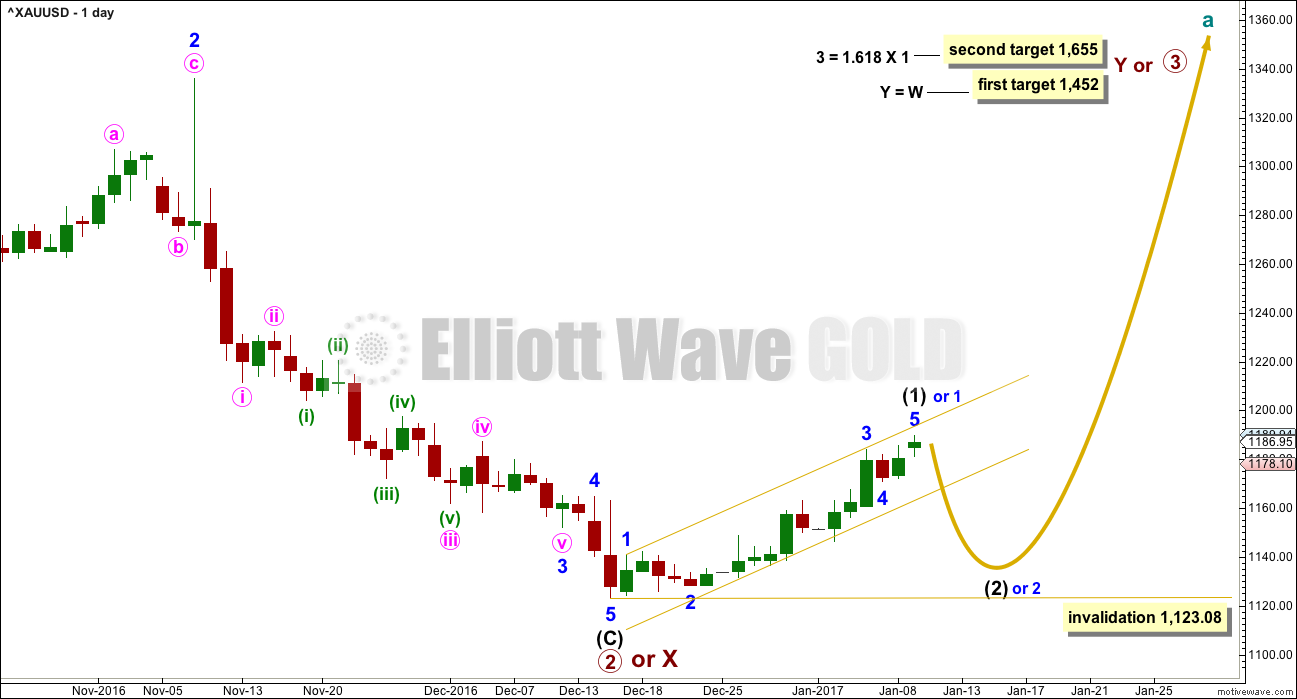
This main wave count expects Gold has had a primary degree trend change in December 2016. The new upwards wave is either a primary degree third wave, or a primary degree zigzag to complete a double zigzag.
Intermediate wave (1) is either over today or should be very soon. Upwards movement is showing increased weakness. While price remains within the gold channel, it must be accepted that minor wave 5 may extend higher. A breach of the gold channel on the daily chart would provide strong indication of a trend change.
The first in a series of second wave correction for Gold’s new impulses is usually very deep. Intermediate wave (2) is expected to be at least 0.618 the depth of intermediate wave (1), and very likely may be deeper. It may not move beyond the start of intermediate wave (1) below 1,123.08.
The upcoming correction for intermediate wave (2) should present an opportunity to join a new trend.
So far intermediate wave (1) has lasted 19 sessions. If it continues, then it may be for a further two sessions to total a Fibonacci 21.
Intermediate wave (2) may be at least as long in duration as intermediate wave (1), and fairly likely it may be longer. A Fibonacci 21 or 34 sessions will be the expectation. Corrections are often more time consuming than impulses.
HOURLY CHART
Click chart to enlarge.
Upwards movement from the low on 15th of December will subdivide as a completed five wave impulse. This may be intermediate wave (1) as labelled, or the degree may be moved down one and it may only be minor wave 1 (as noted on the daily chart).
Minor wave 5 may have extended further today. There is now double divergence between price and MACD. This is not a signal of a high in place and only indicates that this last upwards wave exhibits weakness. Divergence is a warning of an approaching trend change.
Within intermediate wave (1), Fibonacci ratios are: minor wave 3 is 3.85 short of 6.854 the length of minor wave 1, and minor wave 5 now has no Fibonacci ratio to either of minor waves 3 or 1.
Within minor wave 5, Fibonacci ratios are: minute wave iii is just 0.07 longer than 2.618 the length of minute wave i, and minute wave v is just 0.02 longer than 1.618 the length of minute wave i.
The pink channel is drawn using Elliott’s second technique about minor wave 5. With price finding support at the last low, at the lower edge of this channel, there is no indication yet of a trend change. The earliest indication would be a breach of the lower edge of this channel.
The next indication of a trend change would be a breach of the lower edge of the gold channel. That would provide reasonable confidence in a trend change.
Finally, a new low below 1,170.87 would provide price confidence in a trend change.
ALTERNATE ELLIOTT WAVE COUNT
DAILY CHART
Click chart to enlarge.
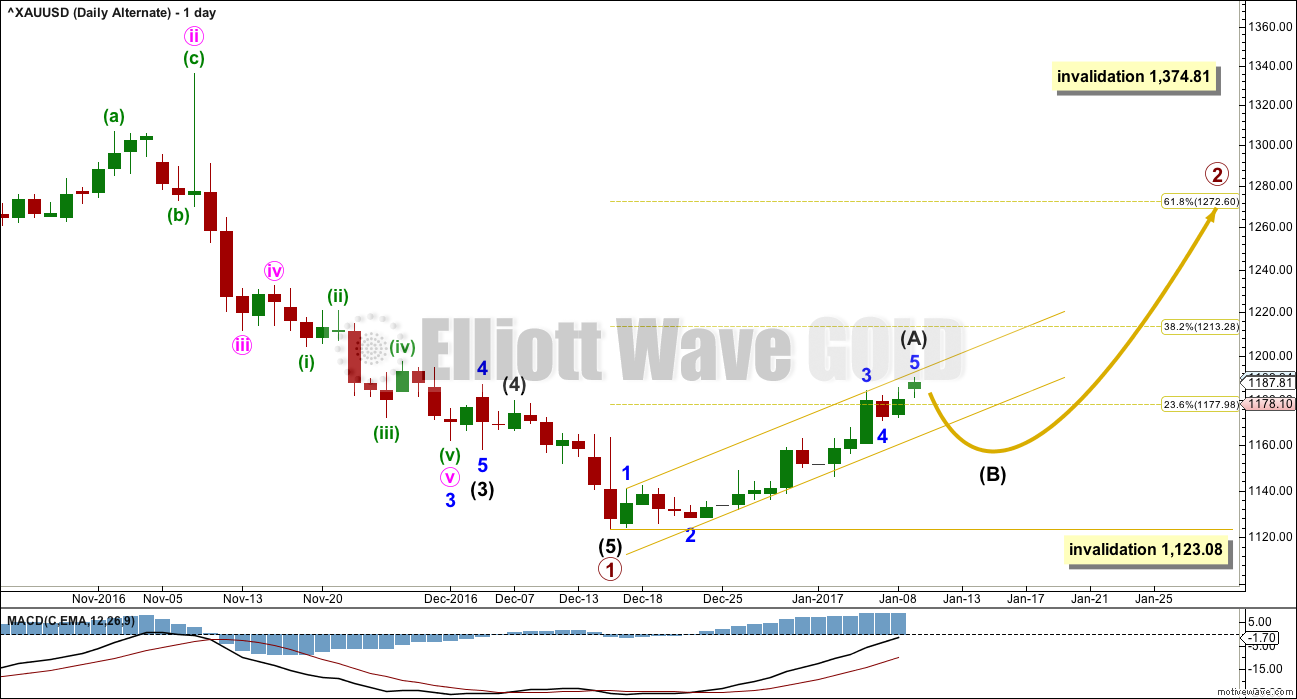
This alternate wave count expects that Gold is still within a bear market. Targets for new lows can be seen on weekly and monthly charts.
Within the bear market, a primary degree correction is underway.
Primary wave 2 is most likely to subdivide as a zigzag. So far it looks like a five up is either complete now or very close to completion. This may be intermediate wave (A).
It is also possible to move the degree of labelling all down one degree within upwards movement for intermediate wave (A). It is possible that only minor wave 1 within intermediate wave (A) is complete. Either way the invalidation point remains the same. If a five up is complete, then the following three down may not move beyond its start below 1,123.08.
Primary wave 2 may not move beyond the start of primary wave 1 above 1,374.81.
TECHNICAL ANALYSIS
WEEKLY CHART
Click chart to enlarge. Chart courtesy of StockCharts.com.
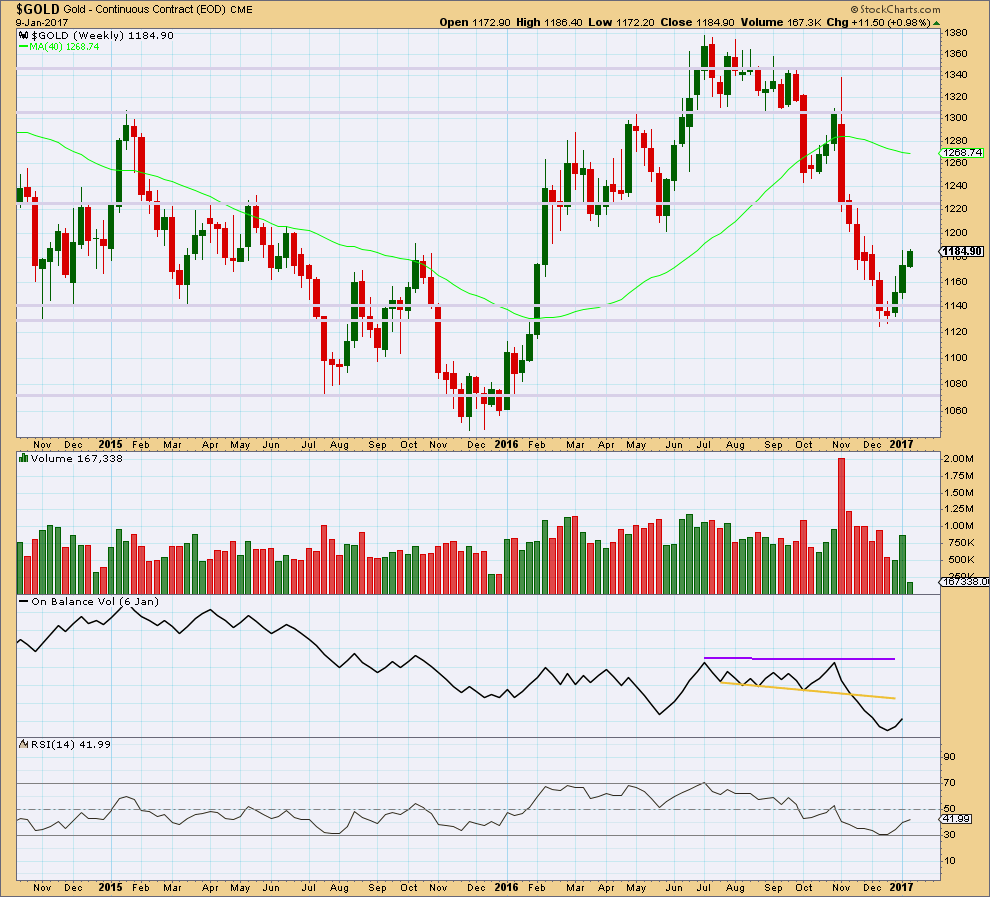
The fall in price to the last low was not supported by volume, so it should be suspicious.
The rise in price for the first two weeks has good support from volume (volume increased during the second week). The current week is incomplete, so no conclusion may be drawn at this stage for this week.
Price has found strong support about prior lines of support and resistance, about 1,140 and 1,130.
RSI almost reached oversold at the last low.
There is a Morning Star candlestick pattern at the low. At the weekly chart level, this is a reasonable reversal signal.
It would be reasonable to conclude that Gold has seen a trend change.
DAILY CHART
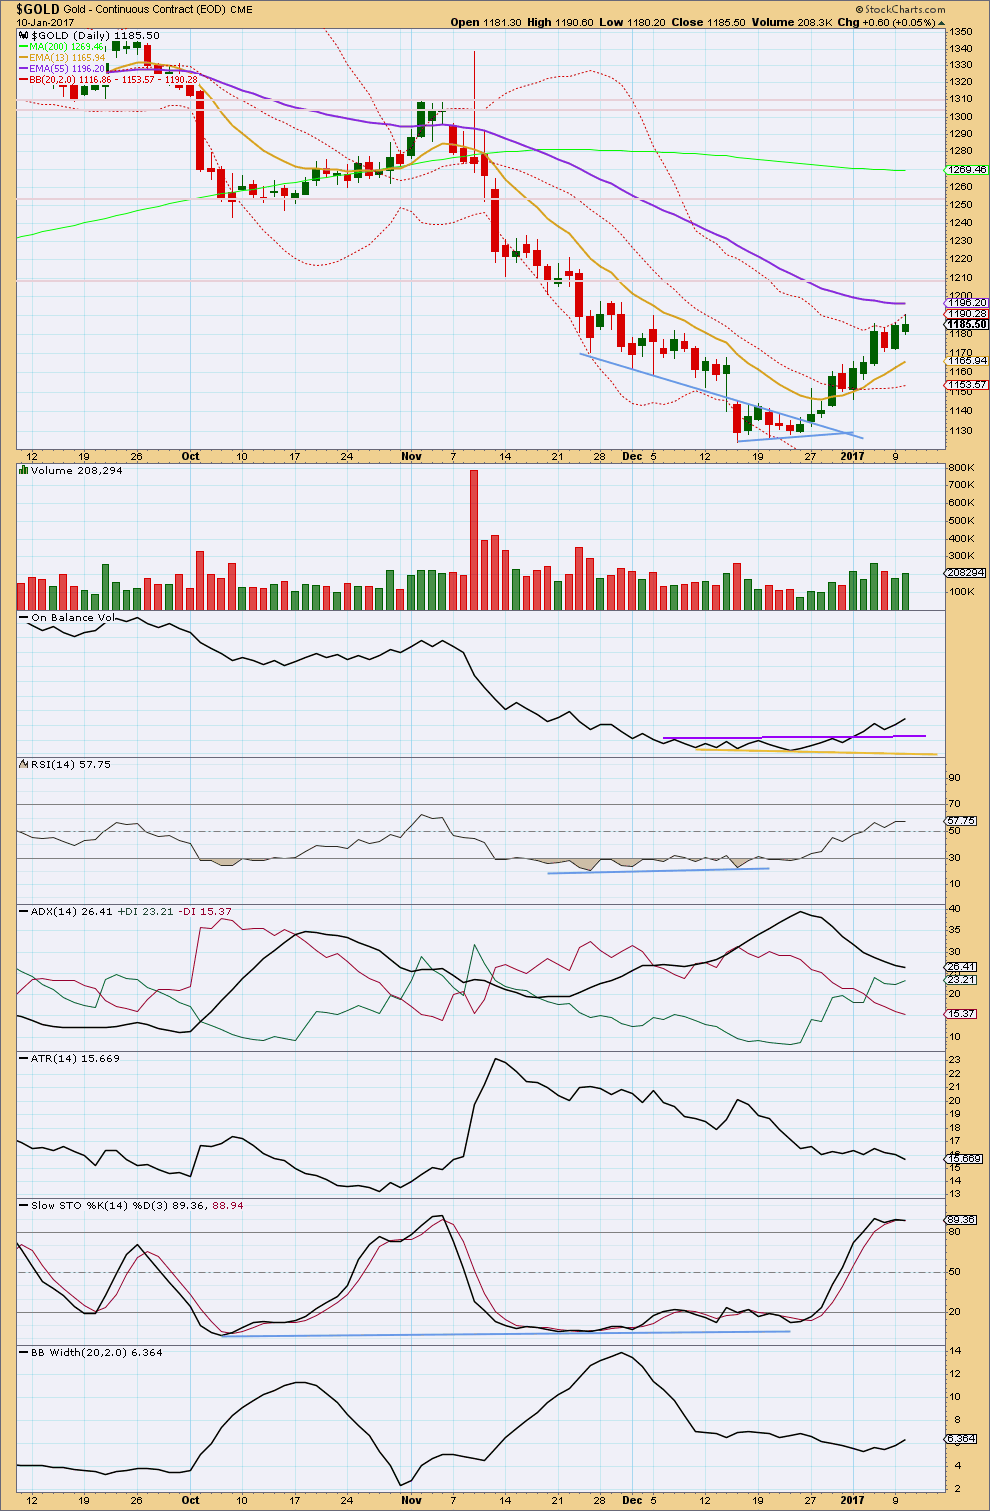
Click chart to enlarge. Chart courtesy of StockCharts.com.
Volume today shows some small increase. The rise in price today had some support from volume. However, volume is lighter than the two stronger sessions three and four days ago. For the last three sessions, there has overall been a fall in volume as price has risen.
The upper wick on today’s small green candlestick is slightly bearish.
Price has moved above the short term Fibonacci 13 day moving average and this may now provide some support. The short term average is pointing up.
The mid and long term moving averages look to be flattening off today. If these turn upwards, then a possible new upwards trend would be indicated.
On Balance Volume is bullish with a break above the purple resistance line. This line then provided support for a back test, which is another bullish signal. OBV is often a leading indicator.
There is some concern over ADX remaining extreme and the black ADX line above both +DX and -DX lines. But the +DX line has crossed above the -DX line and this indicates a potential trend change from down to up. No clear trend is yet indicated with the ADX line still declining. ADX is a lagging indicator also as it is based upon averages.
ATR is flat while price moves higher. This upwards movement lacks range. This is common for the early stage of a new trend, but it is also common for corrective movements.
Stochastics is overbought and price is at the upper edge of Bollinger Bands. Some downwards reaction either here or very soon is a reasonable expectation at this time, and this fits with the Elliott wave count short term.
GDX DAILY CHART
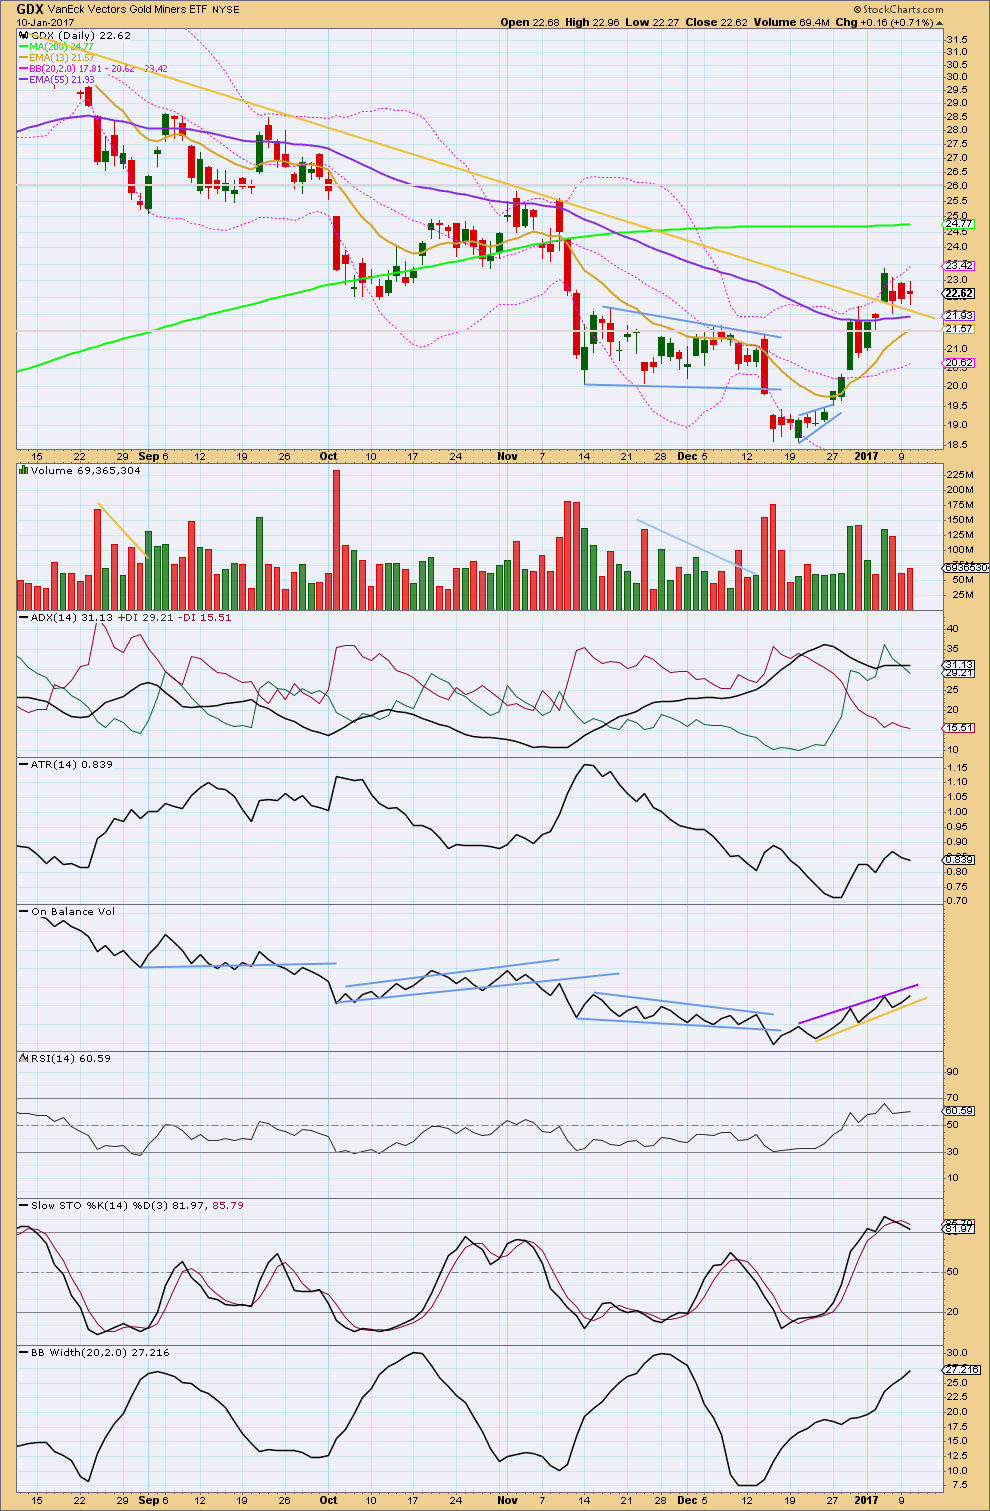
Click chart to enlarge. Chart courtesy of StockCharts.com.
The trend for GDX looks clearer today than for Gold. For GDX all three moving averages are increasing, so an upwards trend is indicated. However, the short term Fibonacci 13 day average is still below the mid term Fibonacci 55 day average, which is below the long term 200 day average. If GDX is in a new trend, it is very early.
ADX, which is close to but not yet above 35, also indicates an upwards trend for GDX. ADX is now above both the +DX and -DX lines indicating an extreme trend.
Volume has seen some increase while price rises. The last three red daily candlesticks have overall lighter volume for the last two of the three; the fall in price is not supported by volume overall. This looks like a small consolidation within a new upwards trend.
ATR is increasing while price rises. The trend looks healthy.
RSI is bullish and is not yet extreme.
Stochastics is overbought and price is at the upper edge of Bollinger Bands. Some downwards reaction about here or very soon is a reasonable expectation before the trend continues.
On Balance Volume has new trend lines. A break above or below may indicate the next direction for price.
This analysis is published @ 05:21 p.m. EST.
Price is still within the gold channel and still above 1,170.87 so it must still be accepted that minor 5 can still extend higher. We still don’t have any good confidence of a trend change.
The pink channel didn’t work, it was too narrow. With all of this upwards movement (barring one overshoot) contained within the gold channel it has stronger technical significance.
If price can break below the lower gold trend line then expect price has turned.
I’m struggling with how the subdivisions of the middle of minor 5 can fit here, and with that problem it also indicates the possibility of more upwards movement so that the overlapping is resolved. I’ll look at those subdivisions on the five minute chart.
I’m now thinking that the price point for confidence in a change may be moved up to the last low at 1,177.46. After analysis of the five minute chart I may do that.
Lara/Melanie,
On question of Gold inverse relation to USD you are correct on the short term basis as it shows clearly that this relation is valid.
However on a longer term it may be some time not true.
Attached is a chart of gold overlaid USD from 1974 to today by Fully on GoldTent forum.
If one examines the relation between the time period 1975 to 1985 USD rose from 98 to 161 top. Totally unquestionable uptrend in USD.
During the time period gold rose from $150 to interim top $850 and down to $300 at USD peak of 161.
In 1975 if any one predicted that USD will rise from 98 to 161 top in coming years one with investment paradigm of inverse relation of Gold to USD would not have been in gold investment and missed the once in life time opportunity.
During the next 5 years period from 1975 gold skyrocketed 600% from $150 to $850.
Lara if you have professional sub from Stockchart you can get this chart from 1970.
Yes it may be that current trend for USD is up and target is 121, what if gold price repeats the same relationship again.
I would stay with investment decision based on individual EW counts of gold/USD and not worry about the inverse relation.
IMHO.
Hi Papudi,
Thank you for showing this chart. I saw this chart @ Goldtent, but at the time was concentrating more on the pattern within the green circles and the inverse H&S.
You make a very good point about analyzing Gold and US Dollar individually. Correlations are very difficult to count on.
I agree Alan, the relationship is not persistent.
There’s another instance where on a longer time frame it didn’t persist; from 1987 to 1992 Gold and USD both fell to new lows.
I’ve also looked at major turning points and they are usually months apart. In other words, a major high for Gold does not usually correlate to a major low for USD.
And so I also agree quite strongly with your conclusion that we shouldn’t base either wave count or decision for one market on what the other is doing.
Oops. I think you meant Papudi.
Oh sorry, yes Alan. I meant Papudi 🙂
I have a feeling that Minute 5 may not have ended yet. It could also be extending. It might reach the 1190-1200 region that I had been alluding to. 1200 is a round number, psychological resistance, and it might probably inhibit the advance, albeit momentarily. A deep correction needs to first ensue before price can gather enough strength for another foray.
What this may signify is that the new uptrend is likely to be strong, with extending third and fifth waves even at the beginning.
Hi Alan – Impressive call! With gold falling this morning I was thinking that it was going to fall through the 1170 confirmation level, but what a rebound it experienced today.
Is this the blow off top that is typical with 5th waves and we’re heading down from here?
USD/JPY took a nose dive today… strong correlation with gold. In addition, the 10 year Treasury sunk as well.
The Atlanta inflation report was below the prior reading (2.1) and is at 2. Not a strength for gold.
Five Fed speakers to deliver messages on the economy. I’d expect that they’re message will emphasize 3 rate increases and should strengthen the dollar.
Thanks for the insight!
Agreed Alan, nicely done.
Price is still within that gold channel though, so it could keep going up.
It’s showing persistent and further weakness, but as we know this can continue and develop further before price turns. All it tells us is that the move is extreme and to be alert for a change.
Almost there!
Minuette 3 of Minute 5 completed at today’s high of 1197.73. We are now in Minuette 4 down.
Minuette 4 is most likely completed at 1189.48.
Last rise is now underway.
Here is a monthly chart of the USD index overlaid with a monthly chart for the same period of time of Gold spot price. I’ve flipped Gold vertically so it’s easier to see if these two have an inverse correlation.
As you can see they usually do, but not always. And the times when they don’t can span many months.
I’m working on a USD analysis now, it will be published at EWSM and it will be public.
Lara…thanks much for Dollar/Gold chart comparison. The inversion shows price action very clearly.
I’ll look forward to your Dollar Analysis once you publish.
The USD analysis is now published over at EWSM.
Hi Lara, I’m a new subscriber. What is EWSM?
Ty,
David
Lara,
Excellent analysis on US Dollar.
You mentioned that Cycles wv II was very deep, therefore (I thought I heard you say) ” Cycle wv IV shouldn’t be expected to be shallow”. Am I correct in reference to what I heard you say??
(Generally, I hear your lovely New Zealand accent with no problem, but on occasion I have a little trouble. Must be that I lack enough ‘musical ear’.)…..Thanks.
And If David is reading….I just saw your note below. Lara is refering us to her 2nd website: elliottwavestockmarket.com
Thank you , Melanie
Oops… I misspoke. I meant that cycle IV should be shallow. To exhibit alternation.