
Resistance will be used to see where price may turn. Fibonacci numbers are used for duration and parallel channels are used for confidence in a turn.
Summary: If upwards movement continues, it may now be for only one more day; price may find resistance about 1,210. In the short term, a new low now below 1,177.46 would indicate a deeper correction has likely begun. Price needs to break below the gold channel for reasonable confidence in a trend change.
New updates to this analysis are in bold.
Last monthly and weekly charts are here. Last historic analysis video is here.
Grand SuperCycle analysis is here.
MAIN ELLIOTT WAVE COUNT
DAILY CHART
Click chart to enlarge.
This main wave count has a better fit for prior movement. To see the difference between this main wave count and the alternate below please refer to last historic analysis linked to above.
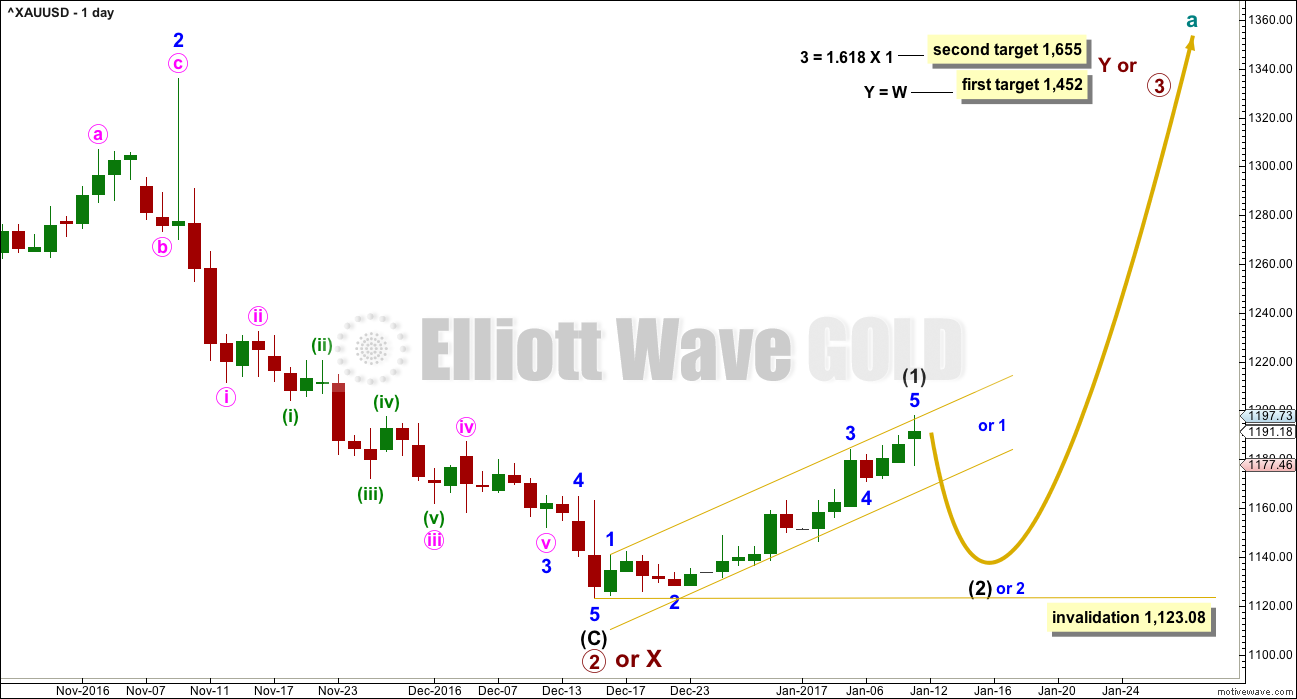
This main wave count expects Gold has had a primary degree trend change in December 2016. The new upwards wave is either a primary degree third wave, or a primary degree zigzag to complete a double zigzag.
Intermediate wave (1) is either over today or should be very soon. Upwards movement is showing increased weakness. While price remains within the gold channel, it must be accepted that minor wave 5 may extend higher. A breach of the gold channel on the daily chart would provide strong indication of a trend change.
Intermediate wave (1) has so far lasted 20 sessions. If it continues for just one more, then it may end with a total Fibonacci 21 sessions.
The first in a series of second wave corrections for Gold’s new impulses is usually very deep. Intermediate wave (2) is expected to be at least 0.618 the depth of intermediate wave (1), and very likely may be deeper. It may not move beyond the start of intermediate wave (1) below 1,123.08.
The upcoming correction for intermediate wave (2) should present an opportunity to join a new trend.
Intermediate wave (2) may be at least as long in duration as intermediate wave (1), and fairly likely it may be longer. A Fibonacci 21 or 34 sessions will be the expectation. Corrections are often more time consuming than impulses.
HOURLY CHART
Click chart to enlarge.
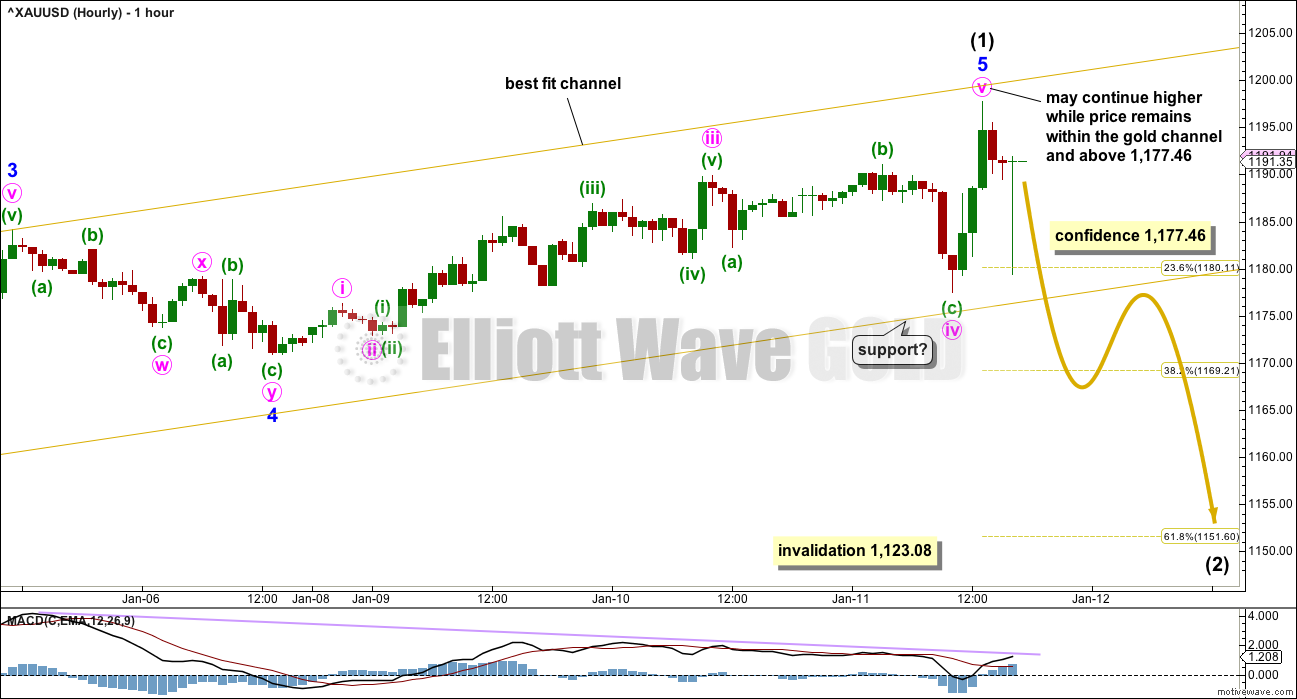
Upwards movement from the low on 15th of December will subdivide as a completed five wave impulse. This may be intermediate wave (1) as labelled, or the degree may be moved down one and it may only be minor wave 1 (as noted on the daily chart).
Minor wave 5 may have extended further today. There is now triple divergence between price and MACD. This is not a signal of a high in place and only indicates that this last upwards wave exhibits weakness. Divergence is a warning of an approaching trend change.
Within intermediate wave (1), Fibonacci ratios are: minor wave 3 is 3.85 short of 6.854 the length of minor wave 1, and minor wave 5 still has no Fibonacci ratio to either of minor waves 3 or 1.
Labelling within minor wave 5 is today changed after analysis of the five minute chart. There is alternation between a quick zigzag for minute wave ii and a more time consuming expanded flat for minute wave iv. There are no Fibonacci ratios between minute waves i, iii and v.
Indication of a trend change would be a breach of the lower edge of the gold channel. That would provide reasonable confidence in a trend change.
A new low below 1,177.46 would provide price confidence in a trend change. At that stage, downwards movement could not be a second wave correction within a final fifth wave of minute wave v, so minute wave v would have to be over.
ALTERNATE ELLIOTT WAVE COUNT
DAILY CHART
Click chart to enlarge.
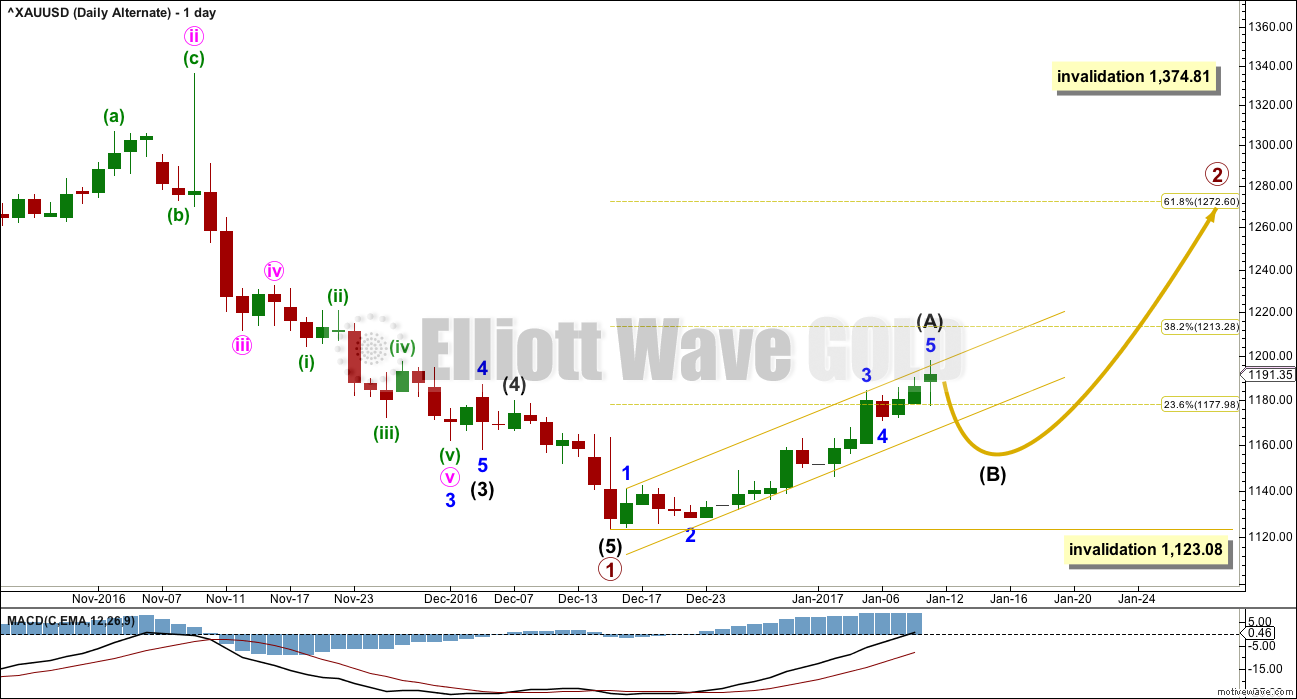
This alternate wave count expects that Gold is still within a bear market. Targets for new lows can be seen on weekly and monthly charts.
Within the bear market, a primary degree correction is underway.
Primary wave 2 is most likely to subdivide as a zigzag. So far it looks like a five up is either complete now or very close to completion. This may be intermediate wave (A). As for the main wave count, if intermediate wave (A) continues for one more day, it may end in a total Fibonacci 21 sessions.
It is also possible to move the degree of labelling all down one degree within upwards movement for intermediate wave (A). It is possible that only minor wave 1 within intermediate wave (A) is complete. Either way the invalidation point remains the same. If a five up is complete, then the following three down may not move beyond its start below 1,123.08.
Primary wave 2 may not move beyond the start of primary wave 1 above 1,374.81.
TECHNICAL ANALYSIS
WEEKLY CHART
Click chart to enlarge. Chart courtesy of StockCharts.com.
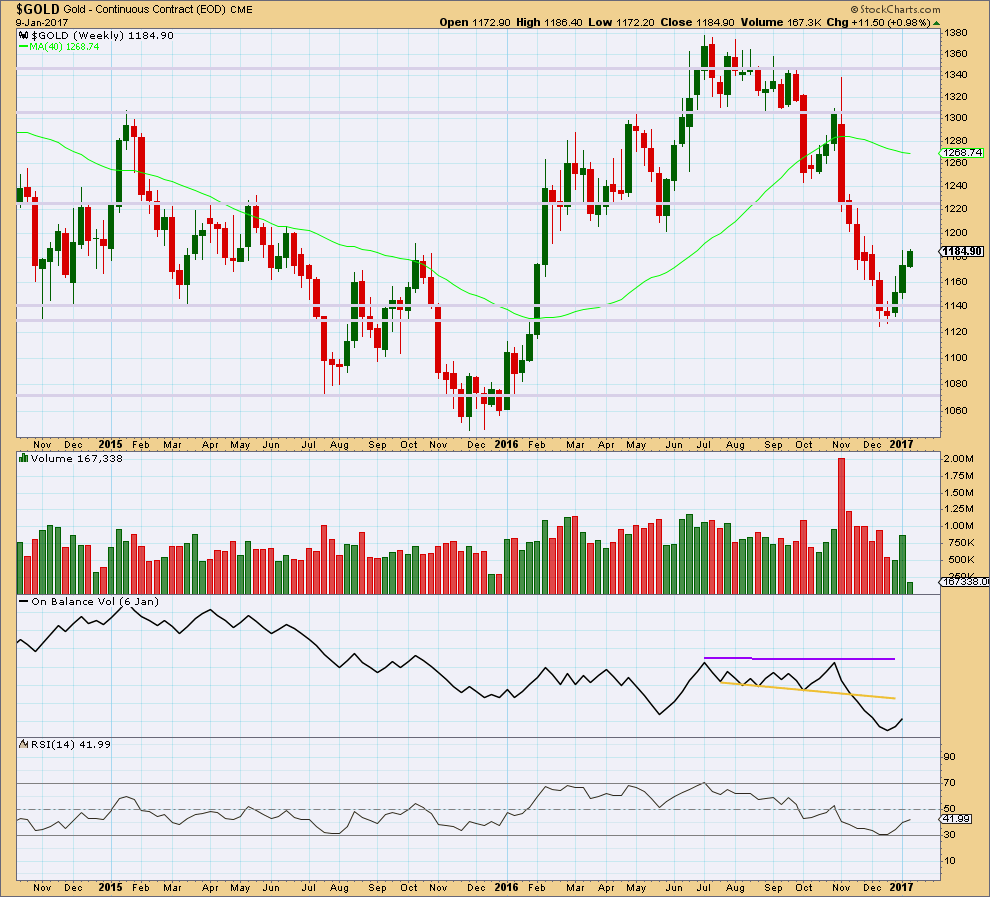
The fall in price to the last low was not supported by volume, so it should be suspicious.
The rise in price for the first two weeks has good support from volume (volume increased during the second week). The current week is incomplete, so no conclusion may be drawn at this stage for this week.
Price has found strong support about prior lines of support and resistance, about 1,140 and 1,130.
RSI almost reached oversold at the last low.
There is a Morning Star candlestick pattern at the low. At the weekly chart level, this is a reasonable reversal signal.
It would be reasonable to conclude that Gold has seen a trend change.
DAILY CHART
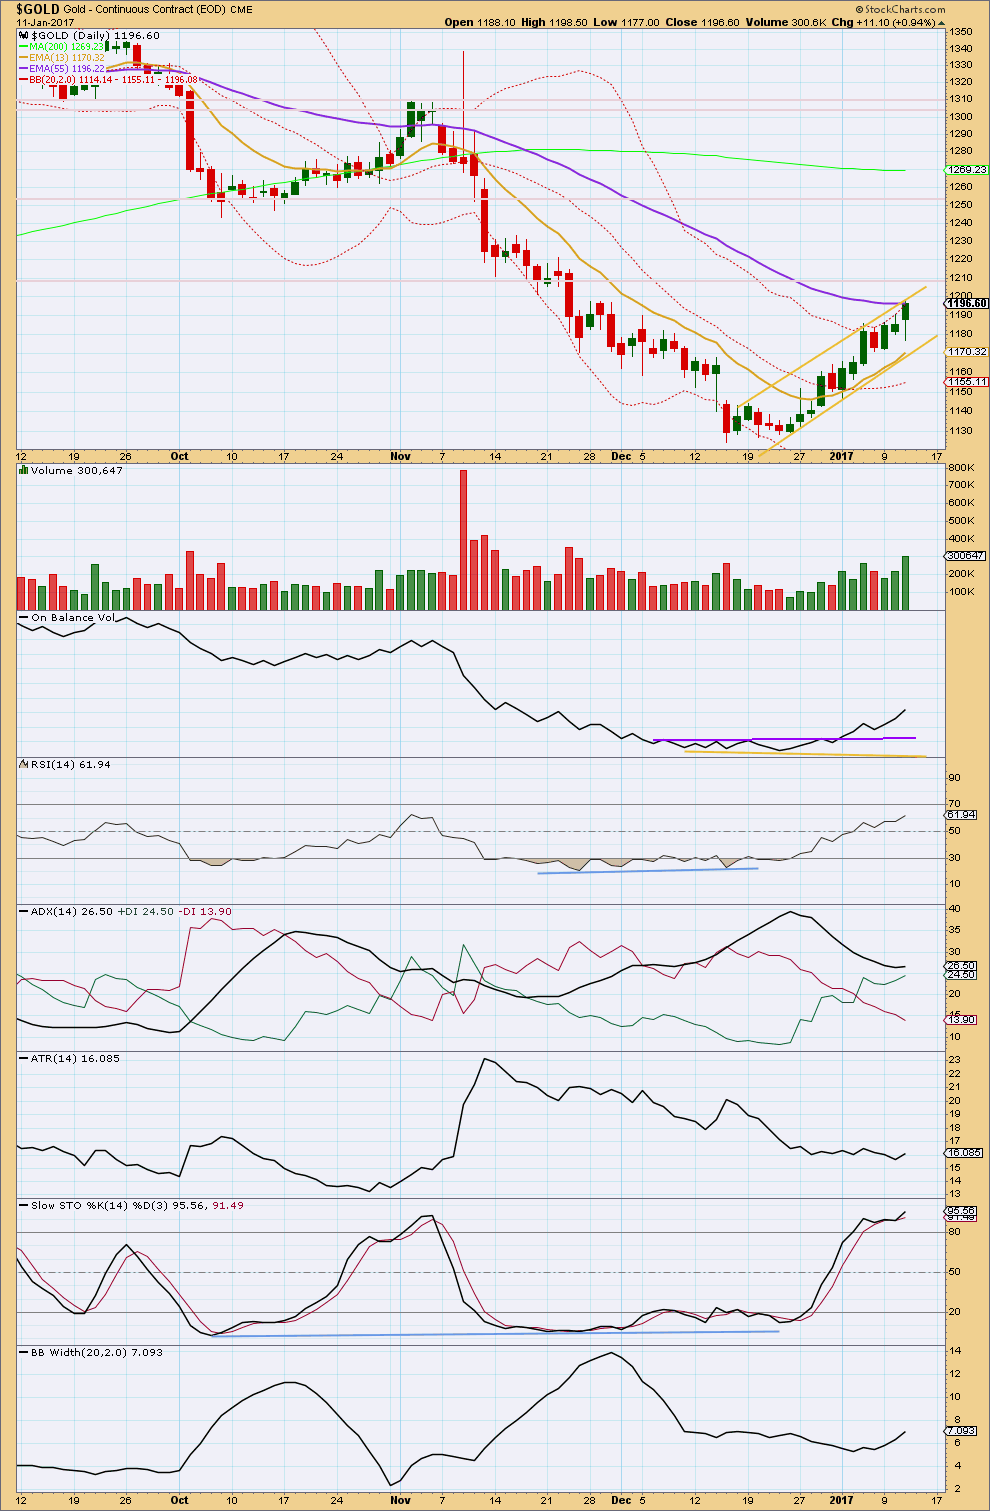
Click chart to enlarge. Chart courtesy of StockCharts.com.
The last three days of upwards movement comes with a steady increase in volume. The rise in price is supported by volume, so it is not suspicious. This looks like a healthy new trend.
The long lower wick on today’s candlestick is bullish.
Price may find some resistance now at the mid term Fibonacci 55 day moving average. If this does not offer resistance, then the horizontal line about 1,210 should.
On Balance Volume remains bullish.
RSI is bullish. The rise in price has strength.
ADX finally indicates an upwards trend in place; this is a lagging indicator as it is based upon 14 day averages. But the black ADX line is still above both the +DX and -DX lines, so it indicates the trend is nearing extreme.
ATR is overall flat, which indicates some weakness within this trend. If this is a first wave, as the Elliott wave count suggests, then this makes sense; first waves are often weak for Gold. Gold normally exhibits strength in third waves and particularly in fifth waves.
Stochastics is overbought, but during a trend this can persist for considerable time. There is no longer divergence today between price and Stochastsics to indicate weakness.
Bollinger Bands are now beginning to widen, supporting the trend with increased volatility.
Overall, this classic analysis today is more bullish. The bottom line is that while price remains within the channel drawn today on this chart, and the Elliott wave charts, expect that price is likely to continue higher.
GDX DAILY CHART
Click chart to enlarge. Chart courtesy of StockCharts.com.
GDX today made a lower low and a lower high, the definition of downwards movement. Although the daily candlestick is green.
The last four daily candlesticks have relatively small real bodies and long wicks, typical of a consolidation. This movement looks very much like a consolidation within an upwards trend. Price may be finding support at the downwards sloping gold line.
ADX today is declining, indicating the market is not currently trending. No trend change has been indicated, the +DX line remains above the -DX line, so a consolidation is indicated only.
ATR is overall increasing as price overall rises. This trend looks healthy.
On Balance Volume gives a small warning today with a weak bearish signal as it breaks below the yellow support line. This signal is weak because the line is steep, not long held, and only tested three times.
Stochastics is overbought still, but this can remain extreme for reasonable periods of time during a trending market.
Bollinger Bands are widening as price moves upwards indicating the trend is normal and healthy.
Corrections are an opportunity to join the trend. A correction is either over soon or may move lower, so watch On Balance Volume tomorrow. If it breaks more clearly below the yellow line, then accept the possibility that GDX could see a deeper correction here to resolve overbought conditions.
This analysis is published @ 06:20 p.m. EST.
BarChart data does weird things from time to time. I’ve noticed that when it does this it often (not always) seems to indicate the next direction for price.
Right now BarChart data has a huge spike down to 1,130. This may disappear within a few hours, but it may not.
If this remains then the high is in for Gold.
Lara: PMbull chart does not have this spike in price down.
It’s now disappeared from BarChart.
Thanks Lara, I was just looking at JPY
I’ve just published an updated daily chart in comments on USDJPY analysis. This looks like a good set up today to go long there.
If you believe the stock market will correct (in to trumps inauguration perhaps), then the dollar will weaken, gold will make a push up. If you think the stock market will go up into trumps inauguration then the top in gold may be here for a while. A lot of people are playing sell the news on the presidency, so I think the odds may favor a pullback first of the stock market and perhaps one more high in gold. To fool everyone maybe the stock market makes a new high first and then pulls back into the inauguration.
This is impossible to read!
i think the top may be in. This looks disproportionately big for a fourth wave.
Gold overshot the top of Lara’s channel this morning. I think this is typical of 5th waves?
We also have a nice RSI negative divergence with this new high on this hourly chart.
50% fib pullback = 1165.8
61.8% = 1156
Short here with a stop above the 1207.2 high?
Alan: “I reckon it would be nearer to 1150-1160.”
I agree with Alan for the drop to stop around 1150-1160. Looking at the 4 hour period HnS the Neck line is at 1160.
Gold broke out of this HnS and reached 1207. Now it may back test the BO at the neckline before resuming upward trend to Lara’s target of wave (3).
No wonder I like Lara’s EW counts. It comes to gather every thing.
Hi David, yes I am planning to trade the drop which should be quite deep.
As I mentioned yesterday, I’m a new member. It seems as though the group is overall looking for a pullback to get long. Lara you believe we top somewhere around today for a drop to 1147 and likely more…so $60-80 dollars.
My questions:
1) Is anyone planning on trading the drop that seems to be imminent?
2) If not, why?
Thank you,
David
I intend to trade the drop but remember it will be ABC. My strategy is a quick in quick out. Also, be careful: sentiment for an ongoing uptrend is still strong. Which means the drop could be shallower than expected, or take a longer time.
The top may or may not be reached today. It seems we are still stuck in Minuette 4 of Minute 5. The 4th wave is now most likely morphing into an ABC, and we are in the B wave. It could take a while. Worse yet, it may become a triangle: sleepy! This analysis is predicated on the fact that there was an anomaly as I commented in a post below.
BTW, the drop may not reach 1147. That was supposed on a top at 1197.73. I reckon it would be nearer to 1150-1160.
I took one half full short position yesterday (by way of JDST) after SLV filled its open gap at 15.87 then closed exactly at that price. The plan was to await a run at the next gap at 16.31 (the low of Nov 14, but it does not seem as if that gap will be filled on the current leg up. Silver will generally telegraph was is coming in the metals. I would not be surprised, despite Gold’s initial strength today, to see SLV end this session below 15.87. If that happens, I enter my the second half of my short trade for the ride down. Interestingly enough, even as I write this both DUST and JDST have bounced back from deep underwater and are now printing green candles. I think we do indeed have a turn.
going up for final minor 5 I think.
Again, BarChart recorded a “crazy” movement at 6 pm, a drop to 1183.15 before retracing the entire drop. This is absent in other data feeds that I know of. But this does not detract from the overall price rise towards the end of Minute 5, only affecting the wave count.
GDX made a lower low today, so the correction could be over, but I think it’s more likely to continue another few days. A little more upwards movement is possible before another move lower. My target is the .382 Fib retracement @ 21.53.
Thank you very much for your GDX analysis Dreamer. It’s great to have another POV
Nice Elliott wave analysis, that all looks good to me Dreamer.
My only comment on it would be the apparent resistance at this time at the gap at the very beginning of minor A down.
If a flat unfolds then that gap needs to close, resistance needs to give way.
If the gap doesn’t close during this correction then intermediate (2) may be a zigzag, the gap may offer resistance.
Yes, Minor B needs to get to 23.22 to meet the 90% retracement minimum for a flat.