
Downwards movement was expected, which is what happened. Friday’s session made a lower high and a lower low, the definition of downwards movement, although the candlestick closed green.
Summary: It is reasonably likely now that upwards movement is over for now and a deep correction may have begun. Price confidence would come with a new low now below 1,183.15. If the gold channel on the hourly chart is breached by downwards movement, then strong confidence may be had that a deep correction has begun. The first target is 1,155, but it may be deeper than this.
New updates to this analysis are in bold.
Last monthly and weekly charts are here. Last historic analysis video is here.
Grand SuperCycle analysis is here.
MAIN ELLIOTT WAVE COUNT
DAILY CHART
Click chart to enlarge.
This main wave count has a better fit for prior movement. To see the difference between this main wave count and the alternate below please refer to last historic analysis linked to above.
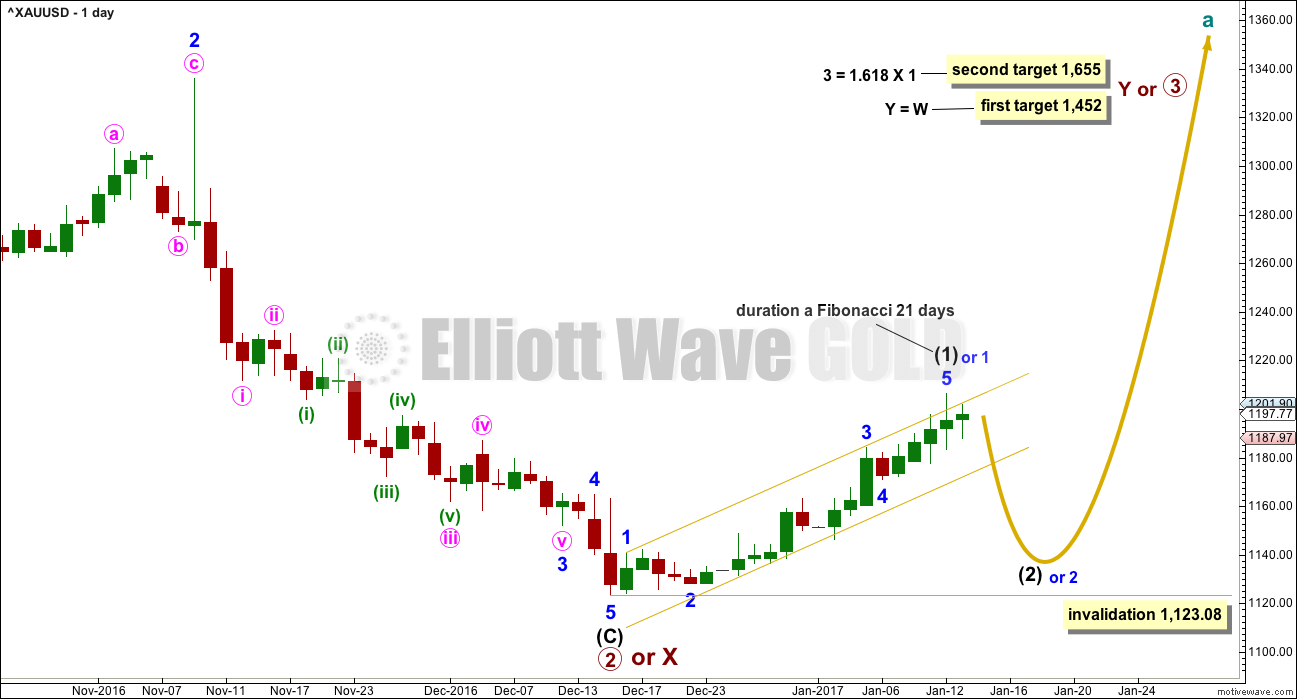
This main wave count expects Gold has had a primary degree trend change in December 2016. The new upwards wave is either a primary degree third wave, or a primary degree zigzag to complete a double zigzag.
Intermediate wave (1) is reasonably likely to be over, lasting a Fibonacci 21 days / sessions. The long upper wick on Thursday’s candlestick is bearish. While price remains within the gold channel, it must be accepted that minor wave 5 may extend higher. A breach of the gold channel on the daily chart would provide strong indication of a trend change.
The first in a series of second wave corrections for Gold’s new impulses is usually very deep. Intermediate wave (2) is expected to be at least 0.618 the depth of intermediate wave (1), and very likely may be deeper. It may not move beyond the start of intermediate wave (1) below 1,123.08.
The upcoming correction for intermediate wave (2) should present an opportunity to join a new trend.
Intermediate wave (2) may be at least as long in duration as intermediate wave (1), and fairly likely it may be longer. A Fibonacci 21 or 34 sessions will be the expectation. Corrections are often more time consuming than impulses.
HOURLY CHART
Click chart to enlarge.
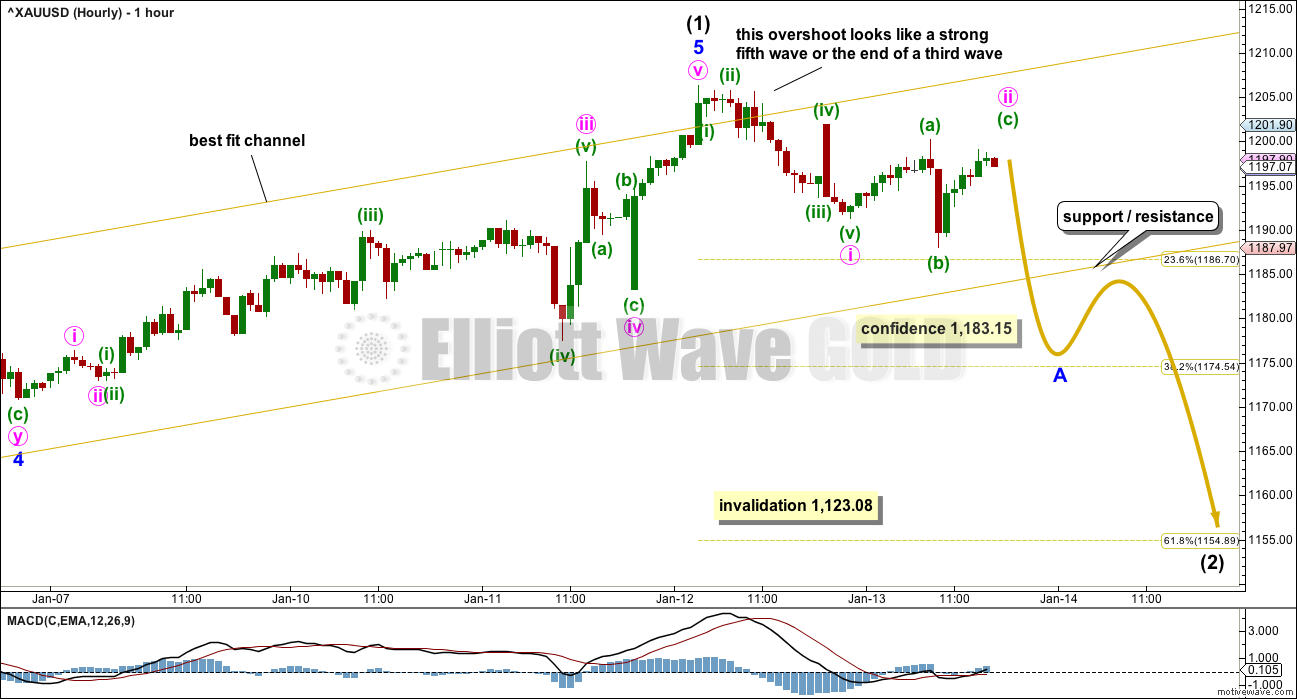
Upwards movement from the low on 15th of December will subdivide as a completed five wave impulse. This may be intermediate wave (1) as labelled, or the degree may be moved down one and it may only be minor wave 1 (as noted on the daily chart).
There is no longer divergence with price and MACD for the final fifth wave. Strength is common for Gold’s fifth waves; this is not always seen, but Gold often exhibits blow off tops at all time frames. The overshoot of the upper edge of the channel looks fairly typical for a final fifth wave, but it also looks typical for the middle of a third wave. For this reason, while price remains within the channel, it must still be accepted that it is possible that it could continue yet higher.
Within intermediate wave (1), Fibonacci ratios are: minor wave 3 is 3.85 short of 6.854 the length of minor wave 1, and minor wave 5 is just 0.56 short of 0.618 the length of minor wave 3.
Ratios within minor wave 3 are: there is no Fibonacci ratio between minute waves i and iii, and minute wave v is 2.88 longer than equality with minute wave iii.
Indication of a trend change would be a breach of the lower edge of the gold channel. That would provide reasonable confidence in a trend change.
A new low below 1,183.15 would provide price confidence in a trend change. At that stage, downwards movement could not be a second wave correction within a final fifth wave of minute wave v, so minute wave v would have to be over.
If labelling on this hourly wave count is correct, then minute wave ii may not move beyond the start of minute wave i above 1,206.35. A new high on Monday or Tuesday next week would indicate intermediate wave (1) is continuing.
So far there may be a first wave down complete followed by an incomplete expanded flat correction for a second wave. Along the way down, the lower edge of the gold channel may provide support. How price behaves when it gets there will add information as to whether or not intermediate wave (1) is over. If price slices quickly through the trend line, then the probability of a trend change will be high. But if price hesitates and then bounces up from the trend line, the probability that intermediate wave (1) is not over will be reasonable.
If the trend line is breached quickly, then look for a throwback to find resistance at the trend line. If price behaves like that, it would offer a good set up for a short position to trade some of intermediate wave (2) downwards. At that stage, price would have provided some confirmation of a trend change and the trend channel breach would have added reasonable confidence.
If members choose to trade this correction downwards after some confirmation / confidence in a trend change, then always follow these two risk management rules:
1. Always use a stop loss. Trading without a stop exposes the entirety of your equity to risk. This is how novices wipe out their accounts at least once.
2. Invest no more than 1-5% of equity on any one trade. Risking more of your equity indicates trading decisions based upon greed, which is to be avoided. Most of trading is management of psychology and risk.
ALTERNATE HOURLY CHART
Click chart to enlarge.
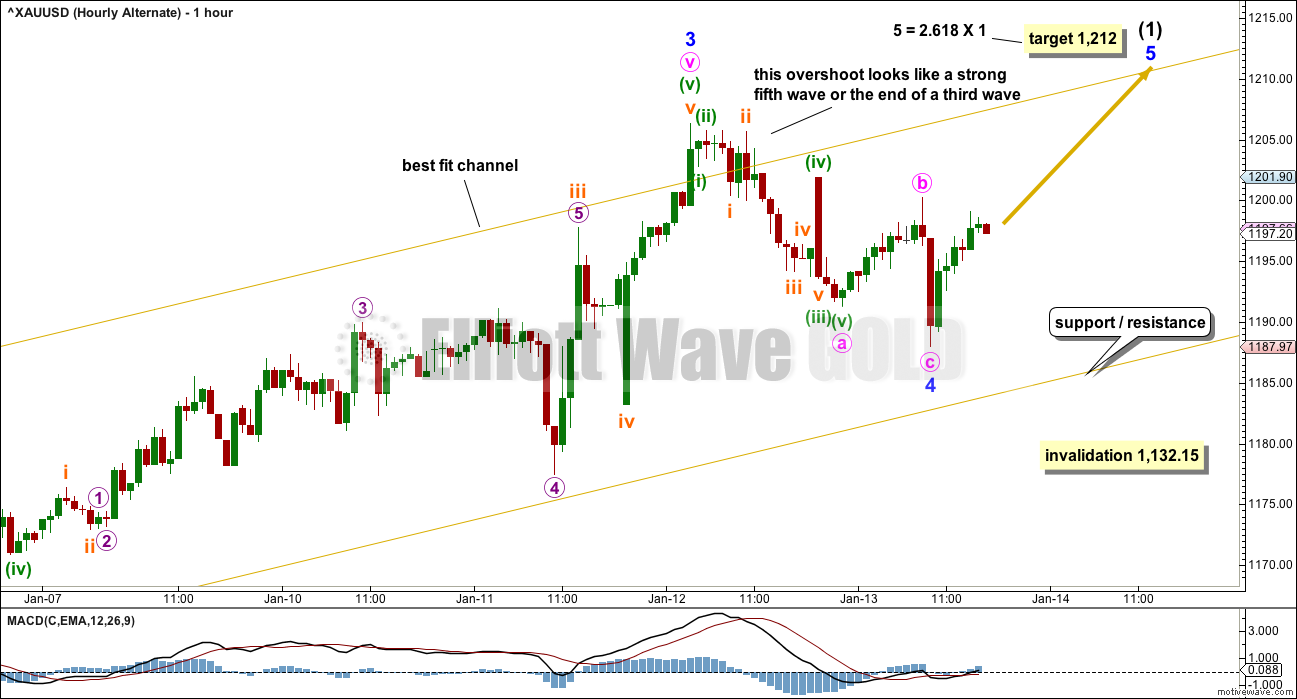
What if intermediate wave (1) is not over? Would that fit, does it look better or worse, and is there a difference in Fibonacci ratios?
Minor wave 1 is seen in the same place for both wave counts, as noted on the daily chart.
Here, minor wave 3 may have been the strong overshoot of the upper edge of the channel. This looks possible.
There is no longer a Fibonacci ratio between minor waves 3 and 1.
Ratios within minor wave 3 are: there is no Fibonacci ratio between minute waves i and iii, and minute wave v is 3.44 longer than 1.618 the length of minute wave iii.
Fibonacci ratios are slightly better for the main hourly wave count.
ALTERNATE ELLIOTT WAVE COUNT
DAILY CHART
Click chart to enlarge.
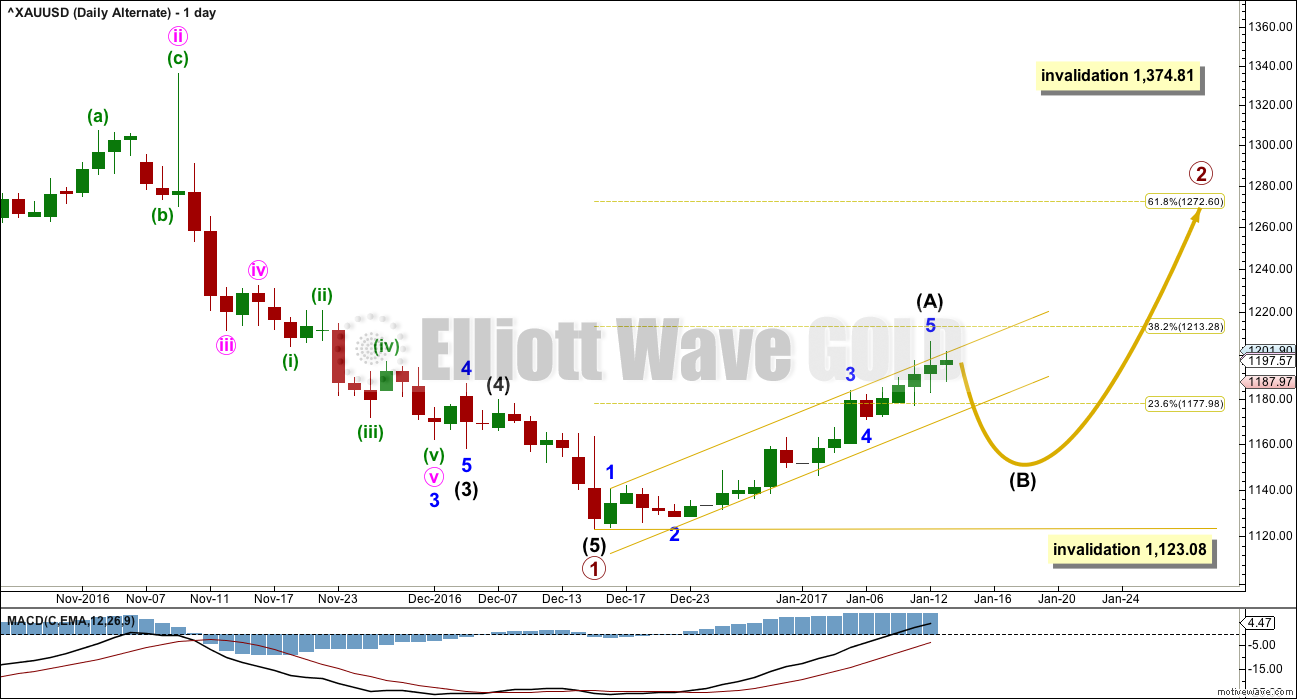
This alternate wave count expects that Gold is still within a bear market. Targets for new lows can be seen on weekly and monthly charts.
Within the bear market, a primary degree correction is underway.
Primary wave 2 is most likely to subdivide as a zigzag. So far it looks like a five up is either complete now or very close to completion. This may be intermediate wave (A). Intermediate wave (A) may now be complete lasting a total Fibonacci 21 sessions.
It is also possible to move the degree of labelling all down one degree within upwards movement for intermediate wave (A). It is possible that only minor wave 1 within intermediate wave (A) is complete. Either way the invalidation point remains the same. If a five up is complete, then the following three down may not move beyond its start below 1,123.08.
Primary wave 2 may not move beyond the start of primary wave 1 above 1,374.81.
TECHNICAL ANALYSIS
WEEKLY CHART
Click chart to enlarge. Chart courtesy of StockCharts.com.
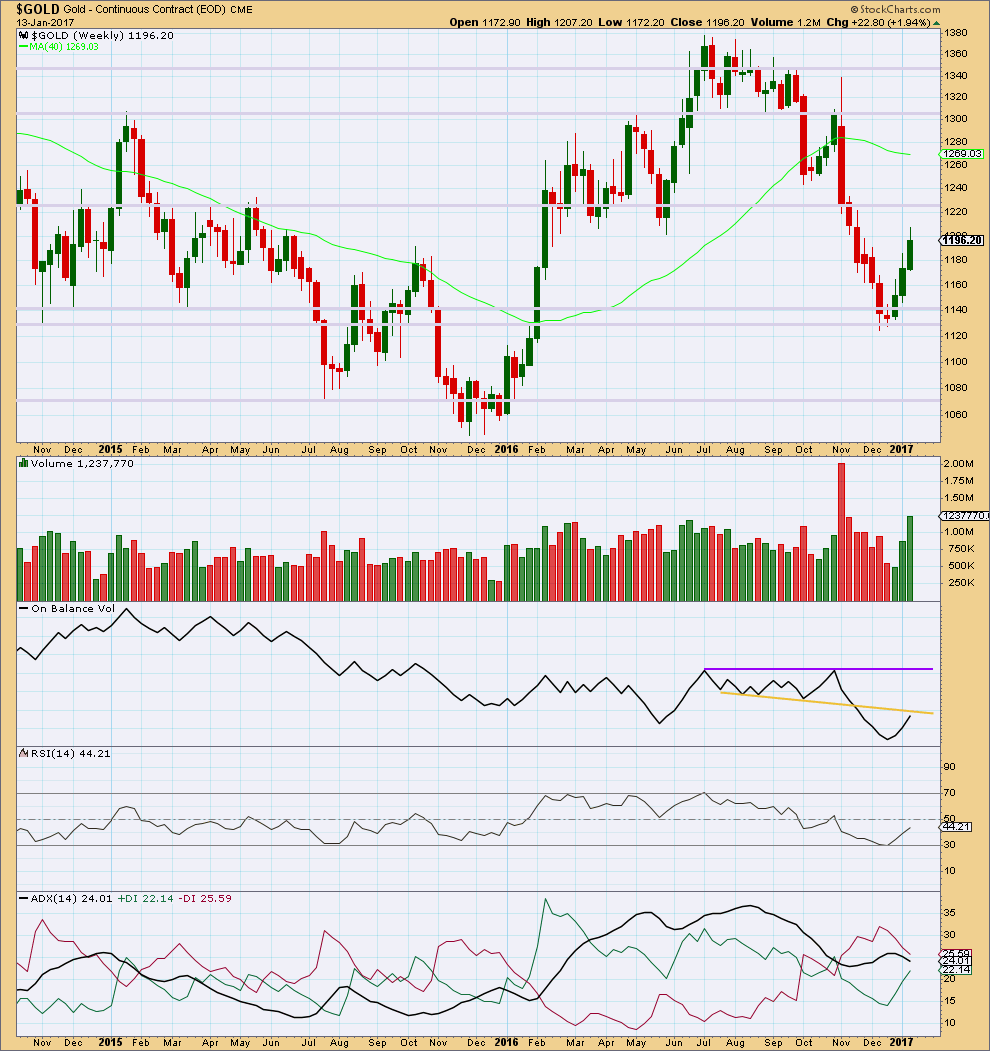
Gold has moved higher for three weeks in a row on increasing volume. The rise in price is well supported by volume. This upwards movement looks healthy.
A Morning Star candlestick pattern at the last low indicates a possible trend change there.
Next resistance is about 1,225.
On Balance Volume may provide resistance before that price point is reached though. It is coming up to almost touch the yellow trend line that previously provided support. However, there is some leeway in exactly how this line may be drawn, so it is not possible to tell with accuracy exactly where resistance is. It may be here or it may be just a little higher.
RSI shows increasing strength to upwards movement.
ADX does not yet indicate a trend change (this is a lagging indicator). The black ADX line is declining, indicating only a consolidation. The -DX line remains above the +DX line. No trend change is yet indicated at this time frame.
DAILY CHART
Click chart to enlarge. Chart courtesy of StockCharts.com.
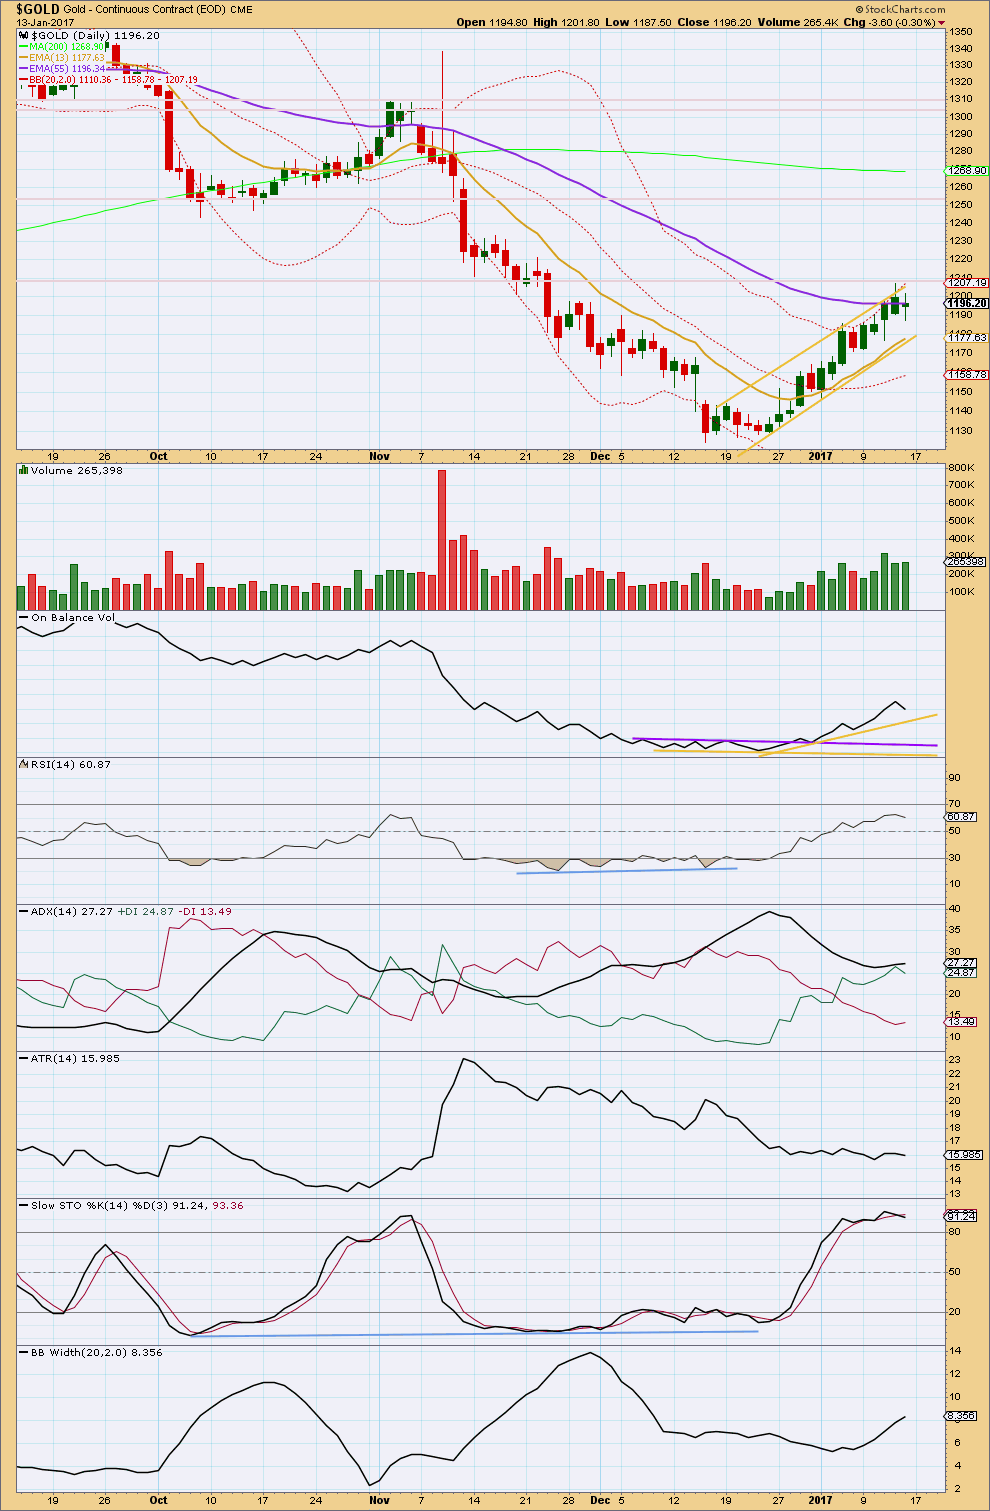
At this stage, it looks like price may have found resistance at about 1,210. The long upper wick for Thursday’s candlestick, and now a spinning top for Friday, looks slightly bearish followed by corrective movement.
The balance of volume for Friday was down and it showed a slight increase. Although the candlestick closed green, this is read as support for downwards movement within the session. Price made a lower high and a lower low for Friday and this is the definition of downwards movement.
There is some distance before On Balance Volume may find support.
ADX indicates still that an upwards trend is in place with the black ADX line again increasing today. The +DX line is above the -DX line, but both are below the black ADX line. This trend is now entering extreme territory. There is still room for it to run though because ADX is not yet at 35.
ATR remains flat indicating some weakness within this trend. This is normal for either a consolidation or the early stages of Gold’s new trends.
Stochastics is overbought, but this oscillator may remain extreme for reasonable periods of time during a trending market. No divergence is seen between price and Stochastics, nor between price and RSI, to indicate weakness at the last high.
Bollinger Bands continue to widen, which is normal for a healthy trend. They are not yet extreme, so there is room for the trend to continue.
The bottom line still remains that it is entirely possible price may continue higher while it is within the channel. This trend will see a pullback which should be expected to be deep, but it is not yet indicated that this has arrived.
GDX DAILY CHART
Click chart to enlarge. Chart courtesy of StockCharts.com.
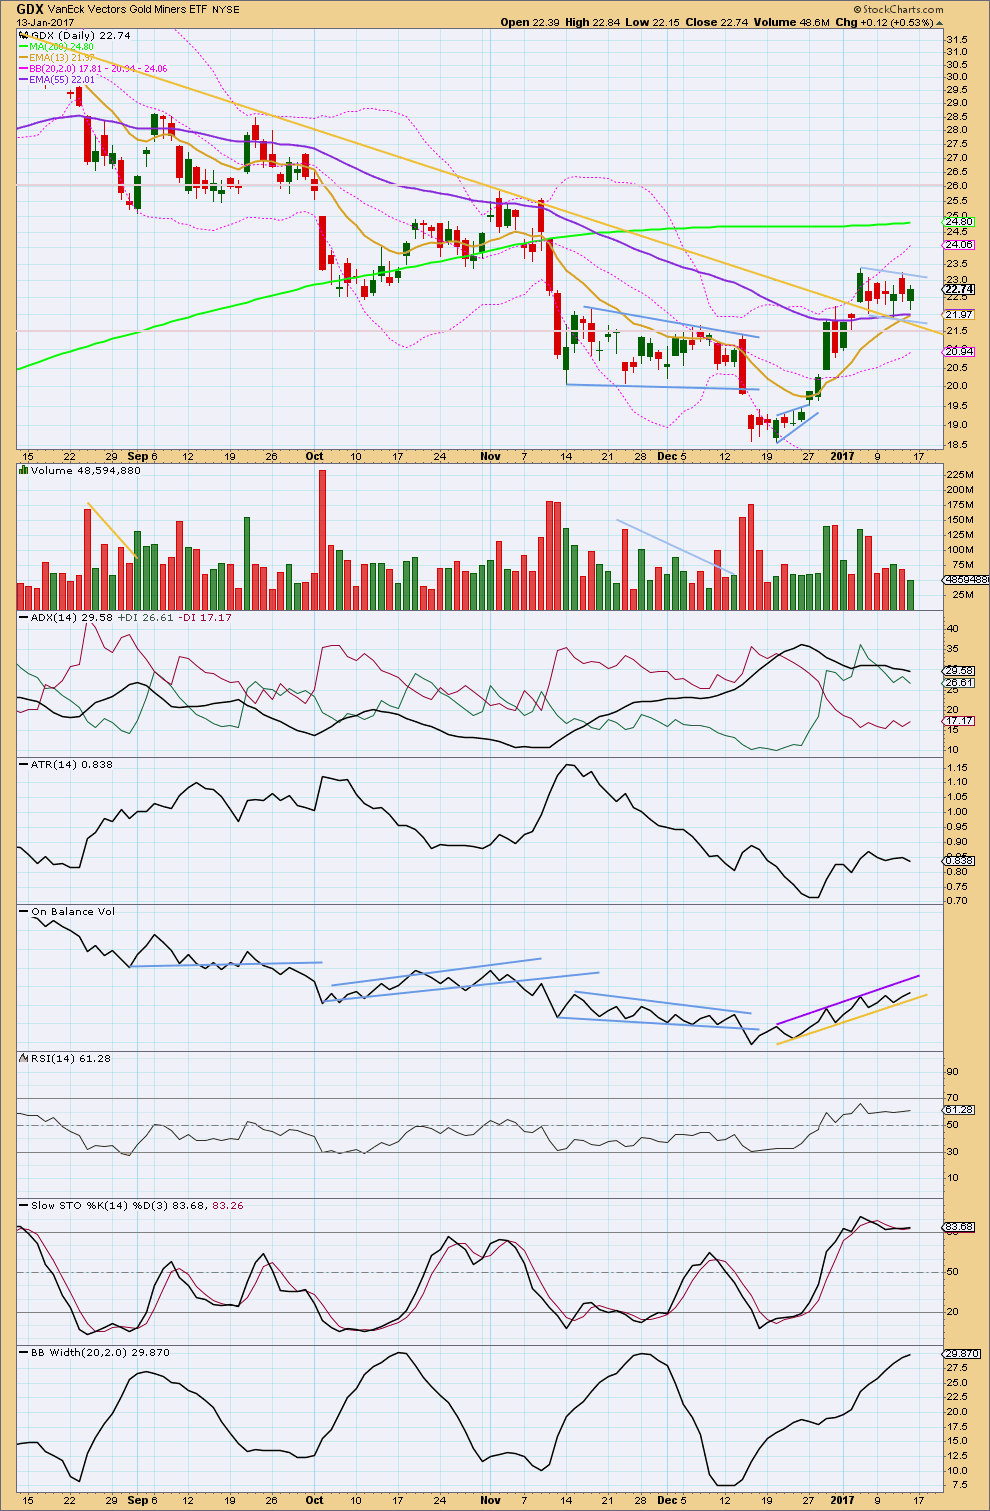
GDX has been consolidating now for six days. A small bull flag pattern may be completing. The lower edge of the flag may find support at the gold trend line.
The target using the measured rule for the flag pattern would be about 27.85.
A breakout above the upper edge of the flag pattern is required for indication that the next movement upwards has begun, and this should come with an increase in volume. Until that happens the flag pattern may continue sideways.
The balance of volume for Friday’s session was upwards and it showed a decline. The rise in price was not supported by volume. This session looks like part of the flag pattern and not the beginning of a breakout.
ADX is declining, indicating the market is trending. The pattern may be needed to continue sideways / lower to bring the ADX line back down from above both the directional lines.
ATR is now flat as price moves sideways, typical of a correction.
On Balance Volume found support today at the yellow trend line. A breakout by OBV may indicate the next movement for price.
Stochastics is still overbought, but this may remain extreme for reasonable periods of time during a trending market.
Bollinger Bands continue to widen as price moves sideways. Some contraction now may be expected as BBs are nearing extreme. This may indicate that the correction may continue for longer.
This analysis is published @ 05:51 p.m. EST.
Charts moving again. Looks like trading halted for a few hours. I expect Gold will probably hit its 1212 minor 5 target overnight.
I think that target is now too low Verne. I’m adjusting it up to 1,219, and if that’s wrong it may be still too low.
Has trading in Gold and Silver been halted on global markets? I know we had a market holiday in the US but the metals were trading earlier and have now flat-lined.
The alternate hourly count has been confirmed, the main hourly count invalidated.
Intermediate (1) is continuing. It may not exhibit a Fibonacci duration. Although, one day more than 21 would still be very close to a Fibonacci 21.
It is again possible that it is over today, a five up may be complete. But it doesn’t look like that’s the case, if it’s over I’d expect a quick reversal and that’s not happening.
The target remains the same. If it’s wrong it will be too low. The invalidation point can be pulled up.
At 1207 gold now shows bearish (negative) divergence for MACD.
Yes alt hourly count is now in play.
Alan- how long is the this correction to last in fin days? In previous posts Lara wrote it may last 21 or 34 days.
Papudi, I think we are still in Intermediate 1. If you mean the correction for Intermediate 2, it hasn’t even started yet. As it is going to be rather deep, Lara’s time estimate may be correct. Intermediate 1 began on Dec 15, and it is still ongoing after 1 month.
Folks. This post from Sid Norris of EW Predictions may be good background information on his expected gold movements in the future based on Hurst Cycle Analysis.
https://elliottwaveplus.com/whats-up-with-gold/
But do take care as his long term predictions are quite often inaccurate. But then again, it is very difficult to project that far. So, a vague idea is better than nothing.
Dreamer. I came across the GDX prediction from Sid Norris. You may wish to check his count against yours:
https://elliottwaveplus.com/gold-update-january-11-2017/
I have extracted a graphic, displayed below.
Alan, thanks for sharing. I always like to learn from other counts. I see similarities and some differences with his count and the count that I have been posting. The main takeaway is that we both see new highs coming for Gold and GDX over the next several months.
He vas early in concluding a complete Weave up on January 5.
Agreed. That had been my bane too. Sid had very often “compressed” his time scales.
Price has rallied above 1206.35, invalidating the Main Count. It indicates that Intermediate 1 is continuing in its Minor 5 wave, the idea behind the Alternate Hourly.
It has finished Minute 3 at 1207.34. One down and a final up would complete Minor 5.
Hi, I would like to know if the 2 big bars on the hourly chart (encircled in blue) are actual bars. On my platform they don’t exist and I checked another platform and some online charts and also there I can’t see the two large body candles.
Yes, they are actual bars on BarChart data.
Gold is a global market and so you will see differences in different data feeds from time to time. Not all feeds will be exactly the same.
On Pmbull.com I do not see these two bars circled in blue on one hour period.
Lara is correct for the differences in data feed.
Not looking for comment it is just the info.
Thx.
Yes. They are actual bars, and are unique in BarChart. I had posted about them when they appeared. They are disconcerting because they throw a seemingly good wave count off balance from what had been a natural count, thereby necessitating a recount. But, it is for the better as they alert us to a “new” count which other datafeeds wouldn’t be able to indicate.
GDX update. I added the “Flag” trend lines that Lara pointed out. FLAT idea for Intermediate wave 2 is still looking good and fits well with the “Flag”.
Eli,
Thanks for the comments on yesterdays post. The one thing I have learned, is that there are always multiple options for the EW count. That said, I post what I think is the most probable count. If the count is very unclear, I will sometimes show another possibility on the same chart.
For now, I think the idea that we are in Intermediate wave 2 and that a Flat correction is in progress is most likely. I added the “Flag” trend lines that Lara pointed out to my chart today. The “Flag” fits well with the FLAT correction.
The move up from the bottom was 10 days. This correction is now on day 6. If it completes in another 2 days, that will have a good look for Intermediate wave 2 vs wave 1. I think this correction is becoming too long to be a lower level triangle for a wave 4. A combination is still possible, but for now the flat is looking good.
So overall, I am very bullish as you are, but short term, I think GDX will make a new low below 21.91 to complete the FLAT before starting a strong move up for Intermediate wave 3. Good trading!
Thanks Dreamer. Yes I agree, no matter how you draw the first and second wave here, indeed a triangle for a fourth wave would look wrong. The other option (for immediate upwards movement) is we are in a wave 3 up now after a quick and shallow zig zag for a wave 2.
I think we’ll see after the fact how the count shapes up. I still do think upwards movement from here, especially with gold action over the holiday which established a move above 1200 and confirmed the bullish tape. Of course, that can also fail by tomorrow morning. We’ll see!
Dreamer thank you very much for your continued work on an Elliott wave count for GDX. Your charts are much appreciated I am sure by many members and myself.
Agreed! Dreamer, thank you as well for your charts and analysis as well. -Dan