Upwards movement invalidated the main hourly Elliott wave count and confirmed the alternate. The target is now adjusted.
Summary: The new target for upwards movement to end is 1,219. In the short term, a new low below 1,187.97 would indicate a trend change and a breach of the gold channel would confirm it.
New updates to this analysis are in bold.
Last monthly and weekly charts are here. Last historic analysis video is here.
Grand SuperCycle analysis is here.
MAIN ELLIOTT WAVE COUNT
DAILY CHART
This main wave count has a better fit for prior movement. To see the difference between this main wave count and the alternate below please refer to last historic analysis linked to above.
This main wave count expects Gold has had a primary degree trend change in December 2016. The new upwards wave is either a primary degree third wave, or a primary degree zigzag to complete a double zigzag.
Intermediate wave (1) is still not over and may not exhibit a Fibonacci duration. So far price remains within the gold channel. A breach of the gold channel on the daily chart would provide strong indication of a trend change.
The first in a series of second wave corrections for Gold’s new impulses is usually very deep. Intermediate wave (2) is expected to be at least 0.618 the depth of intermediate wave (1), and very likely may be deeper. It may not move beyond the start of intermediate wave (1) below 1,123.08.
The upcoming correction for intermediate wave (2) should present an opportunity to join a new trend.
Intermediate wave (2) may be at least as long in duration as intermediate wave (1), and fairly likely it may be longer. A Fibonacci 21 or 34 sessions will be the expectation. Corrections are often more time consuming than impulses.
HOURLY CHART
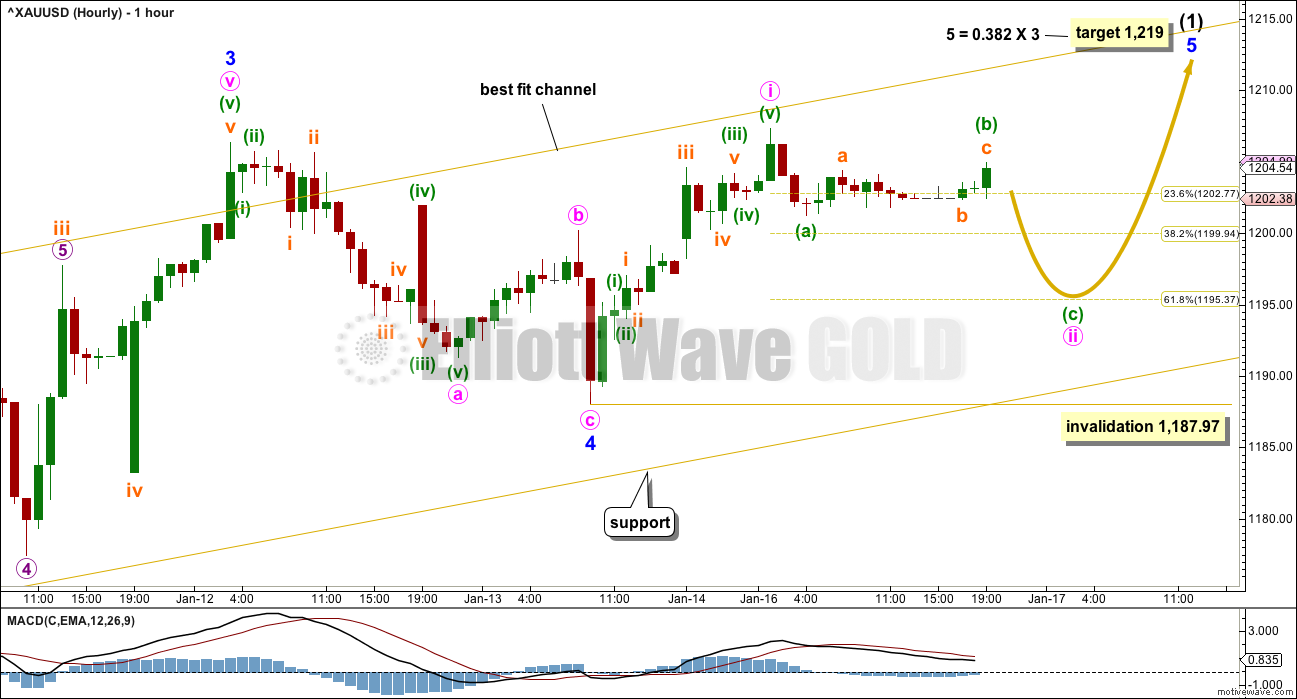
No confirmation nor indication of a trend change has yet been seen. The structure of intermediate wave (1) may still be incomplete.
A first five up for minute wave i may be complete within minor wave 5. This is reasonably close to the last published target for this wave count at 1,212, but minor wave 5 needs more room now to complete a five wave impulsive structure. The target is recalculated for this reason.
Within minor wave 5, the correction for minute wave ii looks incomplete. Minute wave ii may not move beyond the start of minute wave i below 1,187.97.
This wave count should be preferred while price remains within the channel and above 1,187.97.
ALTERNATE HOURLY CHART
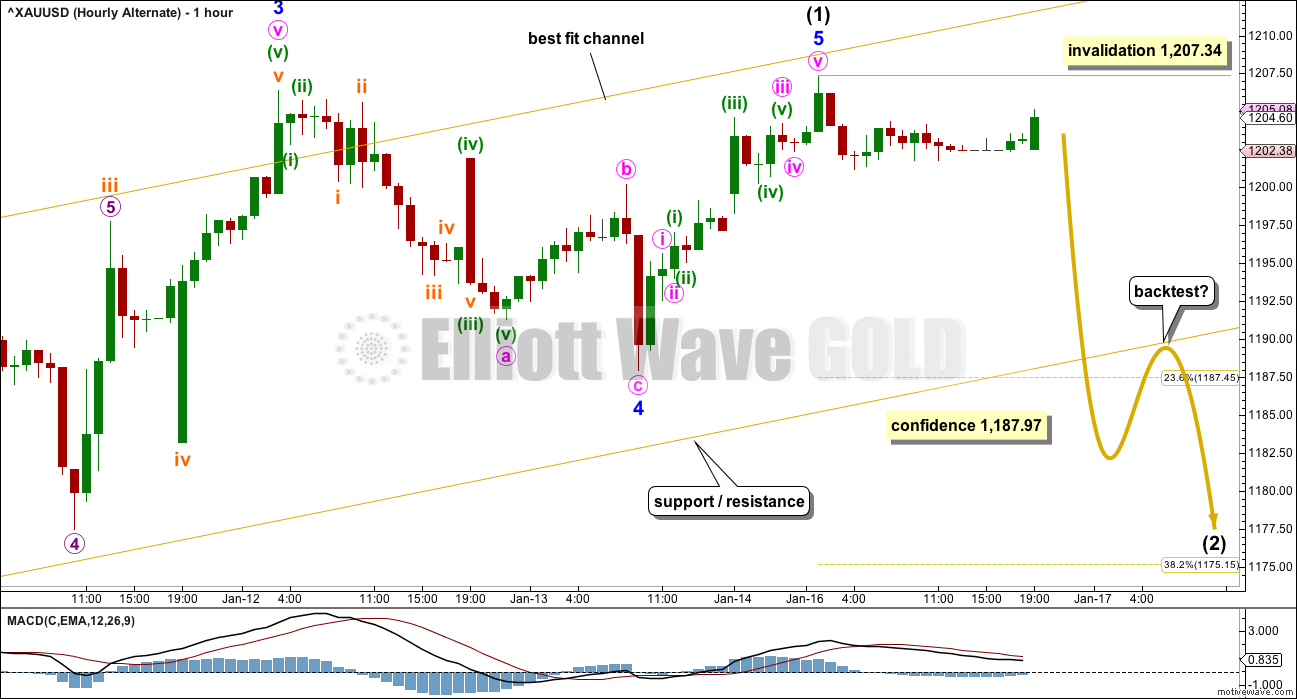
By simply moving the degree of labelling within minor wave 5 all up one degree, it is possible again that intermediate wave (1) is complete.
Within intermediate wave (2), no second wave correction may move beyond the start of its first wave above 1,207.34.
A new low below 1,187.97 would add confidence to this wave count.
If price moves lower to the lower edge of the gold channel, then watch it carefully. If price slices through this trend line, then this wave count will substantially increase in probability.
If price slices through the channel, then look for a bounce to test resistance at the under side of the channel. If price behaves like that, it would offer an opportunity for a short term short position.
Alternatively, if price hesitates and bounces up from the lower trend line, it may offer an opportunity for a short term long position.
ALTERNATE ELLIOTT WAVE COUNT
DAILY CHART
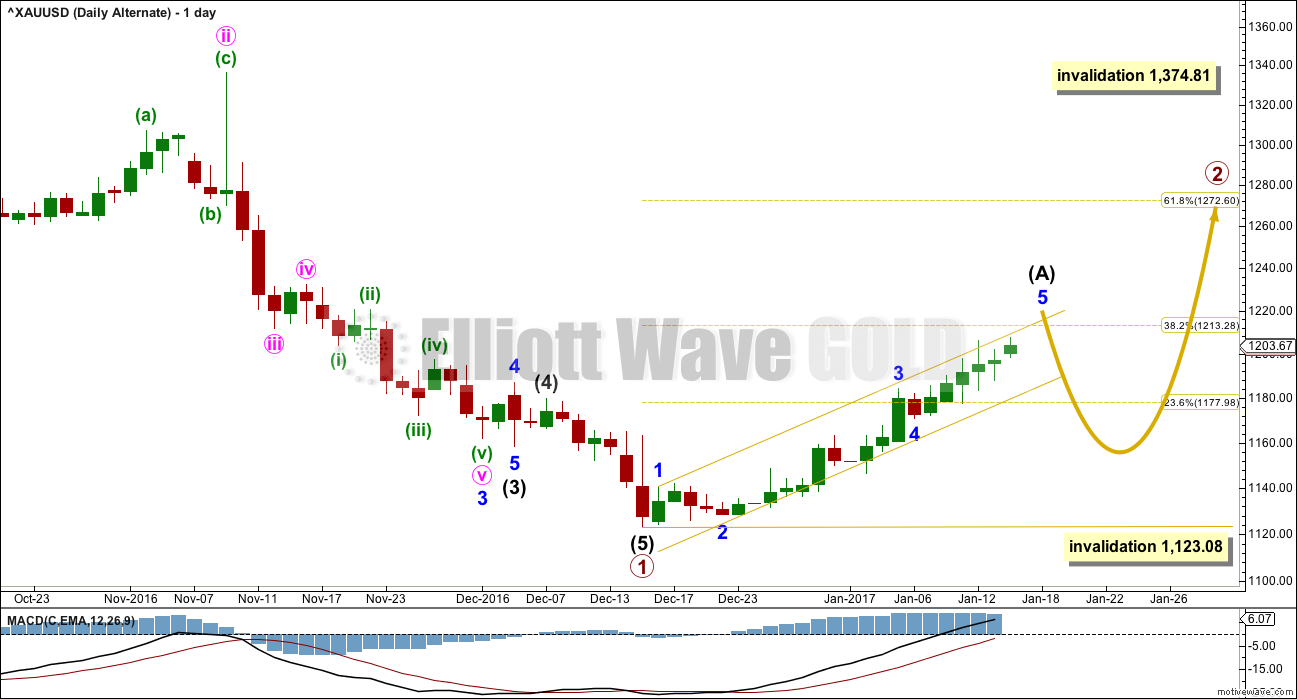
This alternate wave count expects that Gold is still within a bear market. Targets for new lows can be seen on weekly and monthly charts.
Within the bear market, a primary degree correction is underway.
Primary wave 2 is most likely to subdivide as a zigzag. So far it looks like a five up is either complete now or very close to completion. This may be intermediate wave (A). Intermediate wave (A) may now be complete lasting a total Fibonacci 21 sessions.
It is also possible to move the degree of labelling all down one degree within upwards movement for intermediate wave (A). It is possible that only minor wave 1 within intermediate wave (A) is complete. Either way the invalidation point remains the same. If a five up is complete, then the following three down may not move beyond its start below 1,123.08.
Primary wave 2 may not move beyond the start of primary wave 1 above 1,374.81.
TECHNICAL ANALYSIS
WEEKLY CHART
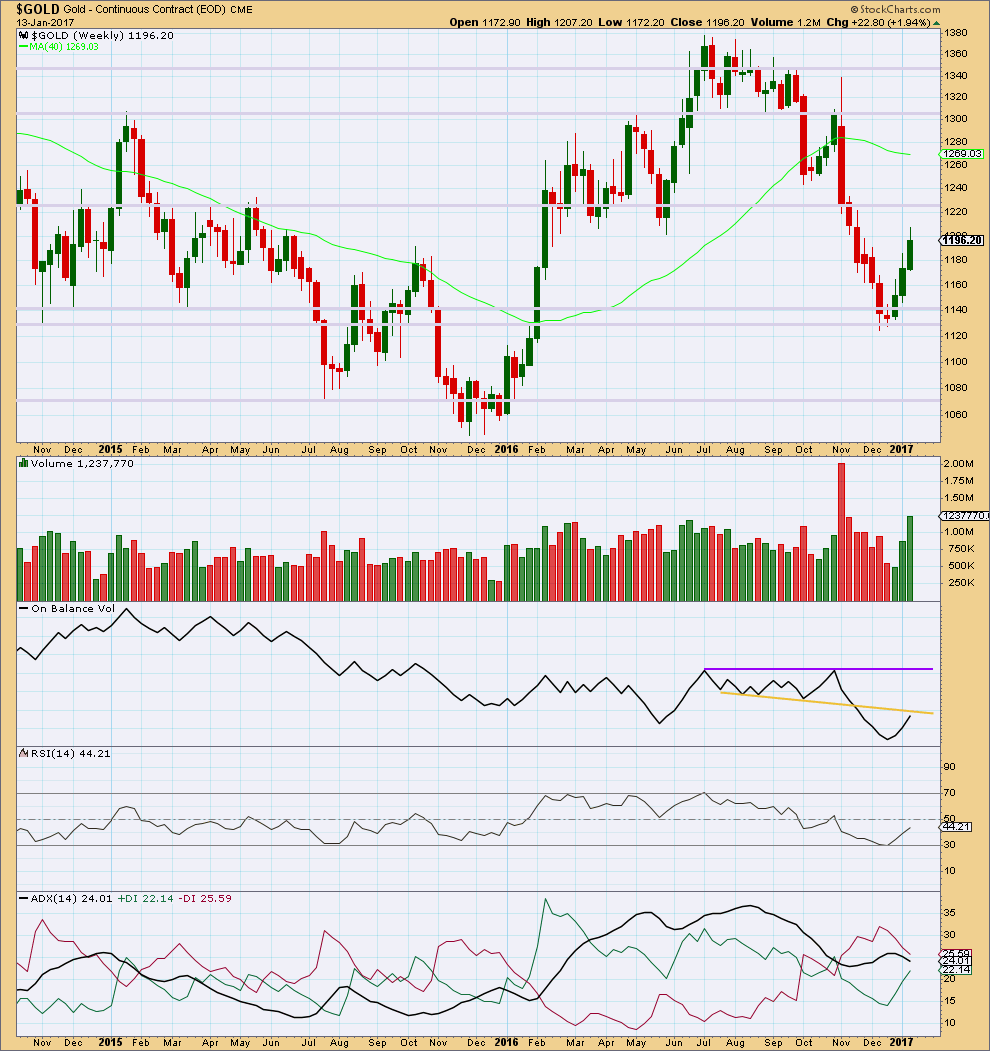
Click chart to enlarge. Chart courtesy of StockCharts.com.
Gold has moved higher for three weeks in a row on increasing volume. The rise in price is well supported by volume. This upwards movement looks healthy.
A Morning Star candlestick pattern at the last low indicates a possible trend change there.
Next resistance is about 1,225.
On Balance Volume may provide resistance before that price point is reached though. It is coming up to almost touch the yellow trend line that previously provided support. However, there is some leeway in exactly how this line may be drawn, so it is not possible to tell with accuracy exactly where resistance is. It may be here or it may be just a little higher.
RSI shows increasing strength to upwards movement.
ADX does not yet indicate a trend change (this is a lagging indicator). The black ADX line is declining, indicating only a consolidation. The -DX line remains above the +DX line. No trend change is yet indicated at this time frame.
DAILY CHART
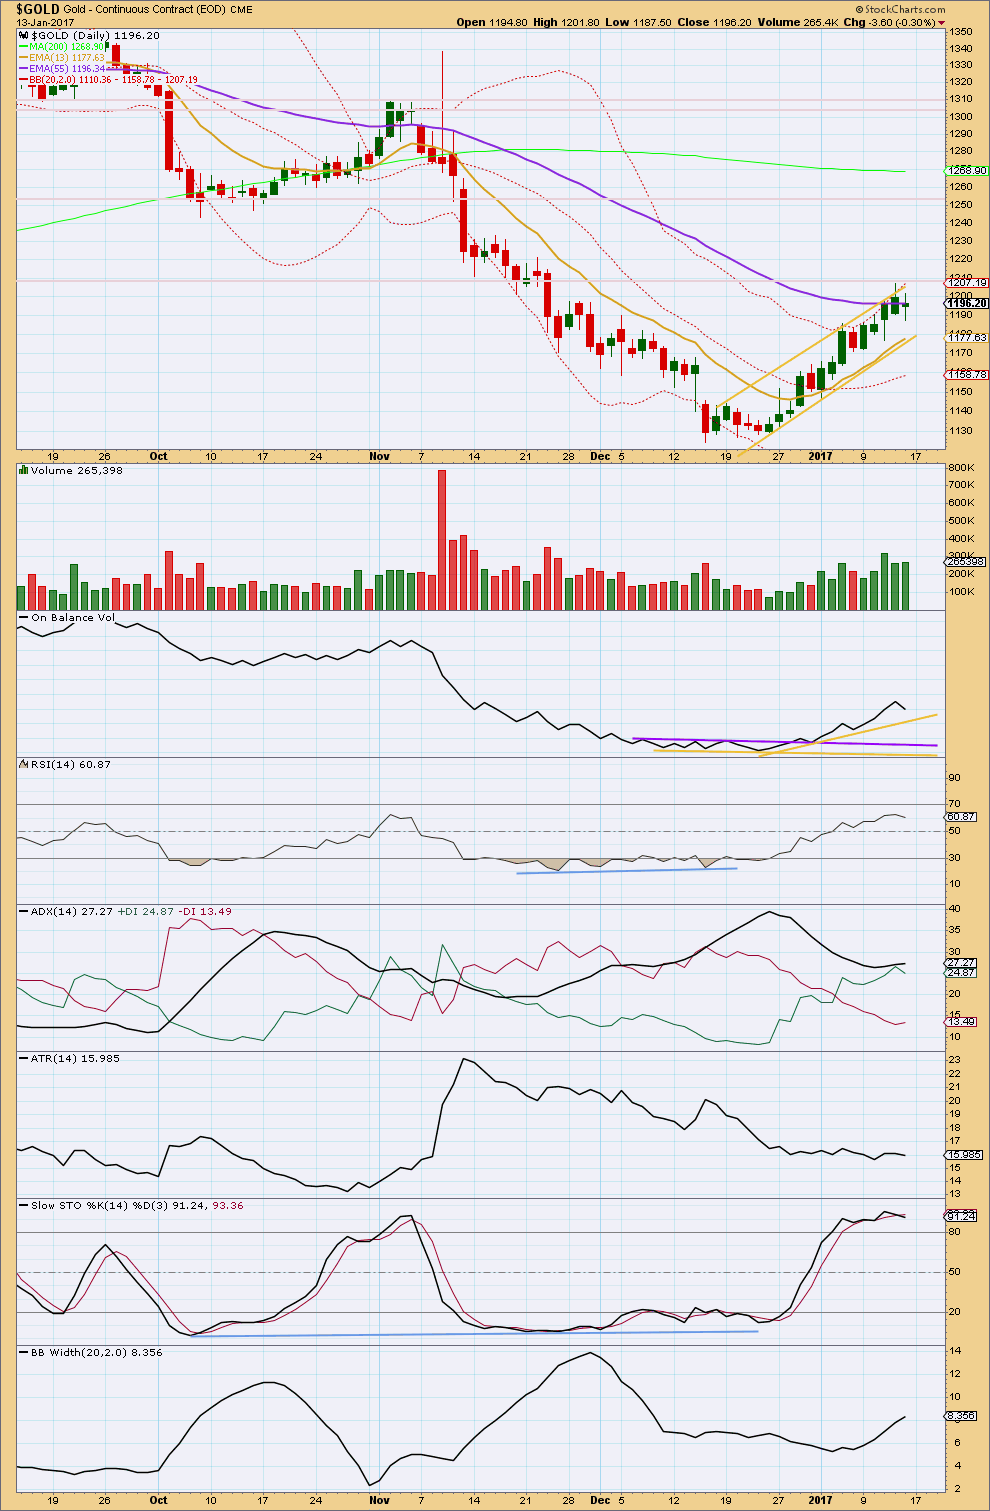
Click chart to enlarge. Chart courtesy of StockCharts.com.
Stock charts Gold data is NY session only. NY is closed for a public holiday on Monday and there is no new data to analyse. This section remains the same.
At this stage, it looks like price may have found resistance at about 1,210. The long upper wick for Thursday’s candlestick, and now a spinning top for Friday, looks slightly bearish followed by corrective movement.
The balance of volume for Friday was down and it showed a slight increase. Although the candlestick closed green, this is read as support for downwards movement within the session. Price made a lower high and a lower low for Friday and this is the definition of downwards movement.
There is some distance before On Balance Volume may find support.
ADX indicates still that an upwards trend is in place with the black ADX line again increasing today. The +DX line is above the -DX line, but both are below the black ADX line. This trend is now entering extreme territory. There is still room for it to run though because ADX is not yet at 35.
ATR remains flat indicating some weakness within this trend. This is normal for either a consolidation or the early stages of Gold’s new trends.
Stochastics is overbought, but this oscillator may remain extreme for reasonable periods of time during a trending market. No divergence is seen between price and Stochastics, nor between price and RSI, to indicate weakness at the last high.
Bollinger Bands continue to widen, which is normal for a healthy trend. They are not yet extreme, so there is room for the trend to continue.
The bottom line still remains that it is entirely possible price may continue higher while it is within the channel. This trend will see a pullback which should be expected to be deep, but it is not yet indicated that this has arrived.
GDX DAILY CHART
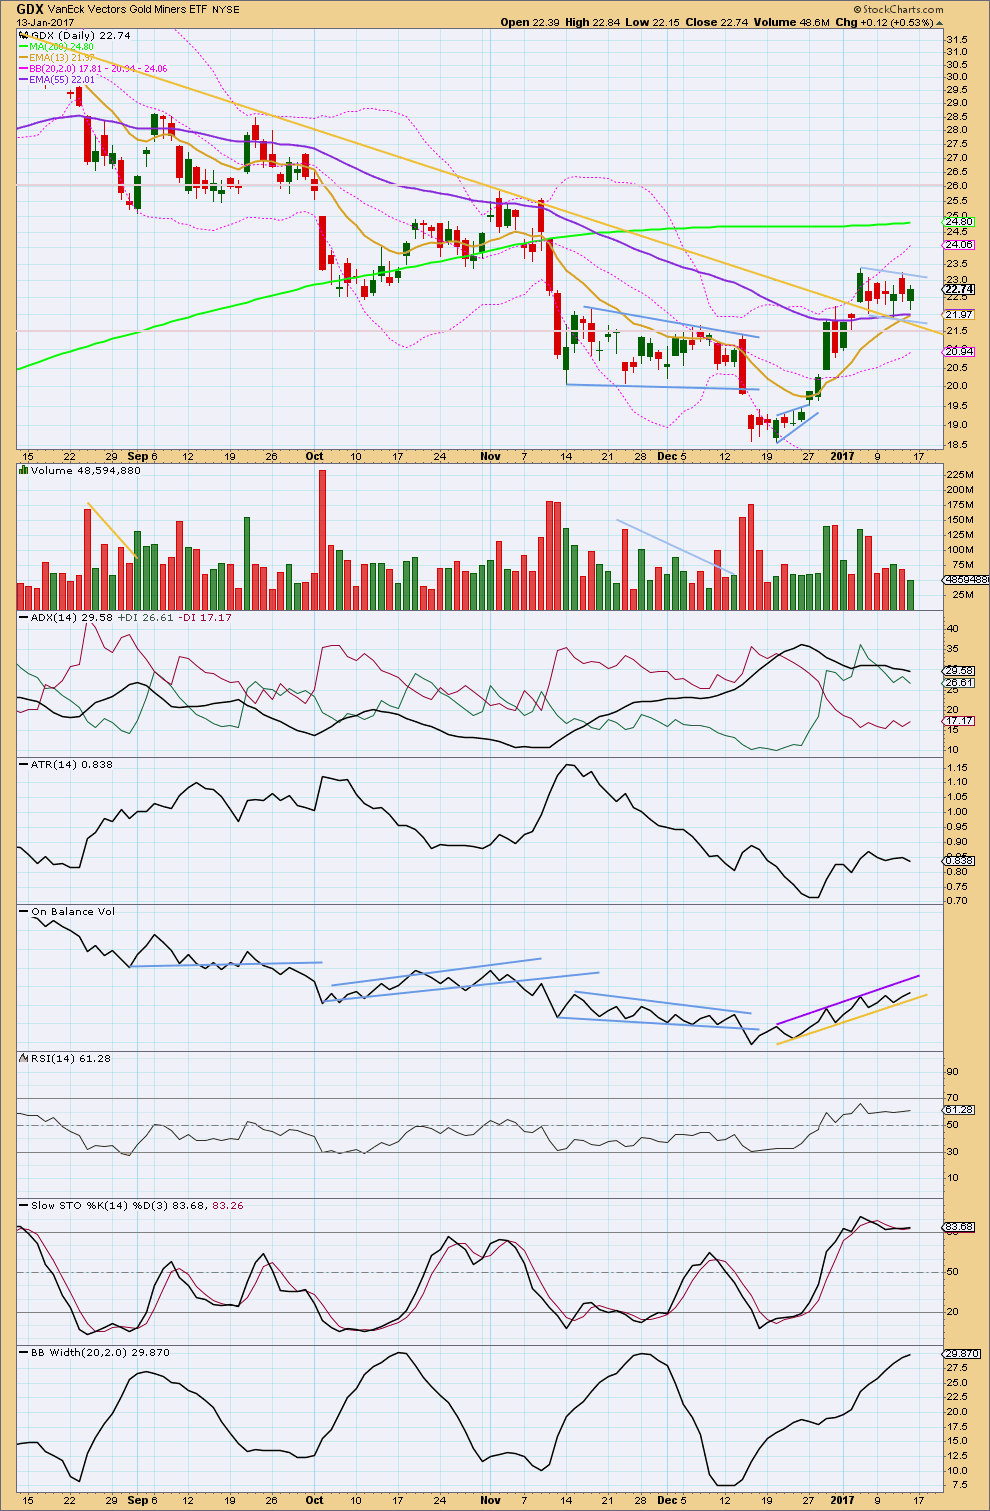
Click chart to enlarge. Chart courtesy of StockCharts.com.
Stock charts GDX data is NY session only. NY is closed for a public holiday on Monday and there is no new data to analyse. This section remains the same.
GDX has been consolidating now for six days. A small bull flag pattern may be completing. The lower edge of the flag may find support at the gold trend line.
The target using the measured rule for the flag pattern would be about 27.85.
A breakout above the upper edge of the flag pattern is required for indication that the next movement upwards has begun, and this should come with an increase in volume. Until that happens the flag pattern may continue sideways.
The balance of volume for Friday’s session was upwards and it showed a decline. The rise in price was not supported by volume. This session looks like part of the flag pattern and not the beginning of a breakout.
ADX is declining, indicating the market is trending. The pattern may be needed to continue sideways / lower to bring the ADX line back down from above both the directional lines.
ATR is now flat as price moves sideways, typical of a correction.
On Balance Volume found support today at the yellow trend line. A breakout by OBV may indicate the next movement for price.
Stochastics is still overbought, but this may remain extreme for reasonable periods of time during a trending market.
Bollinger Bands continue to widen as price moves sideways. Some contraction now may be expected as BBs are nearing extreme. This may indicate that the correction may continue for longer.
This analysis is published @ 08:22 p.m. EST.

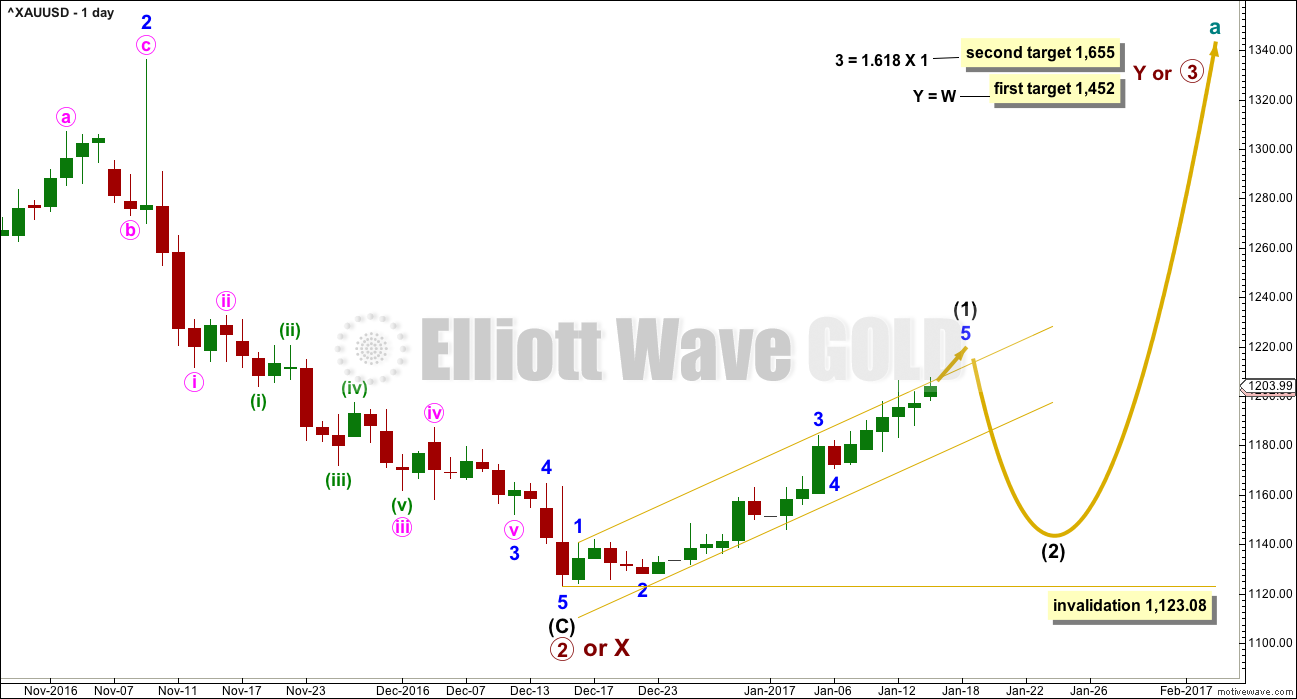
My money’s on a short burst to 1219 as both the US Dollar and USD/JPY corrections are nearing the low of the fourth wave of one lesser degree.
A new target is calculated. If price keeps rising, the next possible target is 1,238
The structure is still incomplete. The bottom line is still that while price remains within the channel and above the invalidation point, expect the upwards trend to continue.
If minute iv is a triangle (and this fits on the five minute chart) then minute v may be surprisingly short, meeting the first target only.
Gold often exhibits surprisingly short fifth waves out of it’s fourth wave triangles.
Hi Lara – Thanks for the intraday update.
If you could, would you be able to put a percentage (probability percentage) on gold reaching 1219 and then turning vs. reaching the 1238 target and then turning?
Also, I’m seeing a correlation between gold and US Stock markets. When the markets turn lower, gold appears to jump. If that’s the case, do you see the US Stock markets declining this week. This could help gold reach the higher target of 1238.
Thanks!
At this stage I’d judge the higher target to have a better probability, maybe about 60% to the lower target 40%.
My wave count for the S&P500 does expect a drop here for a few days actually.
I noticed for some time last year that Gold and the S&P500 were positively correlated. Most of the time they are inversely correlated, as they appear to be right now.
So I have concluded that the inverse correlation is not always in force, it’s not reliable.
SLV has telegraphed the strength of the current bull trend with the summary filling of those two gaps at 15.87 and 16.32. I am now expecting that all remaining gaps will be filled and that pullbacks will be shallower than most expect.
SLV has dutifully filled its open gap from the intra-day low on November 11 at 16.31
Buying the Feb 3 16.50 strike SLV puts @ 0.48 per contract. SLV should move down to at least the 15.50 area for a second wave correction. It could go as low as 15.02
think 4th of final 5th is turning into a triangle ready for a short thrust up to finish
The third upper BB penetration for GLD this month. The persistence in extremes across so many markets unlike anything I have ever seen. Strange times!
PM Sector is in bull trend.
Yesterday silver formed HnS in 1 hour period and broke thru the NL line at 16.91.
Gold has been building HnS on top of each other in 1 hour and 4 hour period.
Now silver is attacking the NL at 17.23 from a longer trading time period in 4 hour period.
Resistance will be at 17.23. A correction to 16.80 will put in the RS.
Silver is leading the way up for gold.
Can some one post 4 hour silver chart from Nov to YT???
That chart clearly shows HnS with NL at 17.23.
Once this level is broken silver is going higher with no resistance to 18.5. IMO.
GDX – looks to gap up. If it sells off soon after the gap up, an expanded Flat is still possible.
Alternate shown in Green if it just keeps going up…
Gold – top may be in, but too early to tell