
Price has moved lower and remains within the channel drawn on both the hourly and daily Elliott wave charts.
Summary: The bottom line is still that it must be accepted there is no indication yet of an end to this upwards wave while Gold remains within the channel and above the confidence point of 1,187.97. However, the situation today is more bearish than recently, so it is more possible for Gold and GDX today that a high is in place.
New updates to this analysis are in bold.
Last monthly and weekly charts are here. Last historic analysis video is here.
Grand SuperCycle analysis is here.
MAIN ELLIOTT WAVE COUNT
DAILY CHART
Click chart to enlarge.
This main wave count has a better fit for prior movement. To see the difference between this main wave count and the alternate below please refer to last historic analysis linked to above.
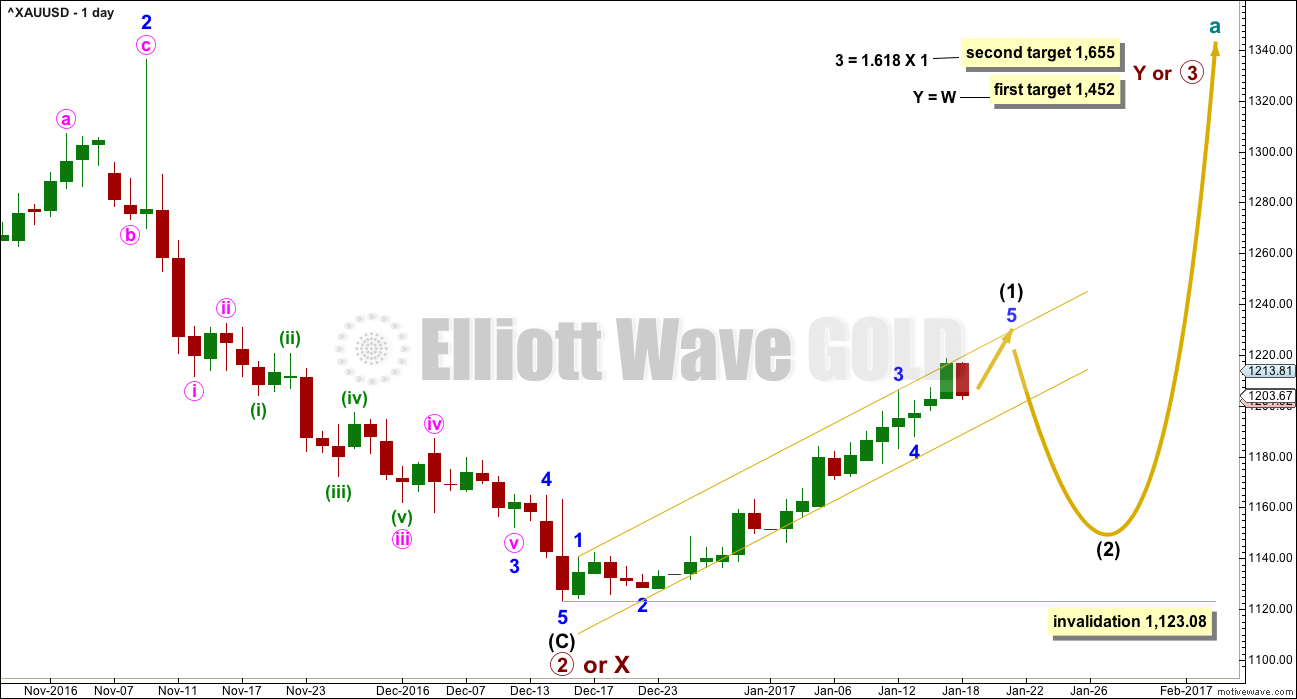
This main wave count expects Gold has had a primary degree trend change in December 2016. The new upwards wave is either a primary degree third wave, or a primary degree zigzag to complete a double zigzag.
Intermediate wave (1) may not exhibit a Fibonacci duration. So far price remains within the gold channel. A breach of the gold channel on the daily chart would provide strong indication of a trend change.
While price remains within the gold channel, then it must be accepted that it is likely to continue higher. A breach of the gold channel would indicate intermediate wave (1) is over and intermediate wave (2) has arrived.
The first in a series of second wave corrections for Gold’s new impulses is usually very deep. Intermediate wave (2) is expected to be at least 0.618 the depth of intermediate wave (1), and very likely may be deeper. It may not move beyond the start of intermediate wave (1) below 1,123.08.
The upcoming correction for intermediate wave (2) should present an opportunity to join a new trend.
Intermediate wave (2) may be at least as long in duration as intermediate wave (1), and fairly likely it may be longer. A Fibonacci 21 or 34 sessions will be the expectation. Corrections are often more time consuming than impulses.
HOURLY CHART
Click chart to enlarge.
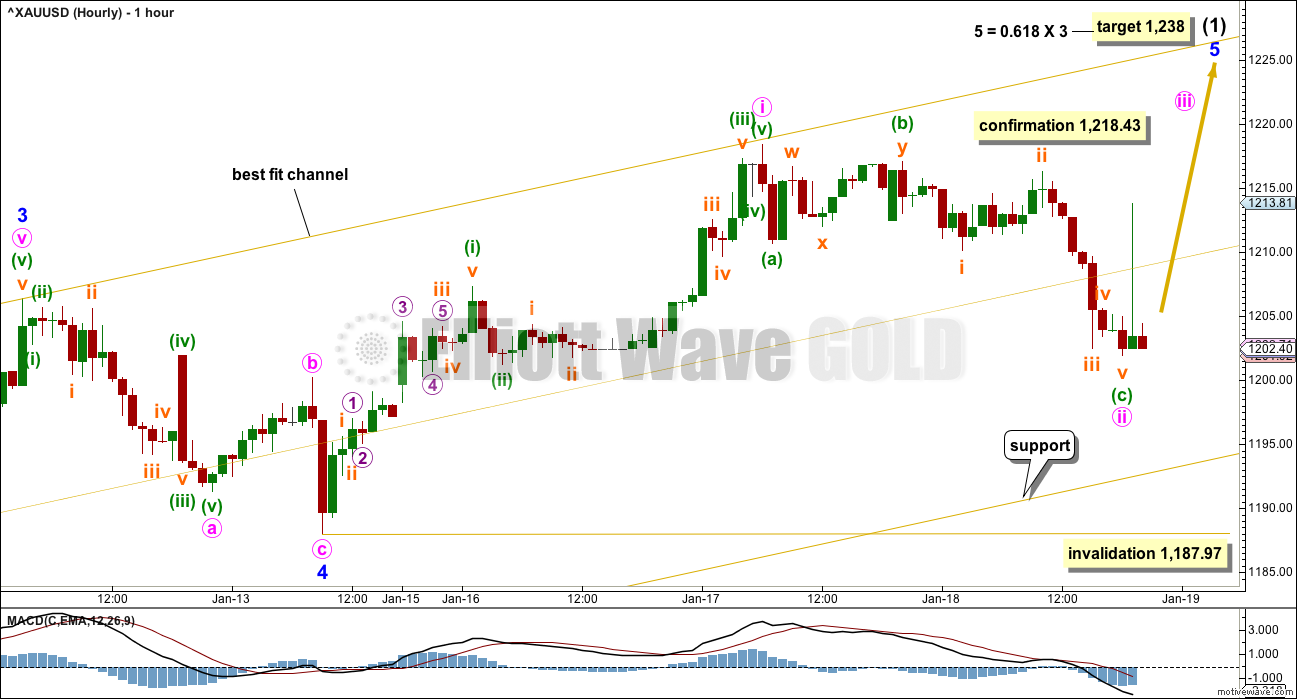
While price remains within the channel, the expectation should be that intermediate wave (1) is incomplete.
Gold commonly exhibits swift strong fifth waves, often ending bull movements in blow off tops. This may happen at the end of minor wave 5.
Within minor wave 5, minute waves i and ii may be complete. If minute wave ii moves lower, it may not move beyond the start of minute wave i below 1,187.97.
ALTERNATE HOURLY CHART
Click chart to enlarge.
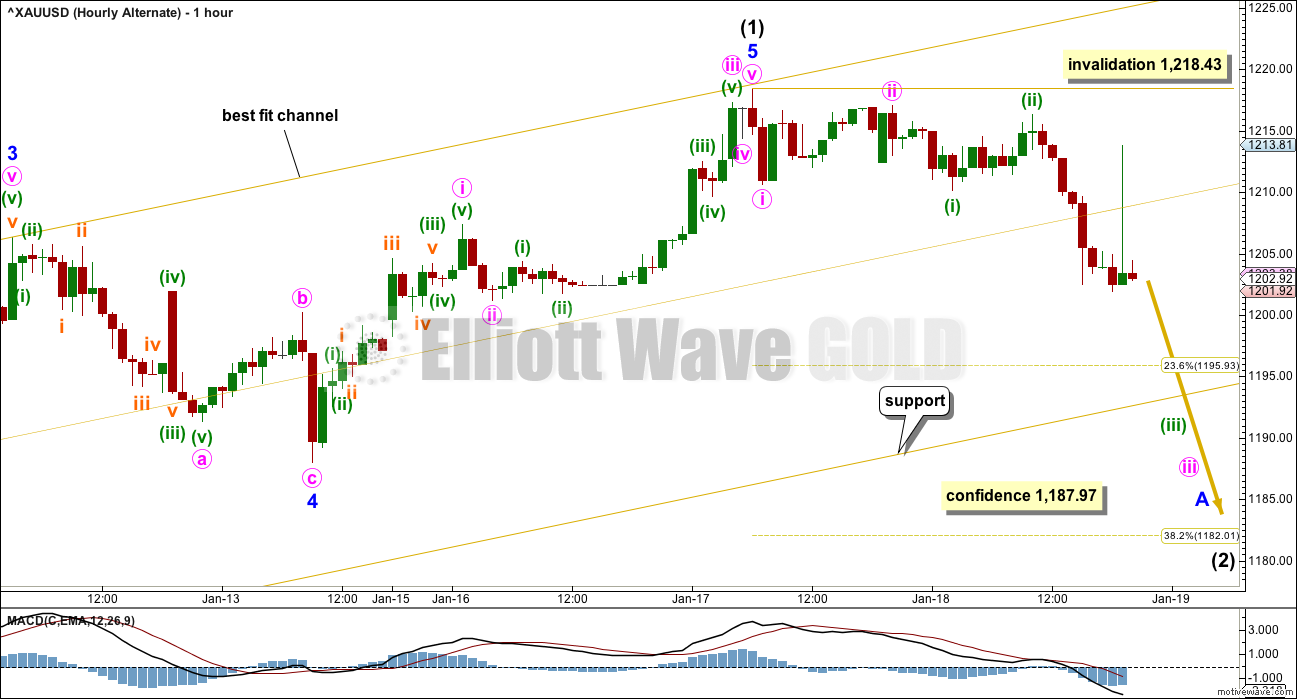
This alternate wave count simply moves the degree of minor wave 5 up one degree. It is possible today again that intermediate wave (1) is over.
Fibonacci ratios within intermediate wave (1) are: there is no Fibonacci ratio between minor waves 1 and 3, and minor wave 5 is just 0.31 short of 0.382 the length of minor wave 3.
A breach of the gold trend channel would substantially increase the probability of this wave count. At that stage, the main hourly wave count would be discarded. A new low below 1,187.97 would add further confidence to this wave count.
When price reaches the lower gold trend line, then how it behaves there should provide some information on which wave count is correct. If price slices easily through the line, then this alternate would be more likely. If price bounces up from the line, the main hourly wave count would be more likely.
ALTERNATE ELLIOTT WAVE COUNT
DAILY CHART
Click chart to enlarge.
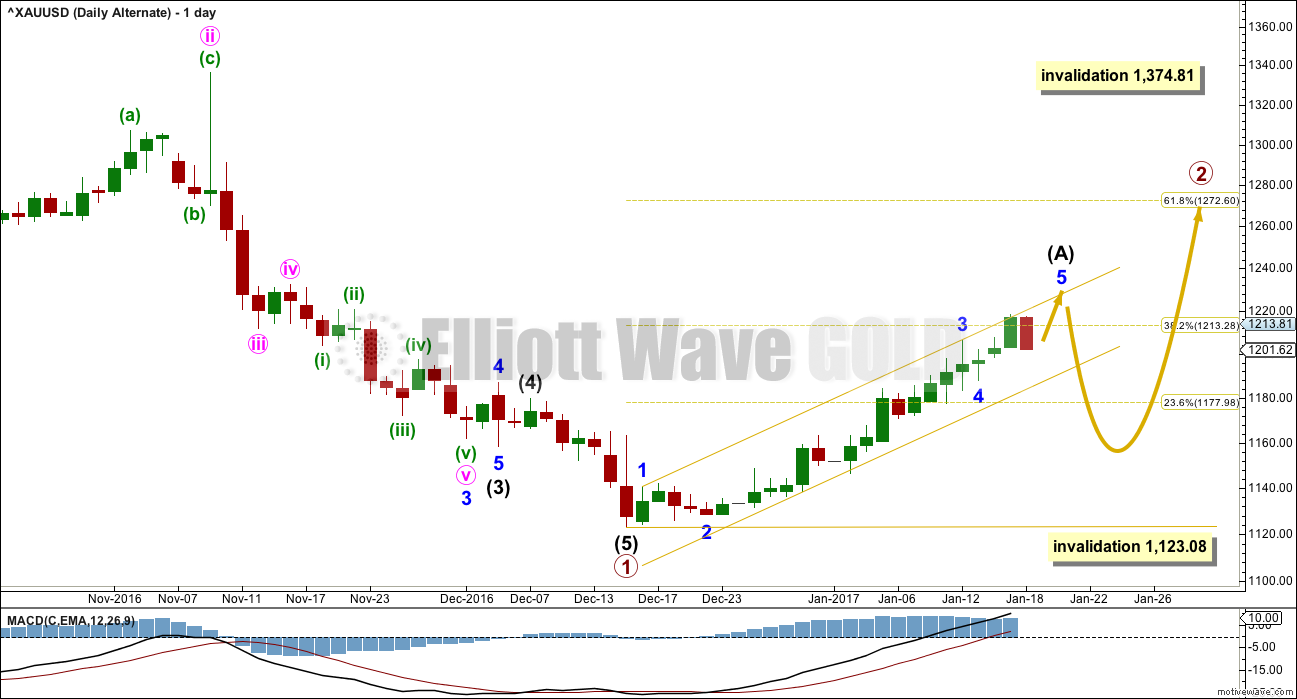
This alternate wave count expects that Gold is still within a bear market. Targets for new lows can be seen on weekly and monthly charts.
Within the bear market, a primary degree correction is underway.
Primary wave 2 is most likely to subdivide as a zigzag. So far it looks like a five up is either complete now or very close to completion. This may be intermediate wave (A). Intermediate wave (A) may now be complete lasting a total Fibonacci 21 sessions.
It is also possible to move the degree of labelling all down one degree within upwards movement for intermediate wave (A). It is possible that only minor wave 1 within intermediate wave (A) is complete. Either way the invalidation point remains the same. If a five up is complete, then the following three down may not move beyond its start below 1,123.08.
Primary wave 2 may not move beyond the start of primary wave 1 above 1,374.81.
TECHNICAL ANALYSIS
WEEKLY CHART
Click chart to enlarge. Chart courtesy of StockCharts.com.
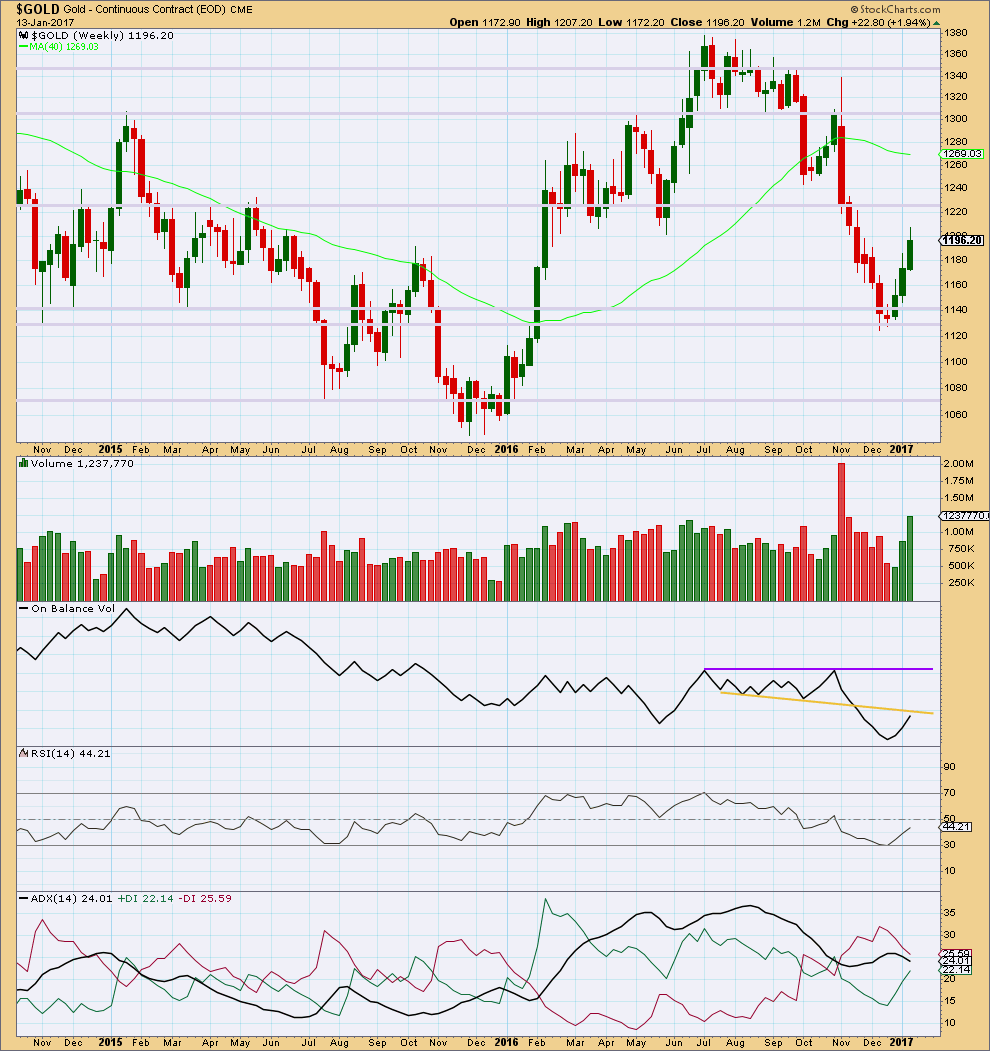
Gold has moved higher for three weeks in a row on increasing volume. The rise in price is well supported by volume. This upwards movement looks healthy.
A Morning Star candlestick pattern at the last low indicates a possible trend change there.
Next resistance is about 1,225.
On Balance Volume may provide resistance before that price point is reached though. It is coming up to almost touch the yellow trend line that previously provided support. However, there is some leeway in exactly how this line may be drawn, so it is not possible to tell with accuracy exactly where resistance is. It may be here or it may be just a little higher.
RSI shows increasing strength to upwards movement.
ADX does not yet indicate a trend change (this is a lagging indicator). The black ADX line is declining, indicating only a consolidation. The -DX line remains above the +DX line. No trend change is yet indicated at this time frame.
DAILY CHART
Click chart to enlarge. Chart courtesy of StockCharts.com.
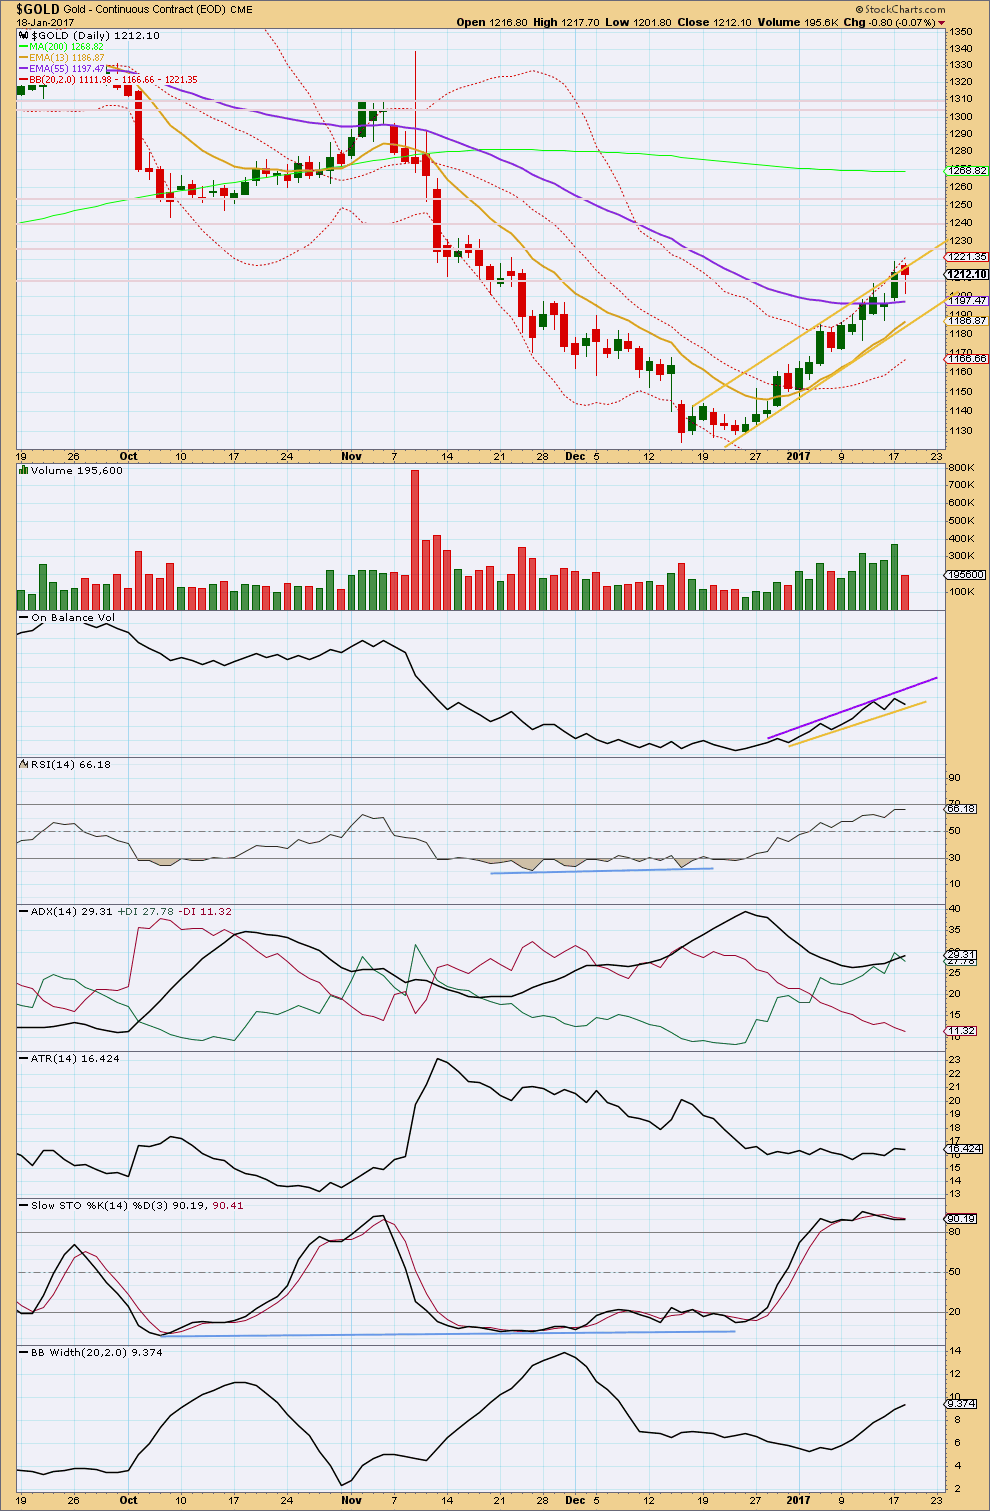
Price continues to move higher finding resistance at the upper gold trend line. Next resistance may be about 1,225, then 1,240, then 1,250. Thereafter, there is very strong resistance about 1,305 to 1,310.
Today’s session completed a red hanging man. This is a bearish reversal candlestick pattern that requires confirmation. For a reversal to be indicated here it needs to be followed by a red daily candlestick that moves price lower.
The session came with substantially lighter volume. The fall in price was not supported by volume. This looks like a small correction within an upwards trend at this stage and not necessarily the start of a deeper correction.
Price has just crossed the mid term Fibonacci 55 day moving average. This mid term average looks like it may be turning upwards. It may now offer support.
Volume strongly supports the rise in price, but there has been no blowoff top yet to indicate an end to this trend.
On Balance Volume is bullish. OBV has today come down to almost touch the yellow support line. This may offer support and assist to halt the fall in price here.
RSI is not yet overbought. There is room for price to rise further.
ADX is increasing, indicating the market is trending; the trend is up. The trend is now moving into extreme as today the black ADX line crossed the +DX line and is now above both directional lines. There is still room for the trend to continue higher though as ADX is below 35.
ATR is overall flat while this trend continues. This is normal for the first wave within Gold’s trends, and also for a counter trend movement. It is impossible still to tell which situation is occurring here.
Stochastics is overbought and exhibits divergence with price. However, this oscillator may remain extreme for reasonable periods of time during a trending market and may exhibit sustained and multiple divergence before price turns. I would not expect this trend to end here because Stochastics is overbought.
Bollinger Bands are widening as volatility returns during this trend. This looks normal. Bollinger Bands are not yet extreme. There is room for the trend to increase volatility further. Price is at the upper edge of Bollinger Bands, but during Gold’s trends this can persist for reasonable periods of time. Example: from 10th to 25th November, 2016, price sat at the lower edge of Bollinger Bands with only three days moving sideways or higher within that trend.
GDX DAILY CHART
Click chart to enlarge. Chart courtesy of StockCharts.com.
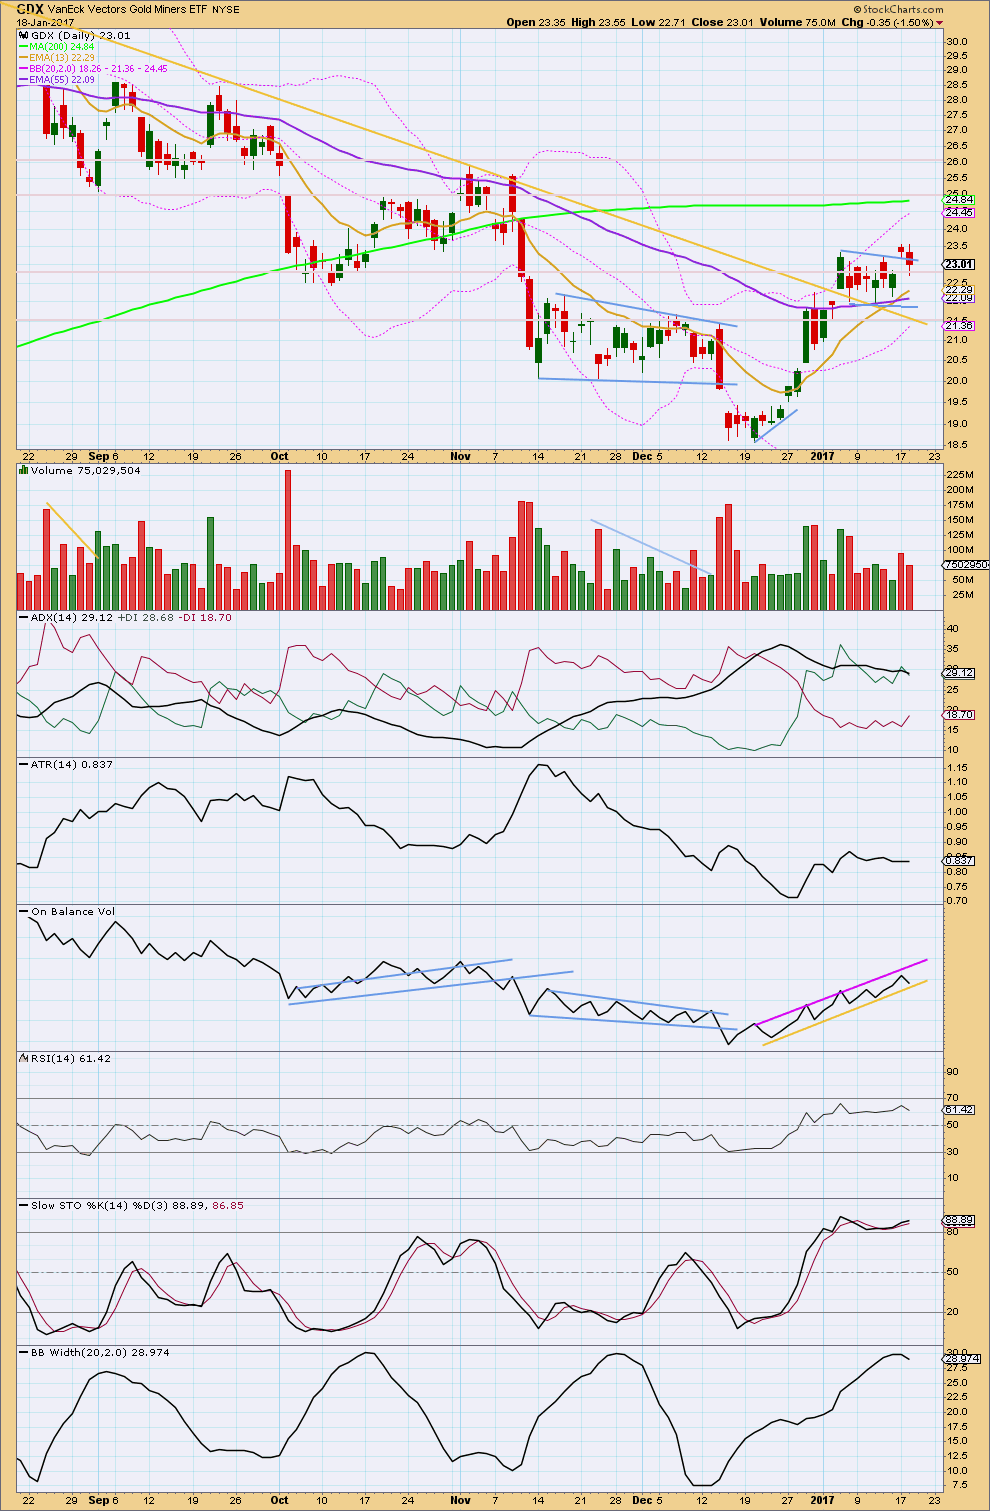
After breaking above what looked like a bull flag pattern yesterday, GDX today returned to close back below the upper trend line for the pattern. The lower wick of today’s candlestick closed the gap. This gap is now more correctly termed a pattern gap; the bull flag pattern is no longer correct because it does not fit within a parallel channel as a flag pattern should. The target is removed.
ADX today is declining, indicating a consolidation.
ATR is now overall flat in agreement with ADX that this market is most likely consolidating. This consolidation may be a slow rounded topping process or a sideways consolidation within a larger upwards trend.
On Balance Volume is bullish and remains constrained. A break below support may indicate a deeper correction has arrived, but first if OBV comes down to the yellow line expect it to provide support.
After looking left for a period of three years, two more horizontal resistance lines are added. Next resistance may be about 25.00. Thereafter about 26.10.
RSI is bullish and is not yet overbought. There is room for price to rise.
Stochastics is overbought and exhibits single divergence today with price. However, this can develop further as Stochastics can remain extreme for reasonable periods of time during a trending market. This alone is not enough to signal the end to this trend.
Bollinger Bands are now extreme though. With BBs now looking like they may possibly be beginning a period of contraction, it looks today like GDX may be beginning a deeper correction.
This analysis is published @ 09:27 p.m. EST.
My apologies to members today for no update prior to market close. I’ve not been able to do that due to family pressures today. I’m back and at work now 🙂
Thank you all for your patience, and thank you to all members who are participating in comments.
And a big thanks to Verne for continuing to share his expertise 🙂
For newer members, take notice of what Verne says. This guy know his stuff, he’s a professional trader and VERY good. It’s an honour to have him here.
Thanks also to Dreamer for continuing to post charts with excellent analysis, and Alan for intraday updates.
And just in case anyone missed it, I’ve noted below that the touch of the trend line where price found support today and bounced up, was the perfect point to join the trend.
It is still a reasonably good point now to join the trend.
Always use a stop! At this time stops may be set just below today’s low. Do not invest more than 1-5% of equity on any one trade. Novice traders should invest only 1-2% of equity on any one trade.
However, manage risk carefully. It is possible today that intermediate wave (1) is over. On Balance Volume has broken below a support line giving a bearish signal, todays red doji offers bearish confirmation of yesterday’s hanging man candlestick pattern.
There is enough bearishness about for me to be cautious enough to not enter long here. But this may be a decision I may regret tomorrow.
I’m also basing that decision on the fact I currently have a nice USDJPY trade open so I’m not in a hurry to add another position right now. I’m too conservative.
I agree that caution here is warranted. The inverse miners closed green despite giving back some of the day’s gains. The yellow metal faces some stiff resistance at around 1205.00
Silver has made an important new high yesterday invalidating the alternate wave count there.
Silver is finding strong resistance at the upper trend line. This may force a deeper correction for both Silver and Gold here.
Maybe
Yes, maybe…
I would have preferred to see support sliced through though. The probability of new highs ATM looks higher than the probability of a deep correction starting here.
Very astute observations and chart Dreamer. Thanks!
The move off the bottom did have a bit of a corrective flavor….
How interesting! SLV moved right down to 15.87 and promptly bounced. If we are in a deeper correction SLV should close below it, if not, we won’t.
hi Verne-
appears SLV closed at $16.12 and didnt revisit $15.87. Whats your take:)?
I am bit neutral at the moment on the counts. If SLV moves past 16.32 I am going to assume the uptrend remains intact. The advantage I think has to go to Lara’s main count as a result of that bounce at the noted trend line.
thank you sir..good advice
We are getting that bounce at precisely where Lara alerted us to look for it – the support line at around 1195. It may be indicating that minor five up is incomplete.
That is exactly my conclusion.
That touch of the trend line is the perfect opportunity to join the trend. Again.
Hi Verne and all,
Based on your 10:17am comment, we are sitting on Lara’s Lower channel line on Dly chart and bouncing up, though Not strongly as of yet.
What makes you favor what sounds like her ALT interpretation as you have a Target of 1140ish (78.6 retrace?) instead of a Minute ii having just ended at the Lower channel line?
Visually, on a Dly, this correction shows 2 red candles, the 2nd has formed a nice TAIL– looks deeper than any other ‘dip’ in the trend as of yet. Perhaps we would need to get above the 1206 area before calling this a Minute i and ii?
Your Thoughts?
I definitely spoke too soon on that 1140 target. As Lara frequently reminds us, we should always assume the trend remains the same until proven otherwise. I was thinking the correction had arrived because of a few other things happening with currencies, especially the Euro, which also appeared to have just completed an abc correction.
Quite a few charts are showing bounces off the morning lows. Not sure what to make of it, if it is just a temporary pause in an ongoing decline…
I do not want to get comfortable with any trade short PMs based on what I have seen so far. Selling Feb 3 SLV 16.5 strike puts for 0.70 per contract. I konow I may be leaving some coin on the table but I am now looking for an opportunity to go long. If SLV surrenders the prior gap at 15.87 on closing price, I will wait for it to reclaim the second gap at 16.32 as a signal the uptrend has resumed.
It looks like the 1182 target is in play now and perhaps it happens before Donald’s speech. Would be a .382 retrace and maybe a good point to jump in, for at least a bounce. If Donald makes any comments about a stronger dollar again in his speech it could be a catalyst to push gold higher. Also more talk of spending could ignite gold for another run up.
I suspect we will go a bit lower as is typical of these first second waves when Gold is starting a new run higher. I think we will go to around 1140.00
Perhaps, I’ll probably scale back in a bit at a time. Last year I don’t think there was a dramatic move down after the initial turnabout. Perhaps this third wave up (assumption) will be more volatile than wave 1 up.
We may have broken support on the first trend line wit the second around 1182 ….382 retracement. We will see if we can get back above the first line.
Thanks Alan, but I am already subscribed and have been getting emails but they just stopped a few days ago.
Thank you Lara. I think that the rise from December 15 came to an end. Sorry for my English.
Your English seems fine. Yes, it is looking rather bearish today.
Still, I want that trend channel confirmation before having confidence in this view.
Hi Lara,
I still don’t seem to be receiving any daily emails?
Nick.
Just scroll down near to the bottom of the page.
Under “Notify Me”, enter your preferred e-mail, then hit the Subscribe key, and you are all set.
I tried to sign up for the alerts a few years ago when I joined but was never able to get it to work. I now just keep two windows on my computer open to EWSM and EWG to get the latest! 🙂
Oh dear! I’ve asked Cesar to look into your accounts with us and make the email work.
Hi Nick, Cesar just explained to me where he’s at with this so far. He says he can see that the emails have been sent from our end each day, but the last one you clicked on was the 13th of January. He has emailed some questions for you.
He will sort that out.
Free “State of the Global Markets” report at EWI. You may need to be a “free” member to access the link. I am going to post a pic of their $USD count. They also have a section on Gold, but I don’t think it’s anything new for most of us as it doesn’t show any recent detail. What it does show is their “invalid” ending diagonal count. lol…
http://my.elliottwave.com/resources/free/State-of-the-Global-Markets-Report-2017-srus.aspx
Lara, what do you make of their $USD count showing a C wave ending versus your much more bullish count? Their count seems to be much more bullish for Gold…
EWI has some good writers but they are not very good analysts. Hulbert’s Digest
consistently ranks them at the bottom of the list of all the dozens of services they track when it comes to forecasting accuracy. If their count differs from Lara’s it is probably wrong. I was a faithful subscriber to a number of their publications for many years and while the writing used to be quite good, one follows their wave counts at one’s own peril. They are terrible at it, name notwithstanding I’m afraid.
I’ve based my expectation of a five up for USD because I see the prior move down as a three. This is the big move down from February 1985 to March 2008 shown on my chart here as super cycle (a)-(b)-(c).
A three should be followed by either a five in the opposite direction, or another three which should be very deep (minimum 0.9 of the first three or longer).
Now, to see the current move up from the low on March 2008 as a three, only makes sense if it reaches up to a minimum 155.32. And it’s a very long way off that.
So if EWI’s wave count sees the current move up as an almost complete three ending below 155.32 then the only EW structure that fits is as wave X within a deeper double zigzag.
That is possible, but what would be more likely IMO based upon a more common structure would be a five up to follow the prior three down.
Thanks Lara. As you always say, follow the trend and its up for now. I always like to get your thoughts on different counts. Something to keep an eye on anyway.
GDX expanded flat correction is still my main count, although I am showing an alternate that would come into play if GDX breaks back above the recent high before completing the expected 5 wave structure down for Minor wave C of the flat.