
A breach of the trend channel and a new low below 1,195.82 invalidated the main Elliott wave count and confirmed the alternate.
Summary: A deeper pullback looks very likely to have begun. Short positions should be watched carefully because this may be a choppy overlapping counter trend movement. The target for it to end is about 1,160 minimum, but it may be deeper, and it may take about 34 days to get there in a big three wave movement.
New updates to this analysis are in bold.
Last monthly and weekly charts are here. Last historic analysis video is here.
Grand SuperCycle analysis is here.
MAIN ELLIOTT WAVE COUNT
DAILY CHART
Click chart to enlarge.
This main wave count has a better fit for prior movement. To see the difference between this main wave count and the alternate below please refer to last historic analysis linked to above.
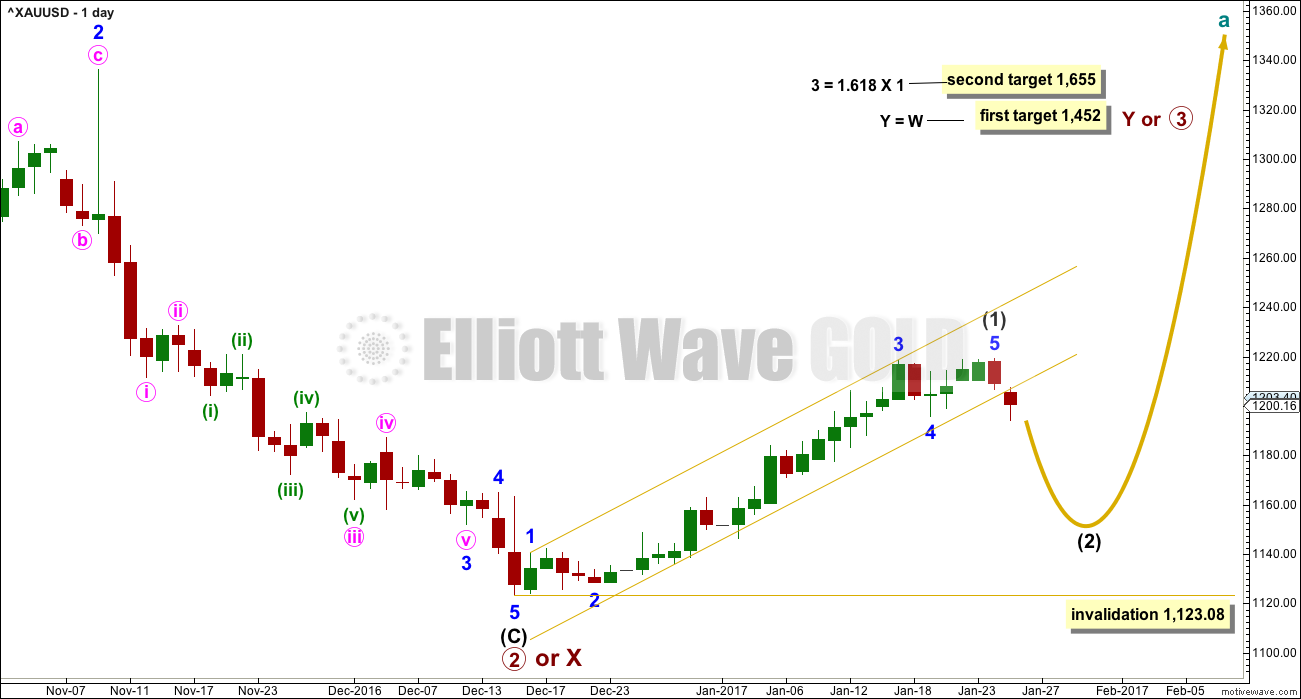
This main wave count expects Gold has had a primary degree trend change in December 2016. The new upwards wave is either a primary degree third wave, or a primary degree zigzag to complete a double zigzag.
Intermediate wave (1) may now be over in 30 days. Intermediate wave (2) may be about even in duration (it may last a Fibonacci 34 days), or it may be longer lasting though because corrections are often more time consuming than the impulses they correct. If it does not end in a total Fibonacci 34 days, then the next Fibonacci number in the sequence is 55.
Today’s candlestick is almost a breach of the gold channel at the daily chart level. At the hourly chart level, the channel is clearly breached. The lower edge of the channel may now provide resistance.
The first in a series of second wave corrections for Gold’s new impulses is usually very deep. Intermediate wave (2) is expected to be at least 0.618 the depth of intermediate wave (1), and very likely may be deeper. It may not move beyond the start of intermediate wave (1) below 1,123.08.
SIX HOURLY CHART – DETAIL
Click chart to enlarge.
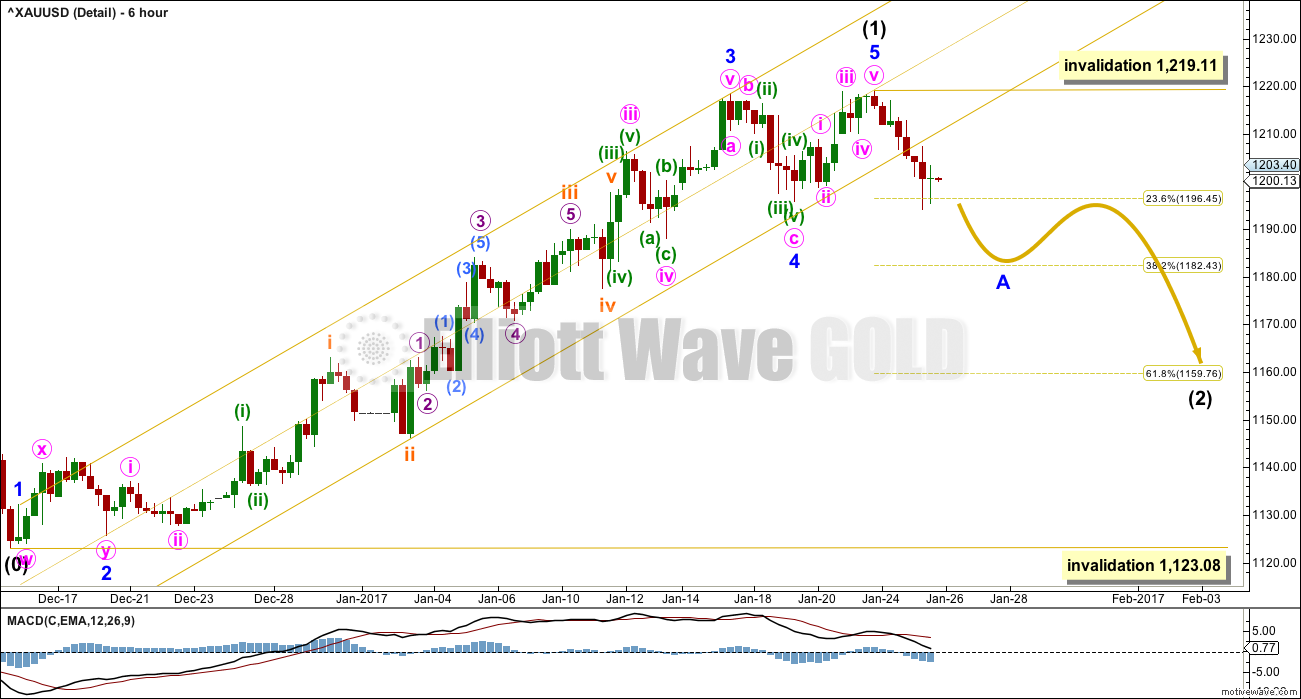
This chart shows detail of all of intermediate wave (1) so far.
Minor wave 1 is seen as a very short first wave, minor wave 2 is a combination, and minor wave 4 exhibits alternation as a zigzag.
Fibonacci ratios within intermediate wave (1) are: minor wave 3 exhibits no Fibonacci ratio to minor wave 1, and minor wave 5 is just 0.45 short of 2.618 the length of minor wave 1.
Fibonacci ratios within minor wave 3 are: minute wave iii is 2.02 longer than 6.854 the length of minute wave i, and minute wave v is 1.30 longer than 2.618 the length of minute wave i.
Fibonacci ratios within minute wave iii are: there is no Fibonacci ratio between minuette waves (i) and (iii), and minuette wave (v) is just 0.27 short of 0.382 the length of minuette wave (iii).
Fibonacci ratios within minuette wave (iii) are: subminuette wave iii is just 0.57 longer than 1.618 the length of subminuette wave i, and subminuette wave v has no Fibonacci ratio to either of subminuette waves i or iii.
Fibonacci ratios within subminuette wave iii are: micro wave 3 is just 0.76 longer than 1.618 the length of micro wave 1, and micro wave 5 is 1.81 longer than 0.618 the length of micro wave 3.
Fibonacci ratios within micro wave 3 are: submicro wave (3) is just 0.37 longer than 1.618 the length of submicro wave (1), and submicro wave (5) has no adequate Fibonacci ratio to either of submicro waves (3) or (1).
All Elliott wave rules are met. Minor wave 1 is short and minor wave 3 is a long extension.
The channel is a best fit. Draw the first trend line from the ends of minor waves 1 to 3, then pull a parallel copy lower to the end of subminuette wave ii.
HOURLY CHART
Click chart to enlarge.
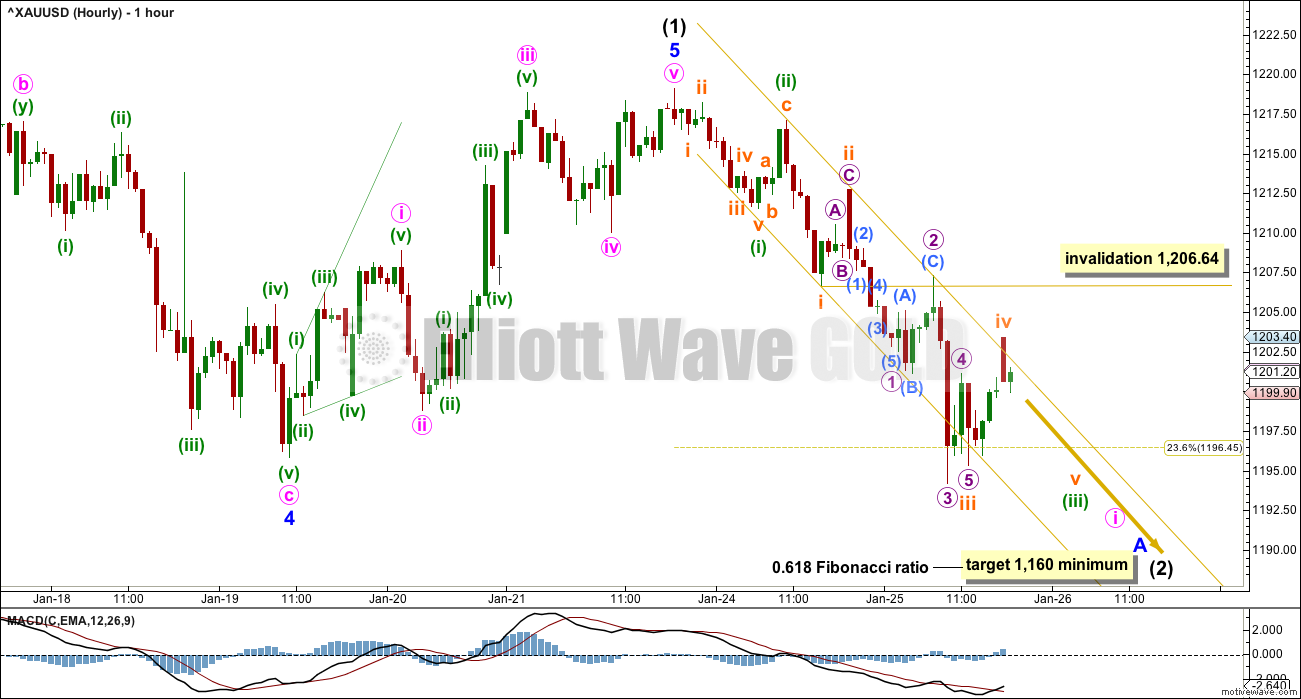
A movement at intermediate degree should begin with a five down at the hourly chart level. This is still incomplete.
When minute wave i is a complete five wave impulse, then the invalidation point for minute wave ii will move to its start at 1,219.11.
For now the invalidation point may be at 1,206.64. Subminuette wave iv may not move into subminuette wave i price territory.
The gold channel is a best fit. So far it shows where price is finding resistance and support, with overshoots to the downside being the ends of strong third waves.
There is a truncation for the end of micro wave 5 to end subminuette wave iii. This came after the strongest downwards candlestick ending micro wave 3; it may have been a movement that could be described as too far too fast. This truncation may be acceptable.
Subminuette wave iii is 0.48 longer than 1.618 the length of subminuette wave i.
Ratios within submineutte wave iii are: micro wave 3 has no Fibonacci ratio to micro wave 1, and micro wave 5 is 0.32 short of 0.618 the length of micro wave 1.
The upper edge of the channel should provide resistance while minute wave i continues lower. If this channel is breached with a full hourly candlestick above and not touching the upper edge, then something else may be happening. At that stage, the short term labelling within minor wave A down may be wrong; a deeper upwards wave may be developing, so I will exit my short position if that happens.
ALTERNATE ELLIOTT WAVE COUNT
DAILY CHART
Click chart to enlarge.
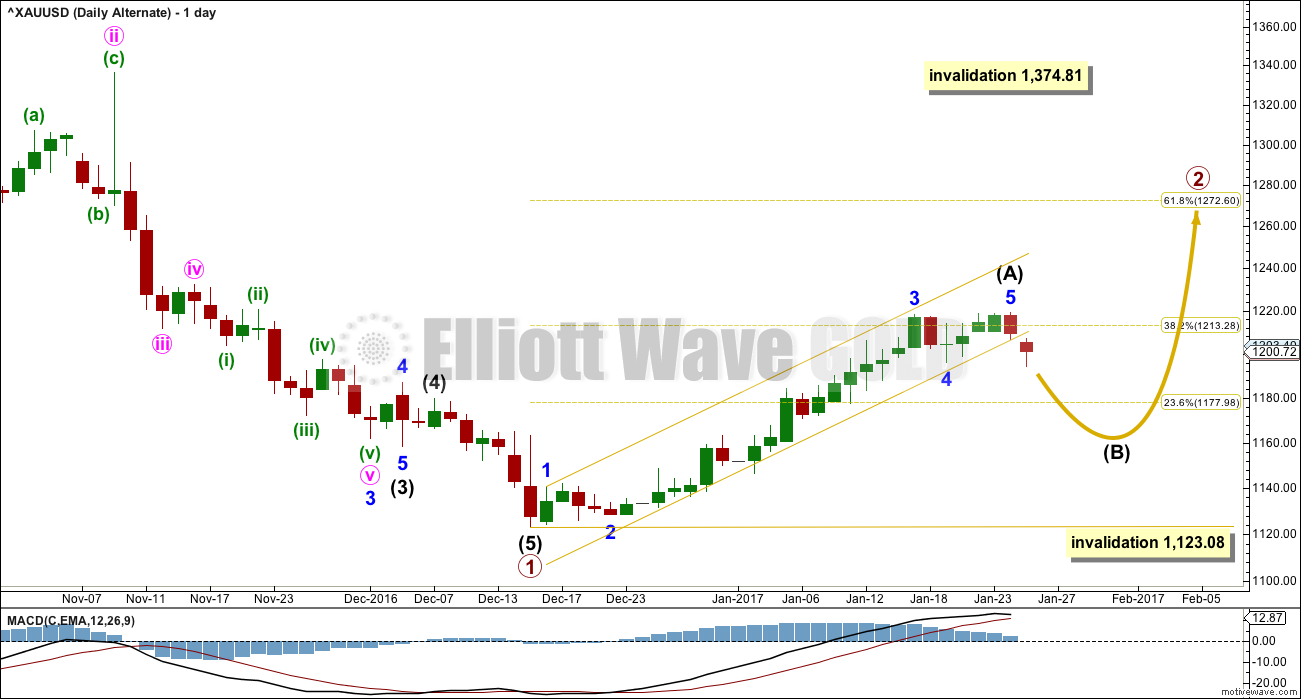
This alternate wave count expects that Gold is still within a bear market. Targets for new lows can be seen on weekly and monthly charts.
Within the bear market, a primary degree correction is underway.
Primary wave 2 is most likely to subdivide as a zigzag. It looks like today intermediate wave (A) is complete and a correction for intermediate wave (B) may have begun.
Intermediate wave (B) may not move beyond the start of intermediate wave (A) below 1,123.08.
Primary wave 2 may not move beyond the start of primary wave 1 above 1,374.81.
TECHNICAL ANALYSIS
WEEKLY CHART
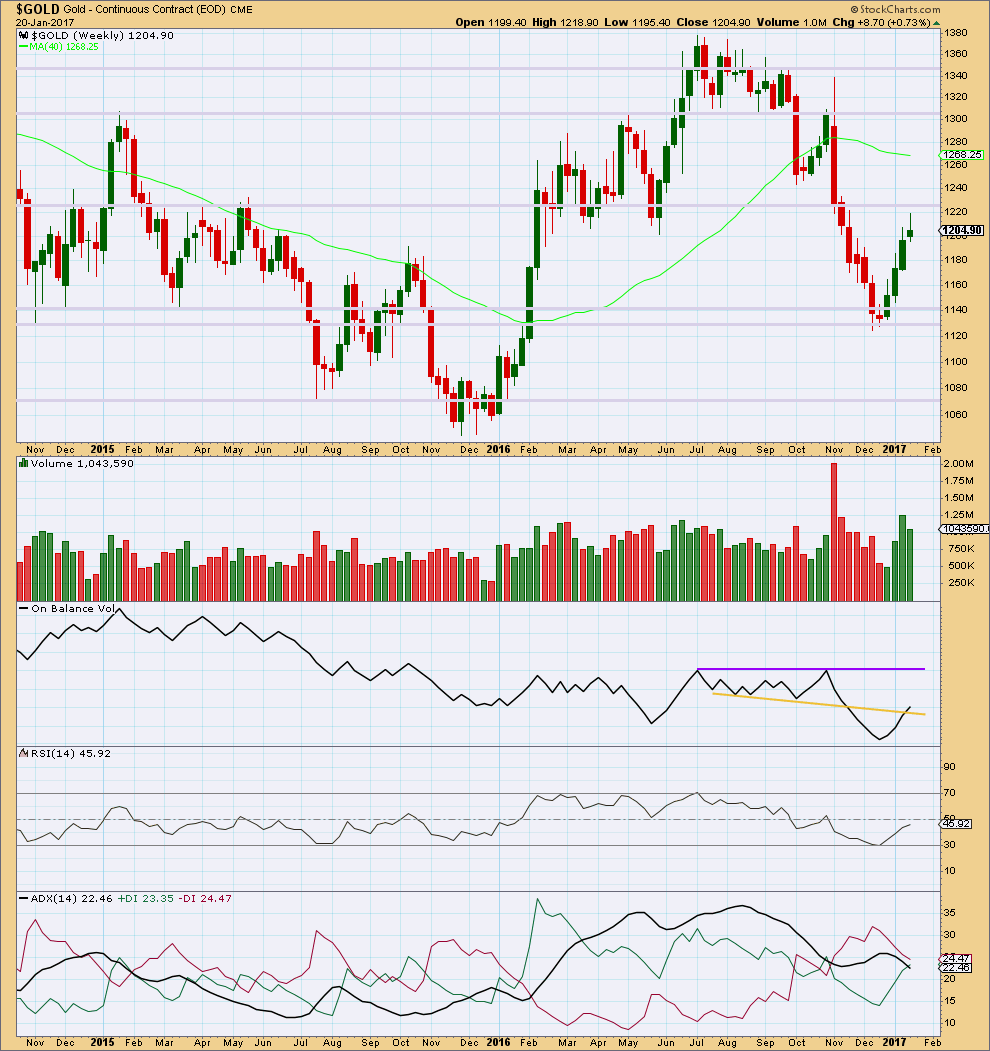
Click chart to enlarge. Chart courtesy of StockCharts.com.
The first three weeks of upwards movement came with a steady increase in volume to support the rise in price, but last week saw a decline in volume. This indicates some weakness for last week.
The long upper wick and small real body of the last weekly candlestick is slightly bearish. This is not a reversal signal at all but only a warning of internal weakness. This upwards trend will either end or see a correction at the weekly chart level; trend changes are often preceded by signs of weakness.
Price may find some resistance about 1,225.
On Balance Volume gave a weak bullish signal last week. The signal is weak because this line has been broken before. The purple resistance line offers stronger technical significance.
At the weekly chart level, RSI is increasing along with price.
ADX is still declining, indicating the market is not yet trending (but this is a lagging indicator). ADX has not yet indicated a trend change from down to up; the -DX line remains above the +DX line.
DAILY CHART
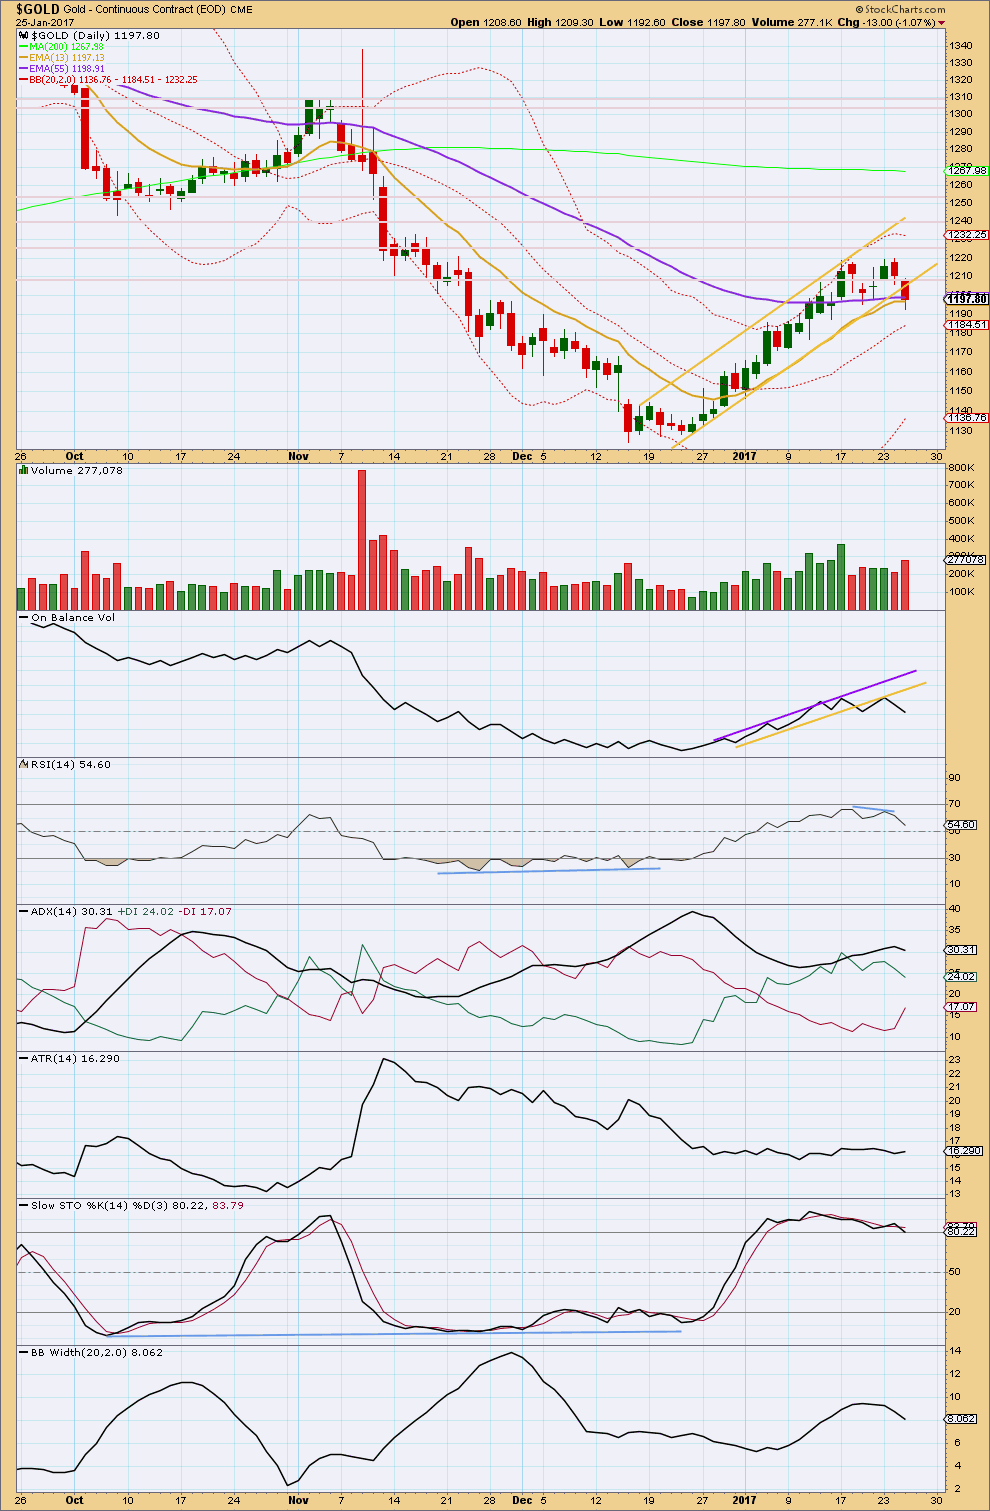
Click chart to enlarge. Chart courtesy of StockCharts.com.
Price has closed below the lower edge of the gold channel. If the next daily candlestick prints fully below and not touching the lower trend line, that would be a very clear channel breach.
Downwards movement today has support from volume. Volume today is higher than the prior five days, so the support is reasonable. At least one more downwards day may be expected to be very likely.
On Balance Volume is bearish as it finds resistance at the yellow line.
RSI is above neutral and declining with price. The small single divergence at the last highs is bearish.
ADX today indicates no trend as it is declining. The prior upwards trend with the ADX line above both directional lines was extreme, so a pullback is very likely.
ATR remains flat.
Stochastics exhibited multiple divergence with price at highs and it was overbought. This is bearish.
Overall, a pullback here looks to be very likely. Support may be found at about 1,170 and 1,140.
GDX DAILY CHART
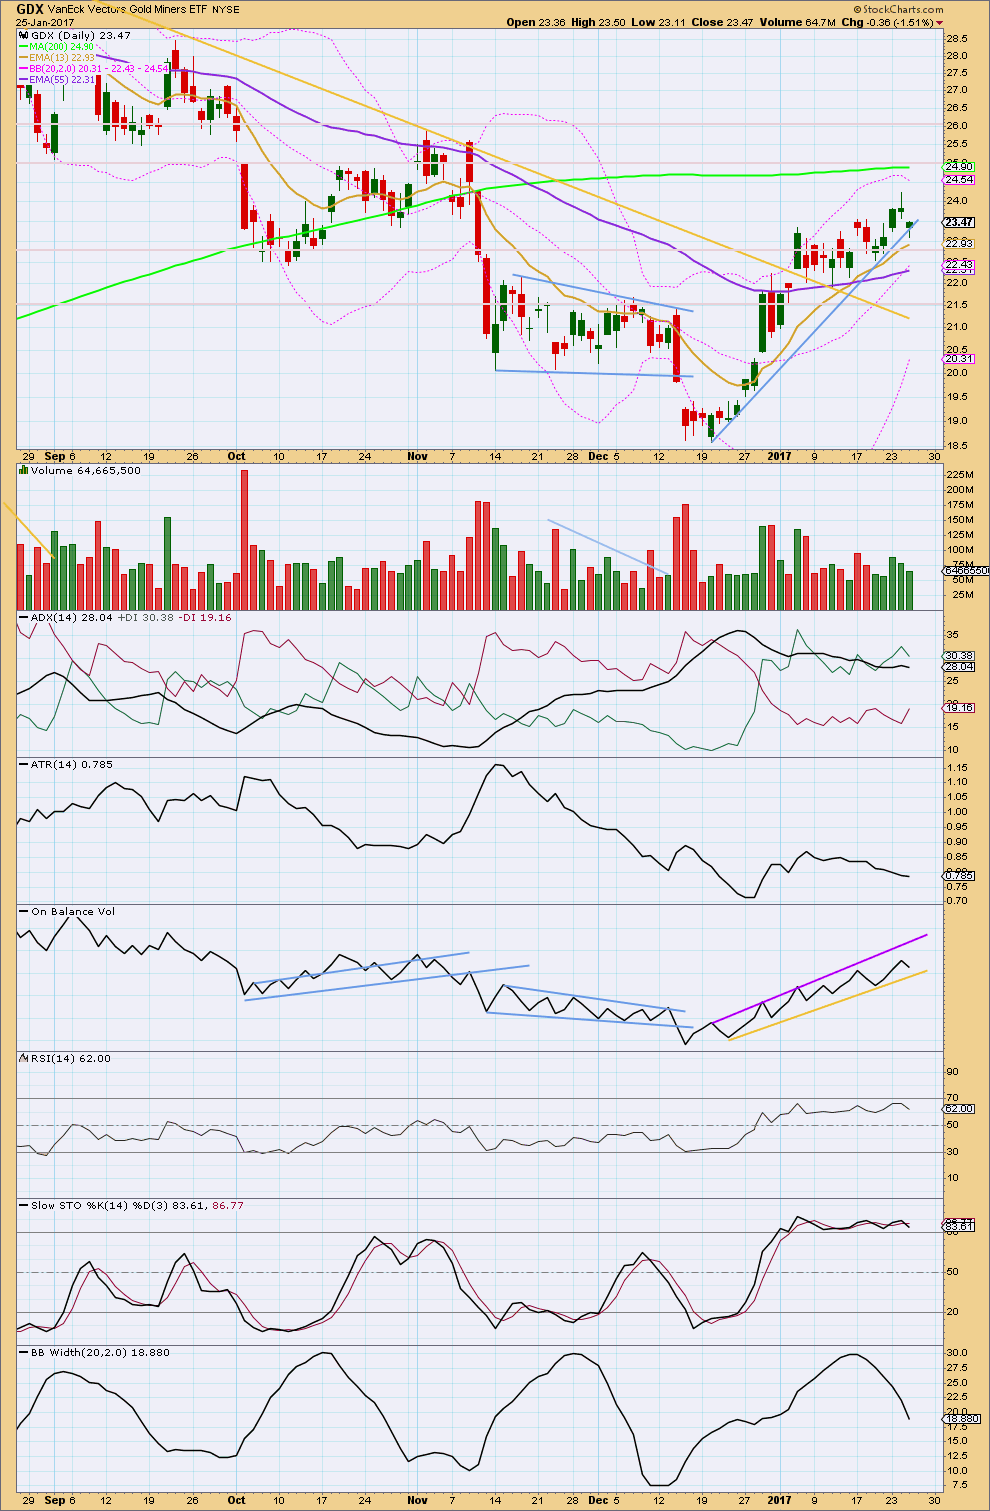
Click chart to enlarge. Chart courtesy of StockCharts.com.
GDX has not closed below its trend line. Price moved lower today on declining volume, the balance of which was down. The fall in price does not have support from volume for GDX.
The 13 day moving average may provide some support.
ADX indicates no clear trend for GDX. ATR agrees as it is declining.
On Balance Volume remains constrained, giving no signal.
RSI is not extreme. Stochastics is, and exhibits divergence with price at highs, which is a bearish signal.
GDX today is less clear than Gold. I would rather let Gold analysis lead GDX than vice versa.
This analysis is published @ 07:50 p.m. EST.
Lara,
Do you see us in ‘c’ of a ivth (a flat) currently. Or is this going to drag out and we are possibly in ‘b’?
Once a 5th down comes along to complete Minute(pink) icrc, do you expect it to extend, though Minuette (green) (iii) was quite extended already?
When stopped Out…find a way back in… ‘get on base’!
I think subminuette c of minuette (iv) is most likely over.
Now beginning minuette (v) down. Exactly as my posted chart expects.
At least, that’s what I see today so far.
What the…. this is seriously dodgy.
I had a short opened at 1,206. I had my stop at 1,206 to eliminate risk.
Gold has gone down as I slept….
But my broker stopped my trade out! And the chart on CMC does not show any spike up to 1,206.
I must’ve done something wrong 🙁 Gutted.
Bummer…That sucks!
Lara I could tell you stories. I am sure you remember some of my rants about broker shenanigans over on EWSM. This kind of weirdness does happen from time to time and it is truly maddening when it costs you money. 🙁
Well, I have no loss. But I don’t have a profit either. Digging into what happened it was my stupid fault. I moved my stop too early and didn’t give the market enough room to move.
I tend to log off my account and not look at it for a while, this time for 2 days. I do that because otherwise I hover and make bad decisions.
In this case it looks like a small movement stopped me out very soon after I moved my stop down.
A stupid amatuerish mistake, which I’ll take as a lesson.
Hourly chart update:
One more final fifth wave down is what I am expecting. When minute i is complete then the invalidation point moves up to the start of it at 1,219.11, minute ii may print at least one green daily candlestick.
So far the best fit channel is working.
This is how I’m approaching finding my exit / taking profit here:
– if price breaks above the channel clearly I’m out.
– if price makes a new low I’ll count the waves on a lower time frame, as soon as I see a complete five I’ll exit.
I don’t want to hold my short while minute ii may move price reasonably higher.
Verne,
I agree w/your comment this morn about quickly grabbing a profit on JDST, etc. From my live trades and studying the movement, you have to sell into the “heat” between 9:30-9:45. I have been purchasing before 4pm and selling @ open 2 days in a row. Tricky to judge.
I hope I’m not the only one who is some what confused.
Going by Lara’s count, looks like Minuette (green)iii is complete and as Verne suggests, we may be in an a flat, ie, possibly ‘c’ w/possibility of it reaching upper channel line as Minuette ii did. What do you think?
Avi Gilburt suggests this move, at least on GDX is about complete. I am not so sure about that. I see a 5 up on 15min on DXc1- Dollar.
Anyone’s thoughts?
Smart trades Mealnie. Avi is an awesome Elliottician but I think Lara’s count is more accurate in that it is quite early to call this correction complete. It may be that he is seeing some divergence of the miners from the metals but they generally hit their highs and lows after the metals. I do think that both Euro and the dollar are reversing as we speak. I am keeping an eye on this morning’s gap down in FXE at 104.39 from yesterday’s close – it should remain open during the current correction for the metals I think. I guess we still could be in a fourth wave with a final fifth up to come…
I sure would like to see an impulse down complete before the close. Gold has a tendency to make these crazy counter-trend moves after hours and I have a sneaking suspicion that we could see the final move down just before the close and the bounce start over-night. Hoping to see JDST clear 22 sometime today…
Anyone else seeing an expanded flat for a small degree fourth wave?
Does fifth wave intensity for commodities apply to impulses down also?
Yes, I see it. Minuette (iv).
And yes, definitely. Fifth waves for Gold are strong on both directions.
Thanks for commenting…Lara…some quick clarity!
My favorite proxy for the metals. SLV, just issued a sell signal, albeit a bit belatedly, with a a trade below its initial gap at 15.87. A close beneath this level means the sell signal remains in force until it once again trades above 16.32.
The Euro looks to be breaking down out of an ending diagonal. Lara sees it as a fourth wave in her latest analysis and some are seeing it as a second wave correction ahead of a third wave down to ultimately take the Euro to parity. I snagged a couple Feb 3 103.5 puts at 0.57 per contract. Looking for a quick double at 1.10 apiece in a day or two if that third wave is indeed unfolding. Even a fifth wave down should do it. EDs typically swiftly retrace to their origin, which should take the Euro below 103.39 in very short order.
Some of you will probably say “Dude, its way too early!” but I am already looking for entry points for a long side trade. I am looking at prior fourth wave lows in JNUG and NUGT at 7.65 and 9.41 respectively. Those levels are not that far away. If we don’t hit them on this first impulse down, I will look for an initial light entry after a second or b wave bounce.
Looks like a small degree fourth wave unfolding. If so we should see a new low today followed by the first bounce.
Yep. I’ll say it. “Dude, it’s way too early!” 🙂
I knew it!! 🙂 🙂 🙂
I know it will not ultimately change the wave count, but I cannot help but notice declines in the metals are being aggressively bought. For the last several market sessions price is making its low early after the open with a steady march higher during the day. I am changing my trading approach to selling at the open and re-buying short positions at day’s end as long as the down-trend remains intact. I am long JDST at an entry price of 20.00 per share and opened a sell order at a limit of 22.00 that I do not expect go get filled until possibly tomorrow’s open, assuming an impulse down does not complete this session. If that happens, I will add to my position at the close.
Has anyone else executed short-side trades besides Lara and I?
I thought it was funny how we both got un-ceremoniously stopped out of our attempts to trade the long side. Hopefully we are on the right side of the trade this time! 🙂
I did. The moment price couldn’t breach the 1220 resistance barrier I was short. But, I would exit temporarily at the end of this wave down (currently ending or ended its fourth subwave), Lara’s Minute 1, my Minor A.
I will switch to a long trade riding the next wave up on a scalping basis, planning to continue the short trade for my Minor C down. With all this volatility, it does not pay to settle for a buy-and-hold strategem. Short trades seem to be in vogue.
I’ve got a profit on this trade which I’m happy with so far. I think I’ll hold on just one more day… but I’ll be watching this market closely today (my time). In my evening it may start to fall again, and if it does and makes a new low I’ll be counting the waves on the 5 minute chart. As soon as I see a complete impulse I’ll exit.
And I’ll post that here in comments for any members holding short positions today.
Lara. I feel that the drop from the high of 1219.11 is getting quite protracted to be only Minute 1. Would it make sense to shift everything after that up one degree? This means that the drop constitutes Minor A instead.
Interesting point. I was thinking that 1160 seemed high as a target for intermediate two if we were still only in minute 1 down.
SLV looks as if it will avoid breaking 15.87 until either a second or b wave is done.
This correction may be short lived. Lots of bullishness to price action.
It’s because of the duration I expect for intermediate (2).
Intermediate (1) lasted 30 days, so I’m expecting intermediate (2) to be about even. It’s only just had two days, so that’s awfully quick for minor A.
Lara, along the same topic as Thomas’s post, I’ve always wondered why you don’t include any sentiment data as part of your EW analysis? It does seem to be a part of EWI and some other EW analysts that I have occasionally ran across.
Is it because of the cost of the data or that you don’t think it would add value to your analysis?
Signed, curious Dreamer…
Curious Dreamer….
I take a look at MSN Greed / Fear index from time to time.
I’m working my way slowly through a text on Commitments of Traders, when I have a solid handle on that I’ll start using it for Gold analysis.
I’ve tried to see how the put / call ratio could be useful, but I couldn’t figure it out. I went over my various texts for it, but looking at the data it didn’t look like it was helpful in picking a turn. That’s for the S&P analysis though.
So yeah, I’m working on it. It’s taking some time. I know that I need to include sentiment.
Wow! I can’t believe I posted this on December 16th. Within hours of that low!!!
Thomas
December 16, 2016 at 11:52 pm
Over the past few weeks I’ve noticed on this thread that a lot(not all) of the comments were still showing some optimism for a bullish case to be made and slowly more and more it seems pessimism is gaining strength, to the point where is seems we’ve given up hope that a turn up in Gold will ever happen. Isn’t that the way Socionomics and Elliott Wave works? At extremes of optimism and pessimism, a change of direction is about to occur. It may not always coincide perfectly, but closely. In EWI tonight they where talking about levels of pessimism only seen a few times in the past with gold, but the past 21 days have seen record pessimism that had not been seen in the past 29 years. Gold is currently at 4% bulls and it appears almost everybody never wants to buy Gold again.
Help me understand this better if I’m saying something wrong.
Thanks
Thomas
I’m not saying the current situation is the same because each wave has different characteristics, but I was shocked when I read my post.
Nicely done Thomas 🙂
Thank you! But I can assure you I had little idea what I was trying to say 🙂
My assessment for tomorrow is a small bounce in Gold before heading lower(maybe will happen before the US markets open). I think most people are in awe that the DOW broke and closed above 20,000 and can’t believe it quite yet and don’t know what to do with it either. Yikes, I’m probably wrong, but that’s my uneducated guess. I really like your and the groups analysis much better and I’m taking my night off from work to thank all of you for such great input.
Thomas
I don’t usually write like a blithering idiot, but when I do, my wife has been pouring the wine!
Chablis…or Carbernet? 😀 😀
Haha… I’m sure the wine was delicious! 😉
I think it was a 2015 Pinot Noir. A little old, but drinkable!
I am partial to a Riesling, nicely chilled!
Wonderfully compliments seafood! 🙂