
Summary: Natural Gas is in an upwards trend. The last correction ended at support on the 9th of January. The target for upwards movement to end is about 4.304.
MAIN ELLIOTT WAVE COUNT
WEEKLY CHART
Click chart to enlarge.
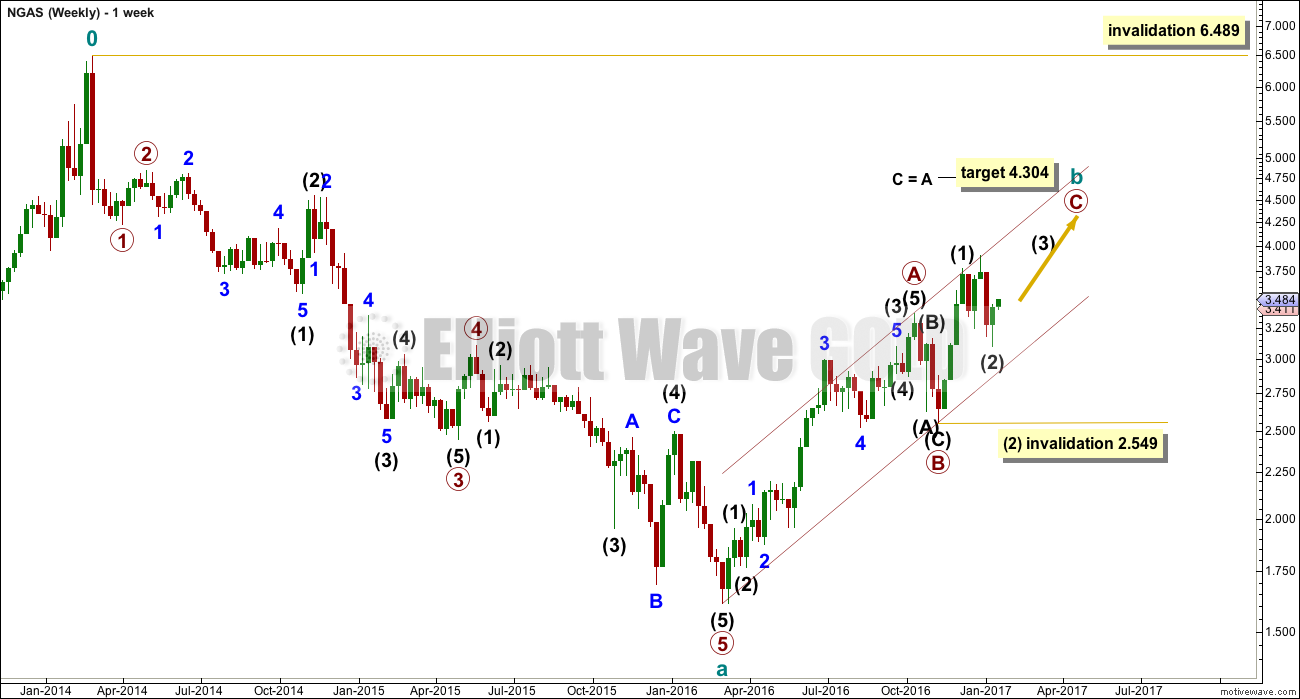
This weekly wave count for Natural Gas begins at February 2014 candlestick. Data from BarChart does not go back in history far enough to begin the count earlier.
From February 2014 candlestick, a large downwards wave is complete to the low on February 2016. This subdivides neatly as a five wave impulse. If this piece of the analysis is correct, then it should be followed by a three up that may not make a new high above 6.489.
This main wave count sees the three up as incomplete. It should be expected that this main wave count is more likely while price remains within the Elliott channel. Assume the trend remains the same until proven otherwise.
DAILY CHART
Click chart to enlarge.
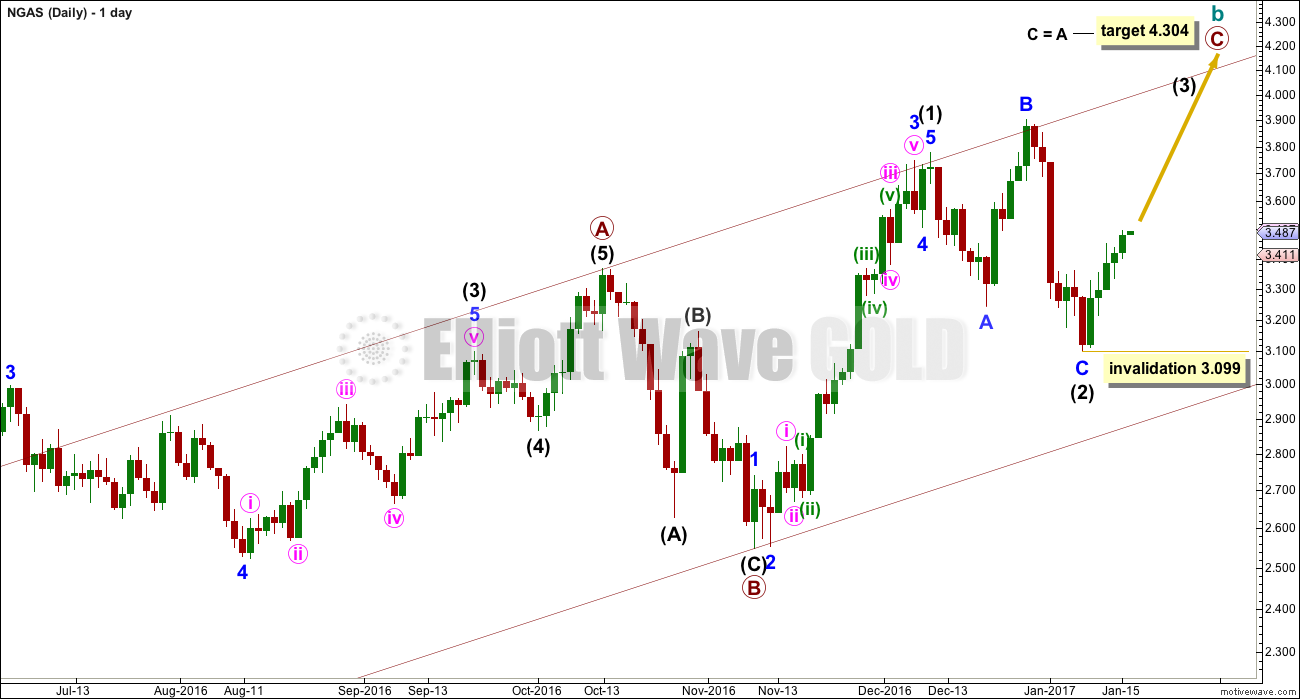
Cycle wave b is seen as an incomplete zigzag. So far, within the zigzag, primary waves A and B are complete. Primary wave C is incomplete and continuing upwards.
So far only intermediate waves (1) and (2) are complete within primary wave C. Intermediate wave (2) is a common expanded flat correction. This wave count now expects to see an increase in upwards momentum as a third wave for intermediate wave (3) unfolds.
A target for intermediate wave (3) is not calculated because it does not fit with the higher target of primary wave C.
Within intermediate wave (3), no second wave correction may move beyond the start of its first wave below 3.099. If this main wave count is invalidated, then the alternate below would be used.
ALTERNATE ELLIOTT WAVE COUNT
WEEKLY CHART

Click chart to enlarge.
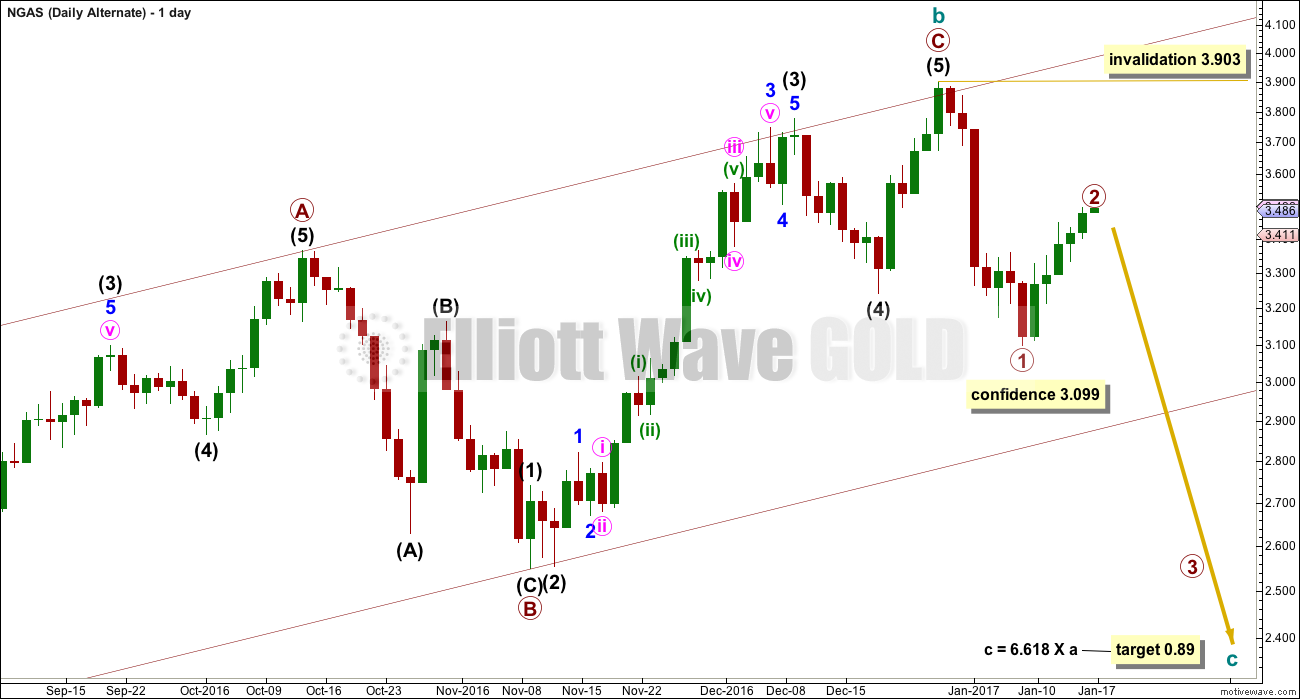
This wave count is identical to the main wave count up to the end of primary wave B within cycle wave b.
It is possible that primary wave C is a complete five wave impulse, which means it is possible that cycle wave b is over.
DAILY CHART
Click chart to enlarge.
Primary wave C must be seen as a complete five wave impulse. To do that it does not have as good a look as the main wave count for this piece of movement.
A new high above 3.903 would invalidate this alternate wave count and that would add confidence to the main wave count.
TECHNICAL ANALYSIS
DAILY CHART
Click chart to enlarge. Chart courtesy of StockCharts.com.
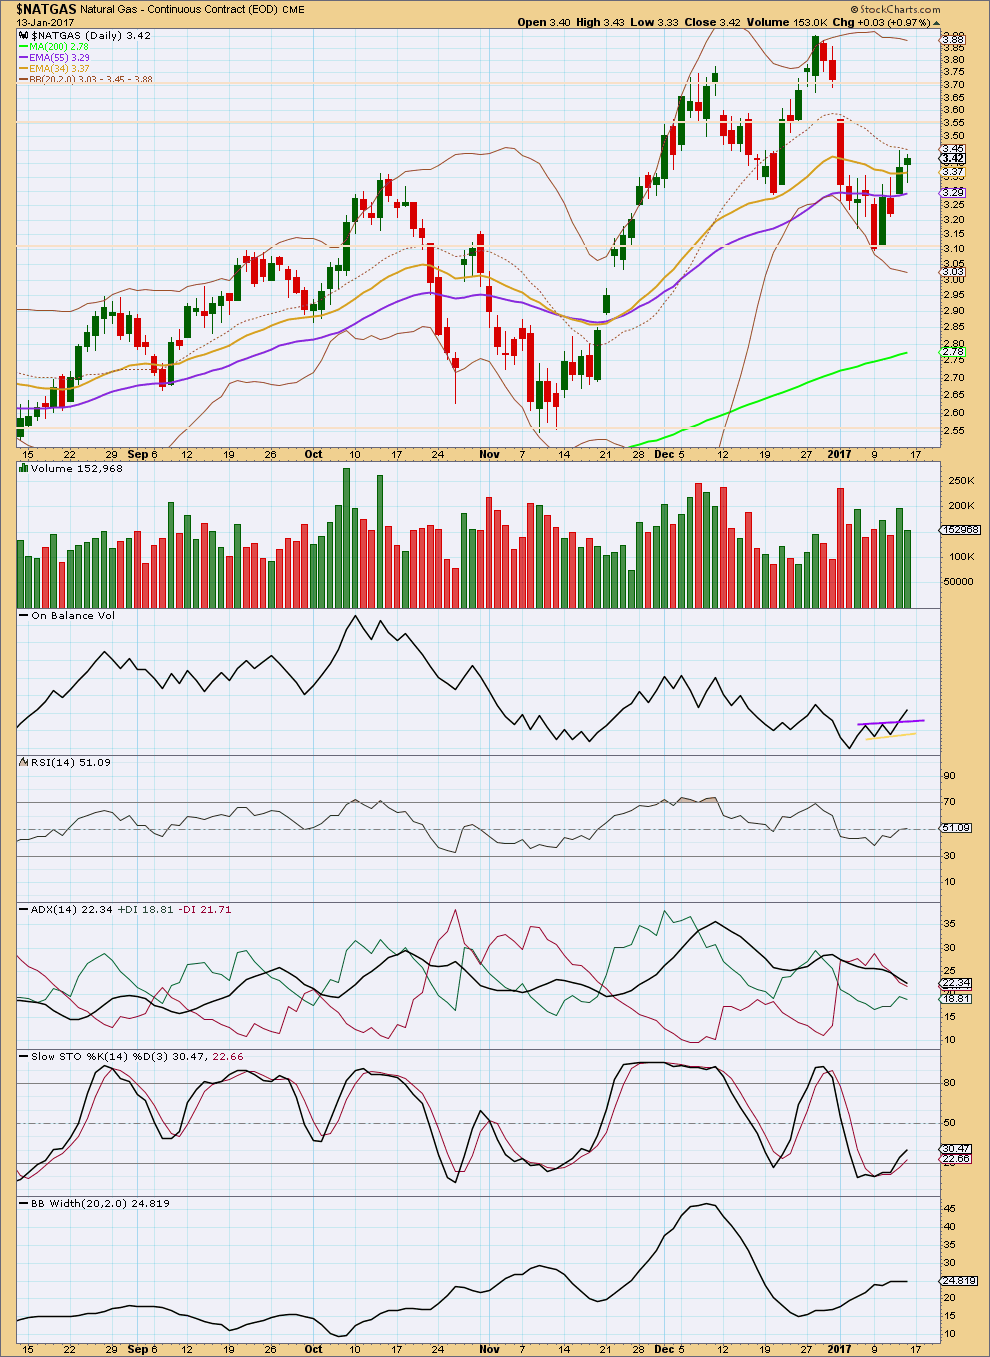
Natural Gas is in an upwards trend. The short term average is above the mid term, which is above the long term. At this stage, all three averages are pointing upwards.
ADX disagrees though. It is declining, indicating the market is consolidating and not trending. Price has been constrained within a large range from about 3.105 to 3.705, areas of prior strong resistance and support.
The upwards trend reached an extreme level at the high on the 9th of December with ADX above 35 and above both the directional lines. Thereafter, price has moved sideways in a large range. This has dropped ADX down to the low 20s, giving room again for a trend to continue.
While ADX remains pointing downwards, one approach to this market would be to use support and resistance lines on price in conjunction with Stochastics to indicate when each swing ends and the next begins. At this time, price has turned up from support and Stochastics has turned up from oversold. It is reasonable to expect price to continue overall upwards from here to reach resistance. If Stochastics reaches overbought at that time, then the upwards swing may end.
Two of the three last upwards days show some increase in volume. This supports the idea that price may continue higher at least to resistance here.
Price has turned up after reaching the extreme lower edge of Bollinger Bands. With price now at the mid line of BBs, watch it carefully here. This may offer resistance.
Finally, the strongest piece of technical analysis here is On Balance Volume. The break above the purple resistance line should be taken seriously. This is a bullish signal. OBV often leads price when using trend lines.
This analysis is published @ 12:55 a.m. EST on 17th January, 2017.
Lara, here’s a long term chart that may be helpful if you update your NG count in the future. Chart by Tommy
Thanks for the bonus analysis! 😀
You’re welcome. A member emailed me a couple (?) of weeks ago to ask for it, so I figured I could share it with everyone else 🙂