
A little upwards movement fits the Elliott wave count.
The first in a series of second wave corrections may now be complete today.
Summary: The target for a deep pullback is at 1,148.
Follow my two Golden Rules of risk management:
1. Always use a stop.
2. Invest no more than 1-5% of equity on any one trade.
New updates to this analysis are in bold.
Last monthly and weekly charts are here. Last historic analysis video is here.
Grand SuperCycle analysis is here.
MAIN ELLIOTT WAVE COUNT
DAILY CHART
Click chart to enlarge.
This main wave count has a better fit for prior movement. To see the difference between this main wave count and the alternate below please refer to last historic analysis linked to above.
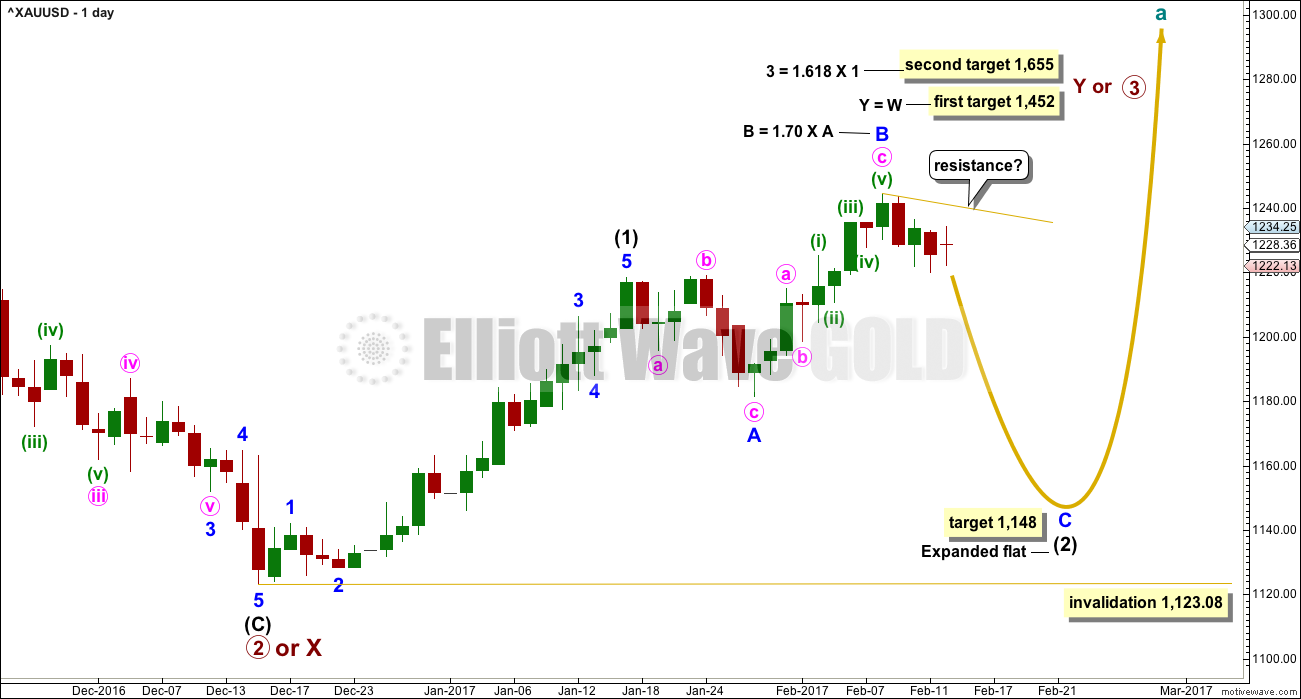
This main wave count expects Gold has had a primary degree trend change in December 2016. The new upwards wave is either a primary degree third wave, or a primary degree zigzag to complete a double zigzag.
Intermediate wave (1) is an impulse that may have lasted 23 days, two longer than a Fibonacci 21. Intermediate wave (2) may be unfolding as a very common expanded flat correction.
Within intermediate wave (2), minor wave A fits best as a regular flat and minor wave B is a zigzag. Minor wave B is longer than the common length of 1 to 1.38 times A, but within the allowable convention of up to two times the length of A.
The appropriate target for minor wave C is 2.618 the length of minor wave A.
So far intermediate wave (2) has lasted twenty sessions. Minor waves A and B have lasted a Fibonacci eight sessions each. If intermediate wave (2) exhibits a Fibonacci duration, it may be a total 34 sessions.
Alternatively, intermediate wave (2) may not exhibit a Fibonacci duration.
HOURLY CHART
Click chart to enlarge.
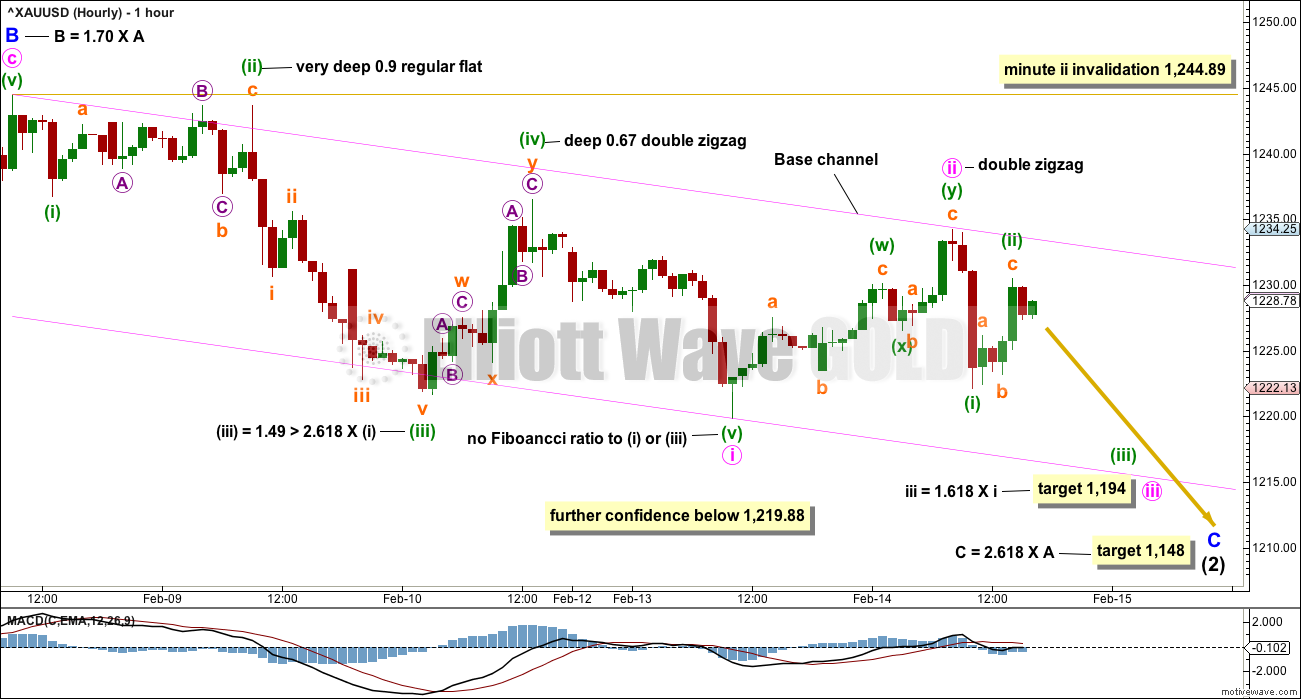
Minute wave i was complete. The bounce for Tuesday’s session looks like minute wave ii.
Importantly, the upwards movement labelled minute wave ii will only fit as a corrective structure. It does have a cursory look as a five, but that would violate two Elliott wave rules: the third wave would be the shortest, and the fourth wave would overlap back into first wave price territory. The conclusion must be that on the hourly chart there is most likely a five down (labelled minute wave i) followed now by a three up (labelled minute wave ii). This adds confidence that price is likely to continue to move lower.
The target for minute wave iii assumes it may exhibit the most common Fibonacci ratio to minute wave i.
Along the way down, upwards corrections may now find resistance at the upper edge of the base channel.
If price prints a full hourly candlestick above the upper edge of the base channel, then assume that minute wave ii is not over and is continuing further as a flat correction. This is possible. For this reason the invalidation point is left at the start of minute wave i at 1,244.89. Minute wave ii may not move beyond the start of minute wave i. This possibility is the risk today to short positions.
ALTERNATE ELLIOTT WAVE COUNT
DAILY CHART
Click chart to enlarge.
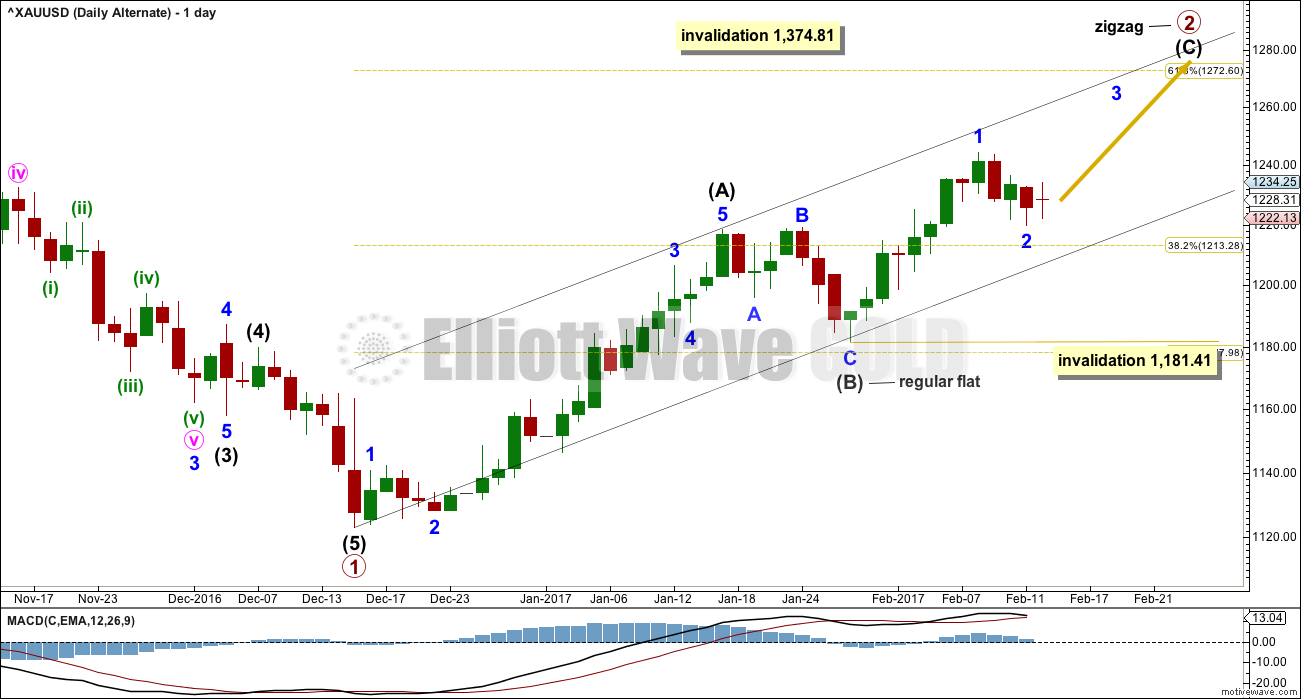
This alternate wave count expects that Gold is still within a bear market. Targets for new lows can be seen on weekly and monthly charts.
Within the bear market, a primary degree correction is underway.
Primary wave 2 is most likely to subdivide as a zigzag. Intermediate wave (A) is complete.
The alternate idea reverts back to seeing the correction here labelled intermediate wave (B) (and for the main wave count it would be labelled intermediate wave (2) ) as a complete regular flat.
The next five up, for this alternate labelled intermediate wave (C) (and for the main wave count labelled intermediate wave (3) ), may have begun.
Within the impulse upwards, a first wave labelled minor wave 1 may now be complete. Minor wave 2 may not move beyond the start of minor wave 1 below 1,181.41.
Primary wave 2 may not move beyond the start of primary wave 1 above 1,374.81.
This wave count now expects that Tuesday’s session was the start of a third wave up at two degrees. The red doji for the session with a long upper wick is bearish, so this does not support this wave count.
HOURLY CHART
Click chart to enlarge.
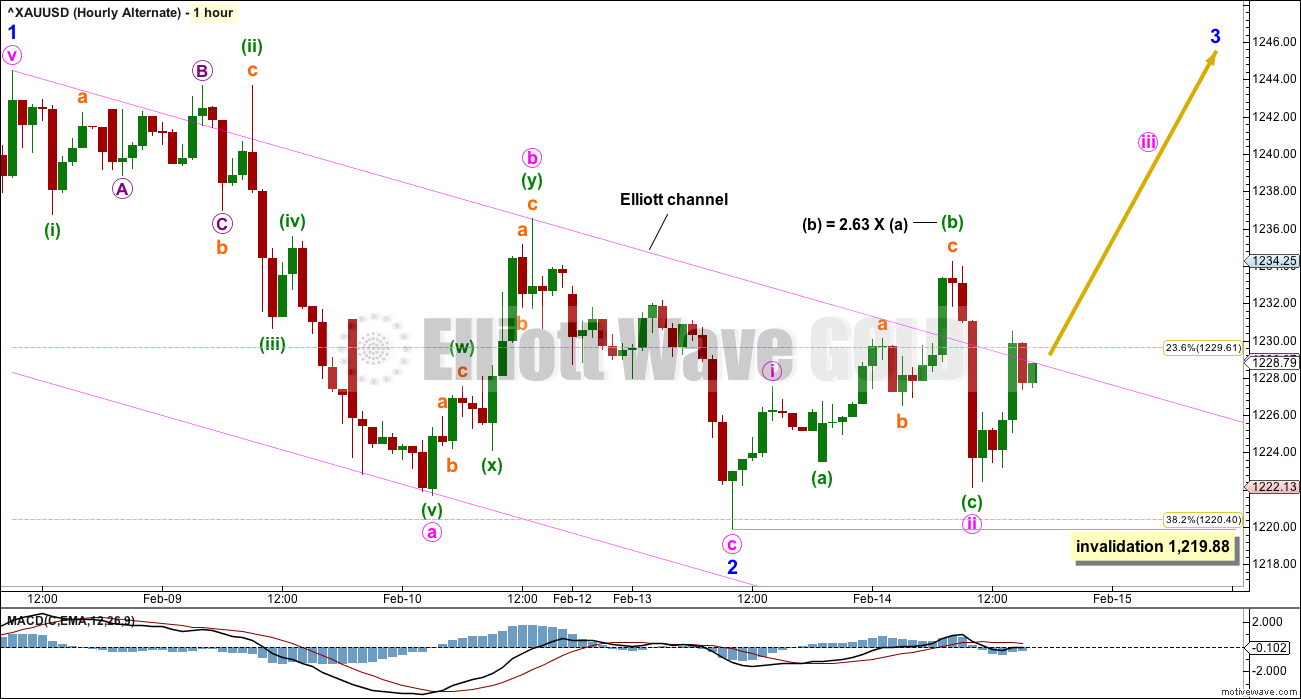
Minor wave 2 may be a complete zigzag.
This alternate wave count sees upwards movement from the low of Tuesday’s session as a first wave. But it will not fit and meet all Elliott wave rules if the five up is seen over at the high labelled minuette wave (b), so this high may be part of a correction for minute wave ii.
Minute wave ii here is seen as an expanded flat. But within minute wave ii, minuette wave (b) is much longer than the maximum allowable convention of twice the length of minuette wave (a). This means this part of the wave count has an exceptionally low probability.
I have not been able to see a solution which resolves this problem for this wave count.
My conclusion at this point in time is this alternate has further reduced in probability.
Within minor wave 3, no second wave correction may move beyond the start of its first wave below 1,219.88.
TECHNICAL ANALYSIS
WEEKLY CHART
Click chart to enlarge. Chart courtesy of StockCharts.com.
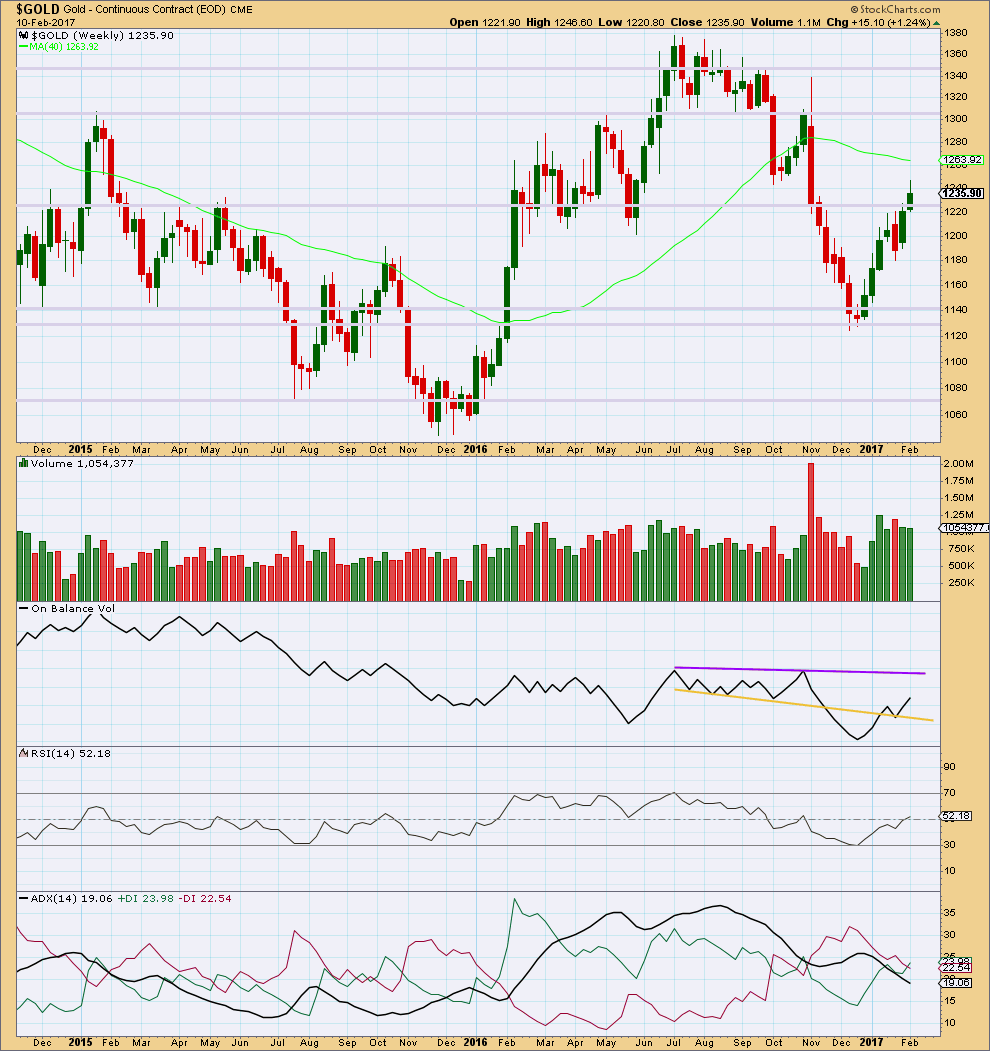
The long upper wick and smaller real body on last week’s candlestick is slightly bearish. The decline in volume is also bearish.
The strongest weekly volume in recent weeks is a downwards week, and this too is bearish.
On Balance Volume is some distance away from resistance.
ADX continues to decline indicating no clear trend.
DAILY CHART
Click chart to enlarge. Chart courtesy of StockCharts.com.
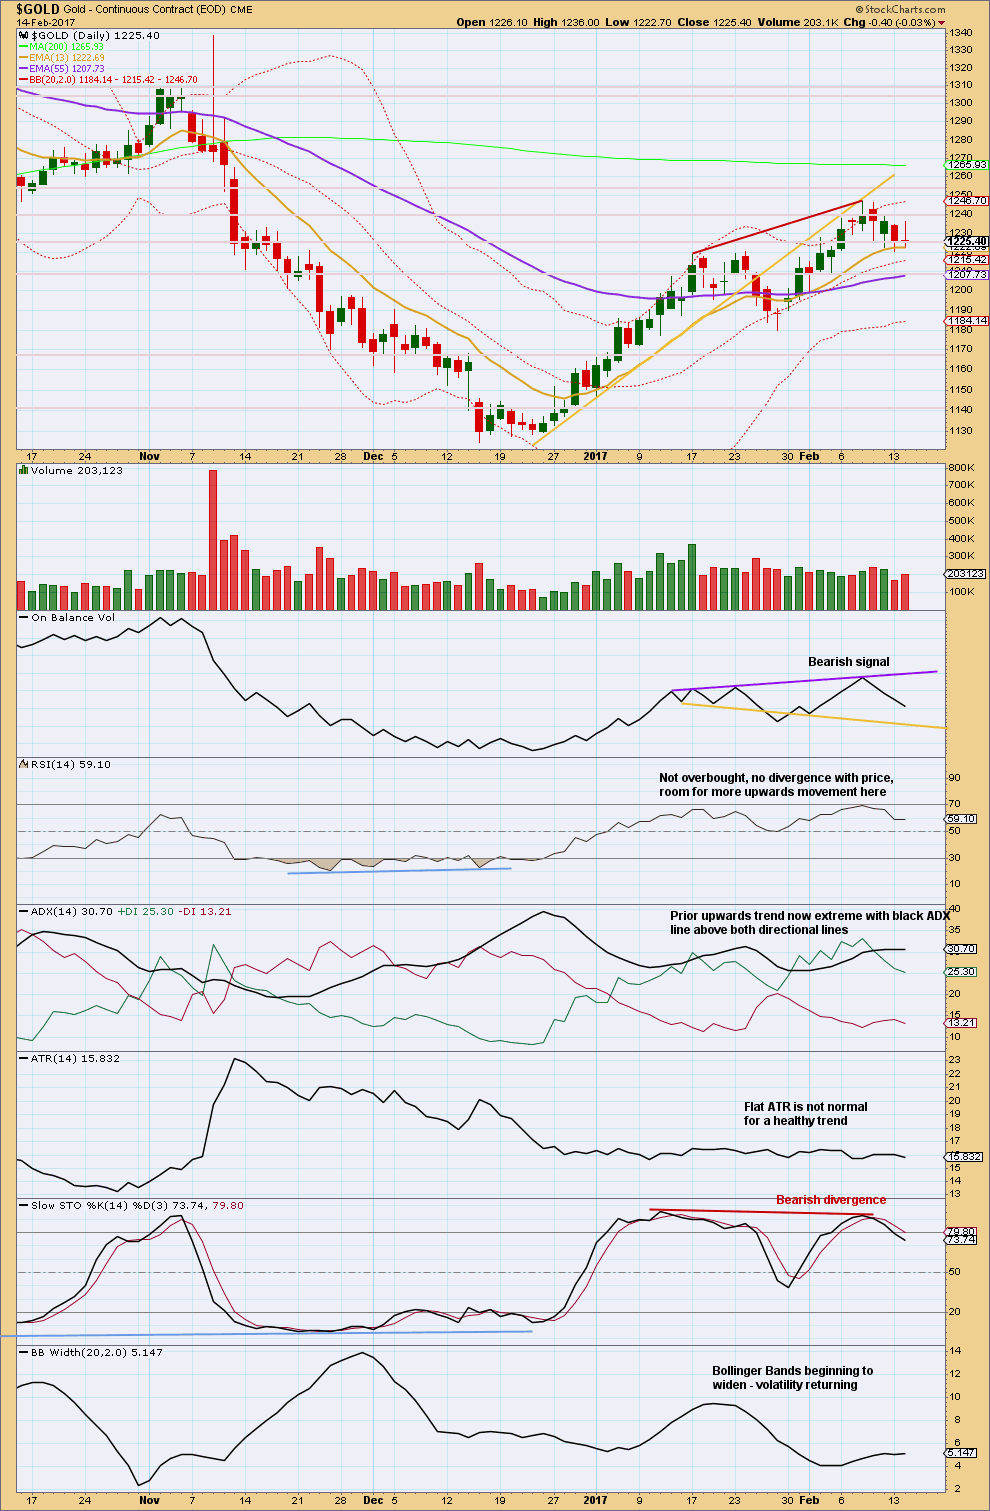
Price moved higher for Tuesday’s session but the candlestick closed red and the balance of volume during the session was downwards. This volume shows an increase beyond yesterday, so there is support here for downwards movement today. This supports the main Elliott wave count.
Today’s doji with a long upper wick is bearish.
Price is finding resistance about 1,240 and support about 1,225. Next support is about 1,205.
After reaching extreme with ADX for the last upwards wave, a pullback here is a reasonable expectation. It should be long lasting enough and deep enough to bring ADX down from extreme and Stochastics back down from overbought. That has not happened yet.
GDX
DAILY CHART
Click chart to enlarge. Chart courtesy of StockCharts.com.
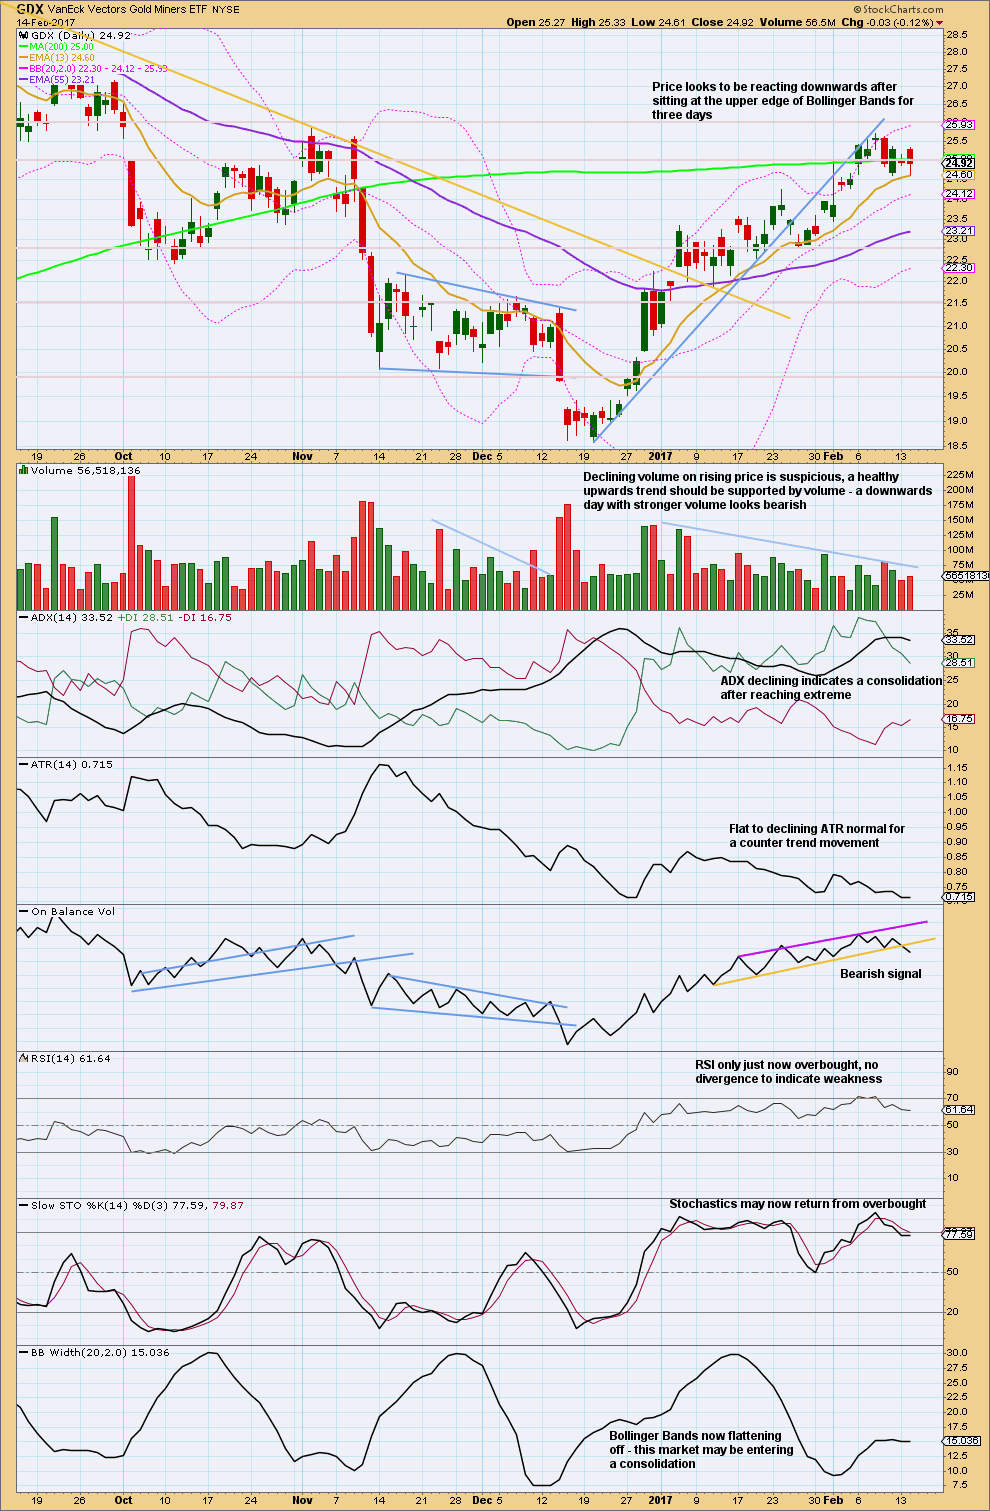
GDX today has a good bearish signal from On Balance Volume. These trend line breaks by OBV should be given reasonable weight. This indicates it is likely now that GDX may break below the short term Fibonacci 13 day moving average.
This analysis is published @ 05:23 p.m. EST.
Had a bankster raid on my DVN short position. I can smell these guys a mile away and got a little help from my friends. Nice candle huh? We should take out 43.00 over the next week as they run for cover. Bankster Bullies!! 🙂
Perhaps we’re just finishing micro ‘e'(purple) of a triange of subminutte 4 (orange).
Soon to proceed up in subminuette 5 to complete Minuette (c) of Minute iicrc.
Any thoughts?
Upwards movement is so far hitting resistance at downtrend line drawn on hourly chart from top at 1236. There is a nice channel sloping down with recent lows.
Aha. I see that. Yes, that’s perfect. I’ve drawn it in lilac.
Draw another trend line from the high which is the end of minor B, to the first correction that I have labelled minuette (ii). I’ve drawn that in cyan. That may be where minute ii ends.
I cannot see a triangle here which would meet all EW rules.
Thanks for your input…Lara.
Maybe a series of 1’s & 2’s?. Could the correction already be complete?
If so, would not have reached a retrace of 0.618 of Minute icrc yet.
Minuette (a) reached 1,234.51 which is just below the 0.618 Fibonacci ratio at 1,235.09.
So it’s already pretty close.
Look for a five up for minuette (c). As soon as it gets above the end of minuette (a) at 1,234.51 then it could end. But I’m picking it to be a very deep second wave correction at the target.
I agree, this looks like an expanded flat unfolding. But it’s not complete.
This looks like minute ii continuing. This was a possibility and why I left the invalidation point at 1,244.89. It looks like it may be a very deep second wave correction.
Minuette (c) is very likely to move at least slightly above minuette (a) at 1,234.25 to avoid a truncation and a very rare running flat. The target for minuette (c) assumes the most likely Fibonacci ratio to minuette (a).
Another **&%^%@## expanded flat???!!
!@#$ Banksters!! 🙂
Makes sense – an impulse up at submin degree to complete minuette c of minute two….
I’m starting a band…having t-shirts made…”Expanded Flat”…and I’m gonna put the 2017 gold prices on the drum set as a logo…:)
Well, they are really common structures. And when they turn up they confuse almost everyone.
Definitely…:)…and hats off to you for interpreting it all. No easy feat! Thanks for everything you do.
‘cept us, of course! 😀 😀 😀
SLV normally leads the turn. May also be indicating this move up corrective.
Yep. Silver so far today has a lower low and lower high and a red candlestick.
Gold so far has a lower low and lower high but a green candlestick.
This may have been an expanded flat to end minute ii. B wave was 1.61 x A wave. C wave ending just above 1230 was 1.618 x A wave.
For now, I see what Daniel is seeing based on MAIN ct:
Minute iic (pnk) not complete
Forming a Minuette (grn)a-b-c
Now working on completing ‘c’
I’m working on premise that ‘b’ overshot to downside, about 1216.74(Investing.com)
Currently close to 50% retrace of Minute ic(pnk)
Still has further to go to upside- 1234ish to surpass ‘a’ for a flat?
Yes. This is it.
Minuette 1 ended at 1222.14.
Minuette 2 is an expanded flat, 1222.14 – 1230.49 – 1217.05 – ?
For subminuette c = 1.618 subminuette, target is 1230.56.
for the 5-wave subminuette c, target is 1231.17, where micro 5 = micro 3.
Some clarification. This is for the Main Count.
I take it that Minute 2 is completed at 1234.25.
The value of 1222.14 for minuette 1 refers to Minute 3 down.
If considering the Alternate, then Minor 2 is incomplete. The rise is for Minute B, and could go up to 1235 for a 0.618 retrace.
The only thing that makes any sense to me is that minute two is incomplete…this is not a third wave down…
This is nuts! Gold up, Dollar up, Equities up, Euro up…what the h-e double toothpicks is going on with these markets??!!! 🙂
Not much movement on 11.00 puts, even with price down 3%; bid/ask spread also totally ridiculous. The miners made a low that has not been exceeded three days ago and that is starting to be a problem. We could be getting a warning here that at least with the miners, something else is going on. I am exiting my short positions at the close if we don’t see those prior lows taken out during today’s trading session.
Attribute this to inertia. Many people are sold to the idea of rising, probably even rocketing, gold prices. Yet, the short-term trend is down.
This is the same case as S&P. Nobody believes that the sky will ever fall on stock prices, what with Trump and Yellen leading the charge. This means that everyone including their grandmothers are holding on the stocks and miners until circumstances trigger an exit.
Gold prices may rise or fall, but derivatives, such as mining stocks, are neither here nor there.
My thoughts on the Alternate count.
Needless to say, as labelled, Minor 2 is invalidated.
My rework is that Minor 2 is 1244.49 – 1219.88 – 1234.25 – ?
Minute C would follow the 5-wave down of the Main count what I tabled below. It should end at 1194-1195. In terms of Fibonacci ratios, Minute C = 1.618 Minute A at 1194.43. Also, Minor 2 = 0.786 Minor 1 at 1194.91.
In the scenarios I described for the Main and the Alternate, the rise from the 1193-1195 region will be the arbiter between the two counts. For the Main, it should not rise above 1234.25; in the weird case, the invalidation is 1244.49. For the Alternate, the rise must exceed 1244.89. In fact, I target 1297 for Minor 3 at 1.618 Fib. It could be lower at Minor 3 = Minor 1, target 1258.
My apologies for a surfeit of information without a diagram. I haven’t found an easy to use (free) chart for annotation purposes, and I write much faster than I draw.
Comments always appreciated!
thanks Alan
The miners are starting to look like some sort of triangle…
Hmm. The movement today is really confounding (not confusing).
I think I finally got it figured out.
The entire move down from 1234.25 (Minute 2) to the low of 1217.05 is minuette 1. The steep rise to the current high at 1227.18, almost 0.618 retrace, is minuette 2.
If correct,
(a) the rise in price should halt (invalidation point = 1234.25), and
(b) the drop from there should be deep, minuette 3. At this point, minuette 3 target is 1200, depending on where minuette 2 ends.
Further movement in the 5-wave down yields Minute 3 around 1193. This gives about a 1-point difference from 1194, the 1.618 Fib for Minute 3 vis-a-vis Minute 1.
Euro showing the same weird trading pattern as Gold…gap also now filled…
I’m convinced gold will never drop in the history of mankind…haha.
Haha. I don’t think the corrupt banksters would ever agree. They are hell bent in suppressing gold (and silver) prices in order to boost stock prices, as well as to lend credence to their fiat money. Money supply they can easily control digitally, but not physical “barbaric” gold. They can manipulate oil because it is tied to the petrodollar. It is only when countries start to discard the use of the US dollar that … “persuasive action” is resorted to.
was that the whole movement down?
Idk…looking at 4hr and 1hr looks like room for higher prices when looking at RSI and MACD, but I could be wrong. 5 minute looks bearish. Conversely, DXY looking very bullish on the 5 min (obviously)…so it’ll be fun seeing what this does. Others have more experience, so let’s see the other comments as well.
I do like looking at money flow…which is low across time frames…so that’s encouraging (from a bear perspective)
Loved the Trading Room video this morning. The Trading Room concept adds value to this subscription for me. Thank you.
You’re welcome 🙂
The algos continue to work overtime, aggresively buying The dips. Unfortunately If recent pattern holds, price will spend the trading session steadily moving higher off this morning’s low….very annoying!
t
It is looking like we should get a decent move down this morning so I will be rolling the JNUG 11.00 puts with a 20% or better pop. Same strike, but from March 17 to March 10 to reduce premium outlay and compound gains on any further decline….sitting tight on 11.50 puts….
I like the move, Verne. Considering that the next Fed meeting is on March 15th, you’ll be in front of the rate hike decision….. currently at a 40% chance per Bloomberg which is up from 34% from yesterday. With inflation getting hotter based on the numbers released this morning, it raised the chances of the Fed needing to move faster.
Yep. It is really looking like the counter-trend move up in bond prices is done, which means higher interest rates from here…the FED will have to follow the market…
The aggressive buying in the precious metals had also had me thinking this correction would be quite shallow. The one uncertainty in my mind is that the dollar has just resumed its uptrend in what might be a fifth wave of an impulse, so a shallow fourth wave would have both Gold and the dollar in an uptrend, not that this is without precedent of course…I think the 1160.00 area should hold for a relatively brief move down….
Yes, Dreamer, I agree with the triangle. The degree of fall with a triangle would fit with the projected corrections for NZD/USD, USD/JPY and the EUR/USD – in other words I don’t think the correction will that deep for gold.
Yep, I think the correction may be shallow and may stay above 1,200. If the triangle does play out, then a quick 5 wave structure down and it could be time to buy. Let’s see how this develops.
A lot of sideways movement for Gold. Is a triangle possible?
https://www.tradingview.com/x/TZga5AHu/
Thanks for triangle idea. Fits with MACD hovering around zero.
Nailed it
Small H&S pattern in play for GDX
https://www.tradingview.com/x/hZc1jcEH/
Hi Lara,
thank you very much for the Trading Room videos, they are great!
Regards
Ursula
Awesome! So far so good….
Good for bearish positions to see the OBV break to the downside in GDX.
Here’s hoping I can roll those JNUG 11.00 strike puts with a good droopage (as Tim Knight would say) in the metals tomorrow. Thanks for the update and calming of frayed nerves Lara! Sitting in a trade is a new experience for an inveterate scalper… 🙂
LOL
How long have you held this one for now Verne? And how long would you normally have held a trade?
I am embarrassed to tell you that my trades, unless they are spreads, time-wise can usually be measured in days, and not infrequently in hours! I do make intermediate and long term trades as well but on the metals and currencies it tends to be hit and run. I am afraid I am so accustomed to the maxim of “never leave profits sitting in this market” , I failed to explore the approach of not just making momentum trades, but letting the waves play out when the trend is clearly established. Always something new to learn…. 🙂
I have been sitting on this one for THREE whole days! An ETERNITY!! The 11.00 strike puts were added just today…. 😀 😀 😀
LOL
Nothing you ever say would be embarrassing, I am pretty certain that you are a much better trader than I am. I’m better at analysis than trading, and I’ve not been trading for nearly as long as you have.
My biggest weakness has been learning when to take profits. Occasionally I get it right, and that’s when I’m really controlling my emotion.