
Price made a lower low and lower high today, the definition of downwards movement. Overall, this was expected.
But the session closed green with a strong bounce and that was not expected as the most likely scenario, but it was allowed for.
Summary: The target for a deep pullback is at 1,148. Corrections along the way down present opportunities to join the trend.
Follow my two Golden Rules of risk management:
1. Always use a stop.
2. Invest no more than 1-5% of equity on any one trade.
New updates to this analysis are in bold.
Last monthly and weekly charts are here. Last historic analysis video is here.
Grand SuperCycle analysis is here.
MAIN ELLIOTT WAVE COUNT
DAILY CHART
Click chart to enlarge.
This main wave count has a better fit for prior movement. To see the difference between this main wave count and the alternate below please refer to last historic analysis linked to above.
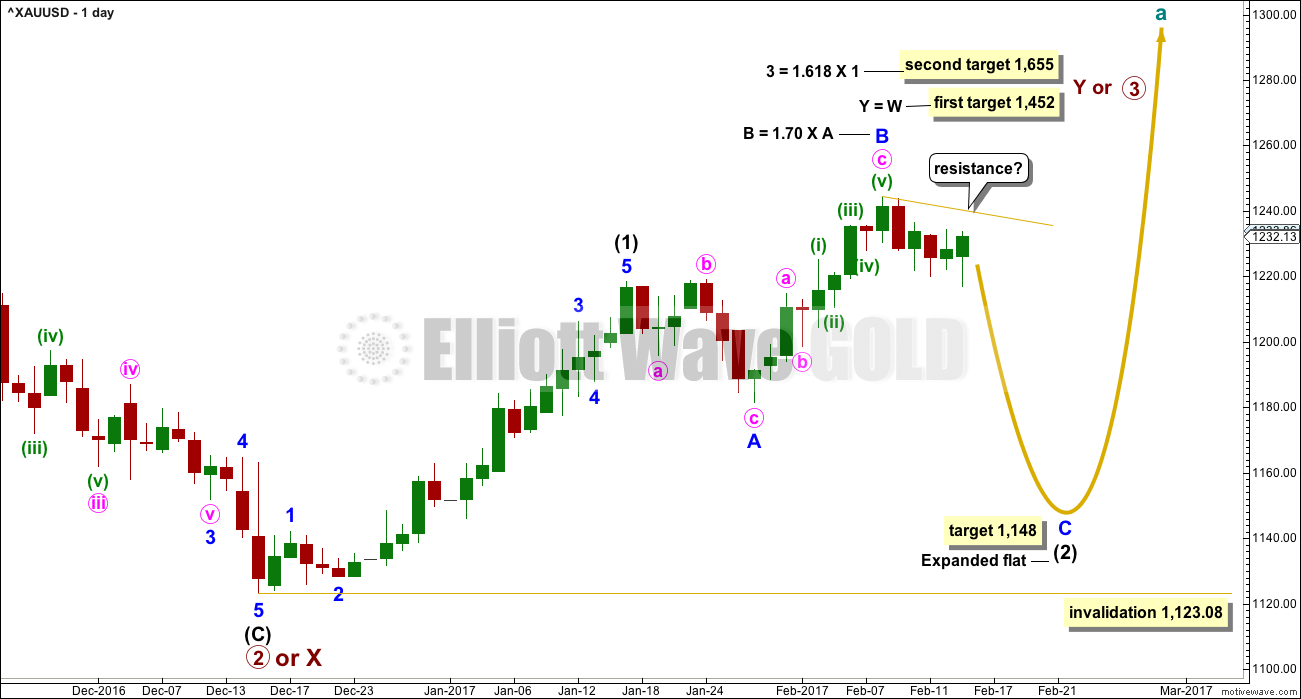
This main wave count expects Gold has had a primary degree trend change in December 2016. The new upwards wave is either a primary degree third wave, or a primary degree zigzag to complete a double zigzag.
Intermediate wave (1) is an impulse that may have lasted 23 days, two longer than a Fibonacci 21. Intermediate wave (2) may be unfolding as a very common expanded flat correction.
Within intermediate wave (2), minor wave A fits best as a regular flat and minor wave B is a zigzag. Minor wave B is longer than the common length of 1 to 1.38 times A, but within the allowable convention of up to two times the length of A.
The appropriate target for minor wave C is 2.618 the length of minor wave A.
So far intermediate wave (2) has lasted 21 sessions. Minor waves A and B have lasted a Fibonacci eight sessions each. If intermediate wave (2) exhibits a Fibonacci duration, it may be a total 34 sessions.
Alternatively, intermediate wave (2) may not exhibit a Fibonacci duration.
HOURLY CHART
Click chart to enlarge.
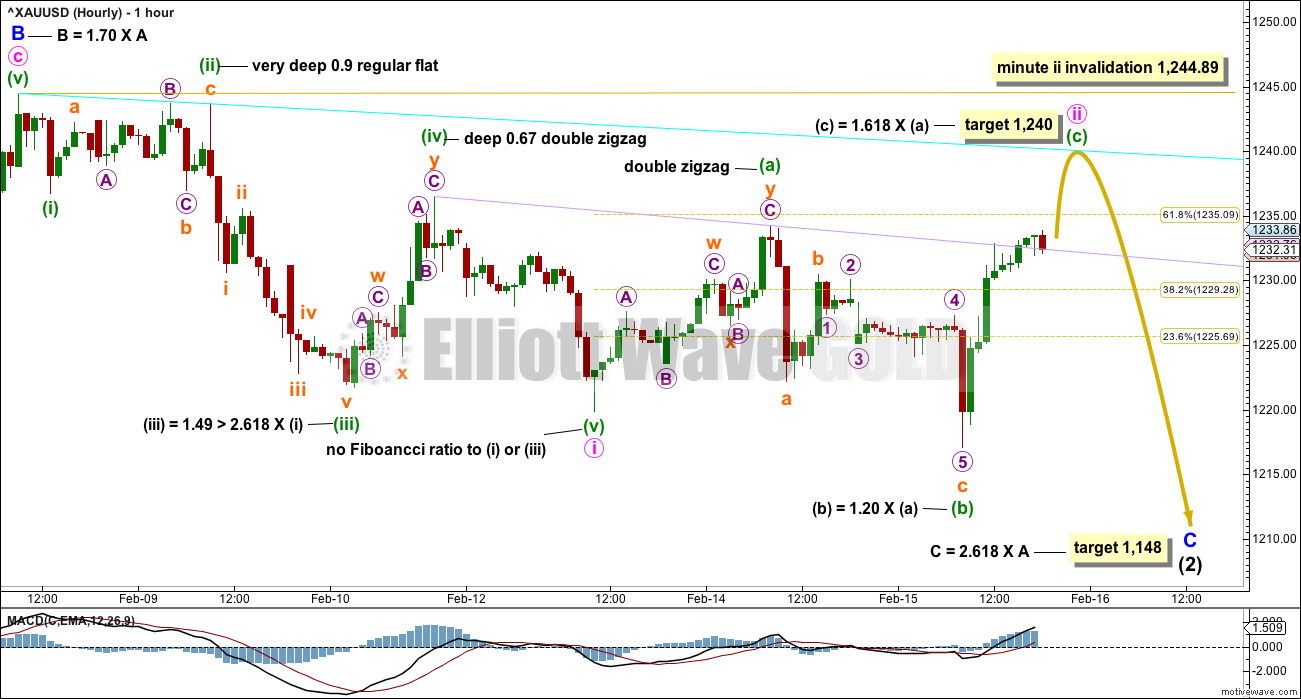
Minute wave ii is not over and is most likely continuing further as an expanded flat correction. These are very common structures.
Within minute wave ii, minuette wave (b) is 1.2 times the length of minuette wave (a). This is within the common range of 1 to 1.38.
The target for minuette wave (c) assumes the most common Fibonacci ratio to minuette wave (a). It may also see price come up to touch the cyan resistance line.
When minute wave ii is over, then a base channel may again be drawn about minute waves i and ii. Minute wave ii is expected to be very deep because this is reasonably common for the first in a series of Gold’s second wave corrections within its new trends. When it does this, it introduces substantial doubt as to the trend and convinces us there is no new trend right before a third wave takes off in the opposite direction. Be aware of this psychology.
The next wave down for minute wave iii should exhibit an increase in momentum.
ALTERNATE ELLIOTT WAVE COUNT
DAILY CHART
Click chart to enlarge.
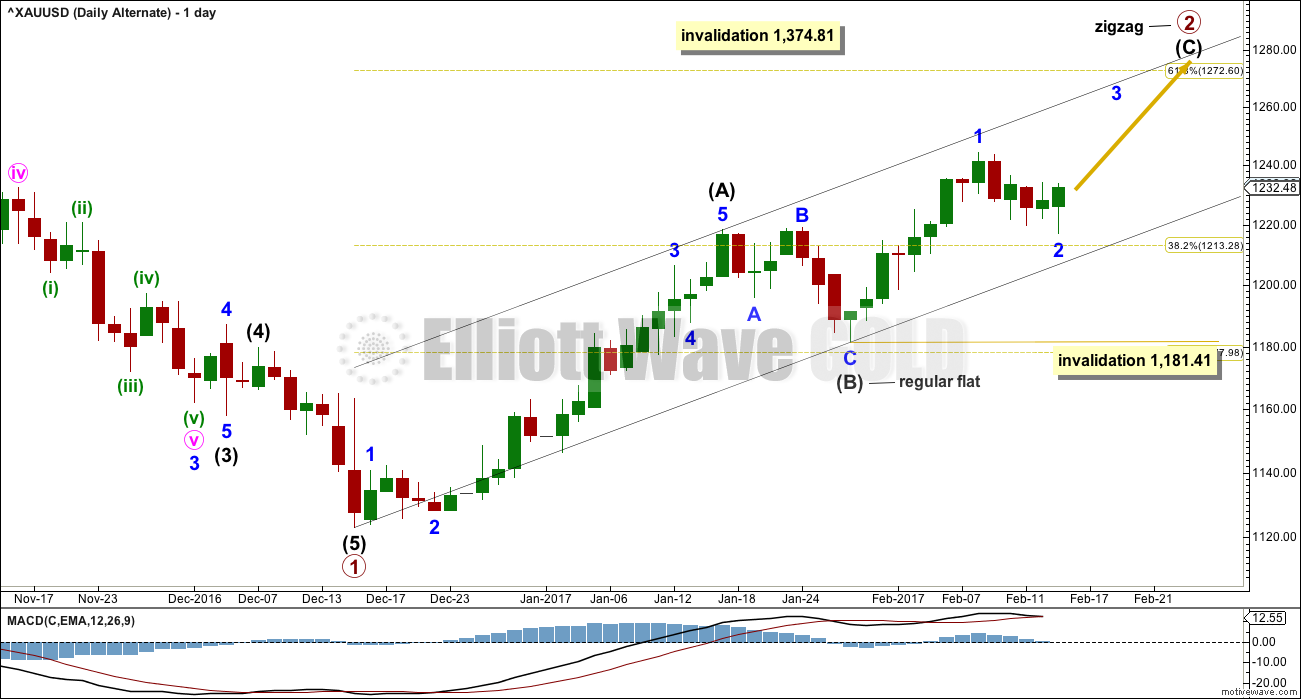
This alternate wave count expects that Gold is still within a bear market. Targets for new lows can be seen on weekly and monthly charts.
Within the bear market, a primary degree correction is underway.
Primary wave 2 is most likely to subdivide as a zigzag. Intermediate wave (A) is complete.
The alternate idea reverts back to seeing the correction here labelled intermediate wave (B) (and for the main wave count it would be labelled intermediate wave (2) ) as a complete regular flat.
The next five up, for this alternate labelled intermediate wave (C) (and for the main wave count labelled intermediate wave (3) ), may have begun.
Within the impulse upwards, a first wave labelled minor wave 1 may now be complete. Minor wave 2 may not move beyond the start of minor wave 1 below 1,181.41.
Primary wave 2 may not move beyond the start of primary wave 1 above 1,374.81.
The long lower wicks on three of the last four daily candlesticks offers some support today to this wave count.
HOURLY CHART
Click chart to enlarge.
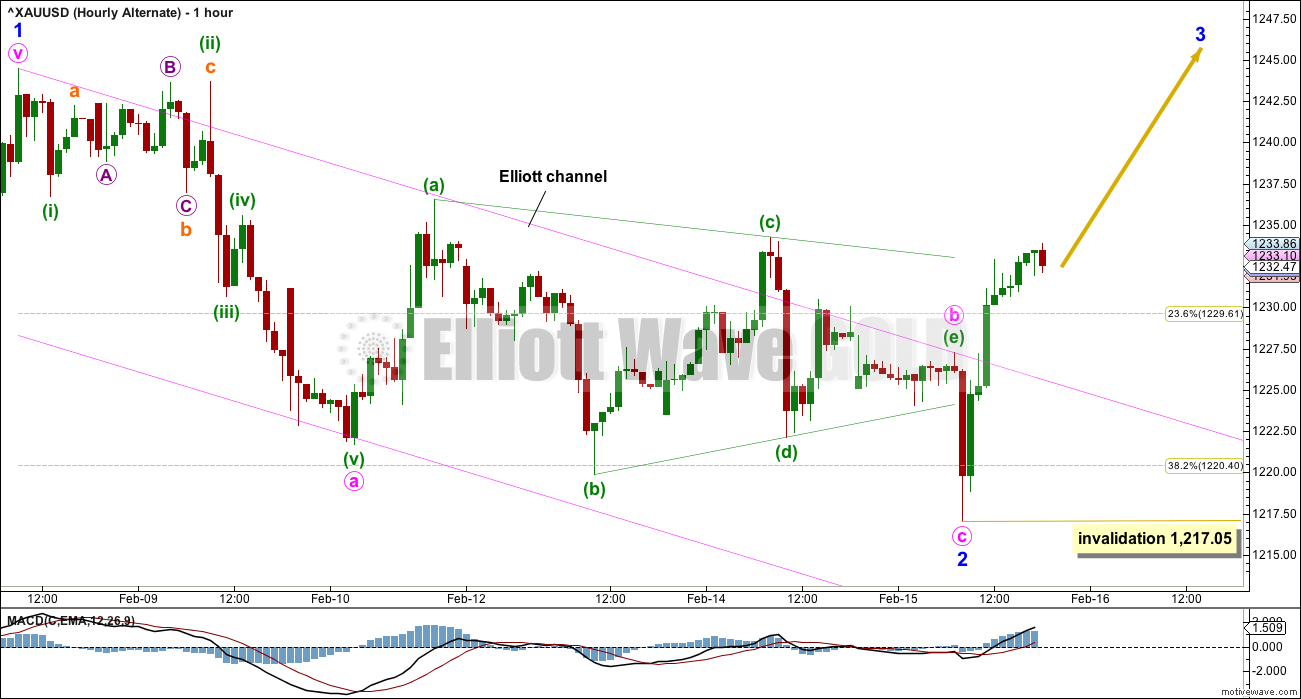
Minor wave 2 may have continued lower. Within minor wave 2, a triangle may be seen for minute wave b. However, this triangle looks forced: minuette wave (e) falls too far short of the (a)-(c) trend line for a normal look.
There is no Fibonacci ratio between minute waves a and c.
It is possible that minor wave 2 could continue lower as a double zigzag. If a new low below 1,217.05 is seen, then that would be the option. However, minor wave 2 should find support at the lower edge of the black channel on the daily chart and this does not allow for much more downwards movement for this alternate.
If that black trend line is breached, then this alternate wave count would be discarded.
TECHNICAL ANALYSIS
WEEKLY CHART
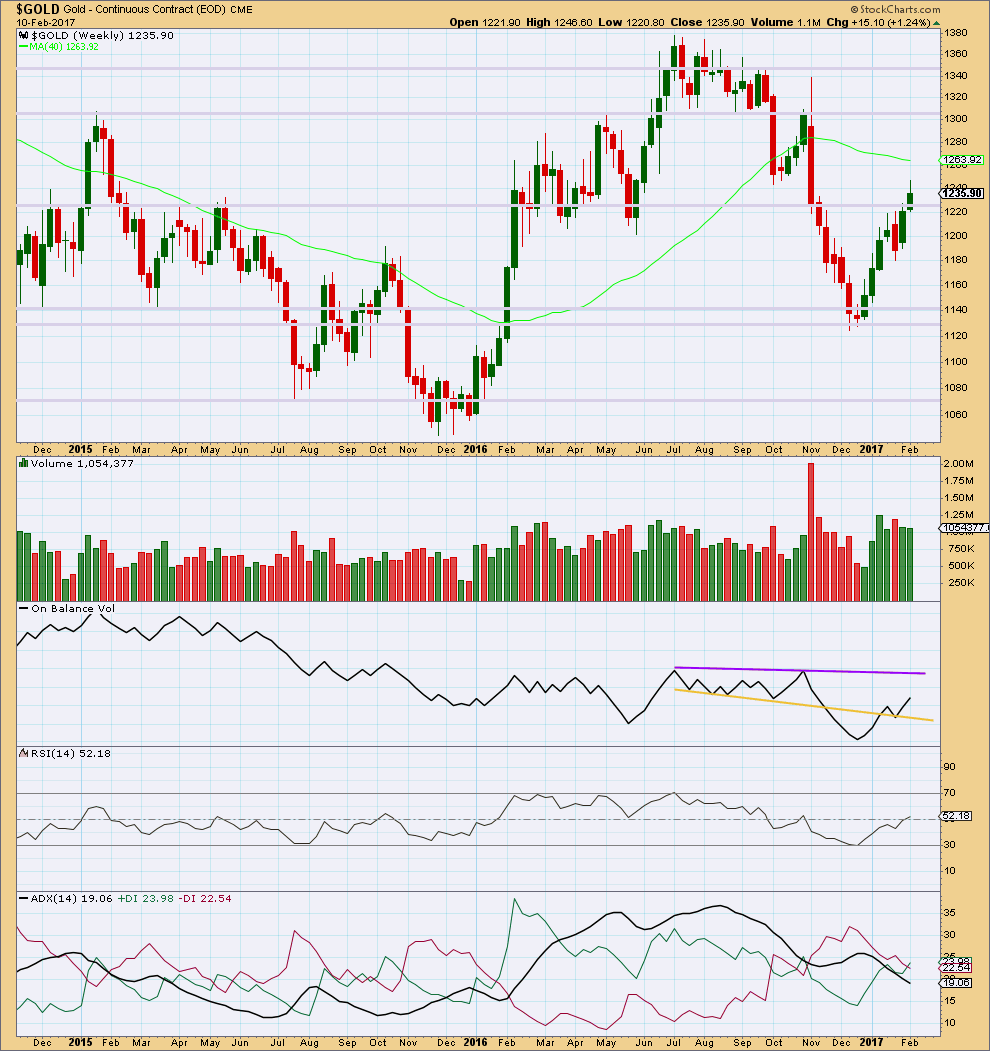
Click chart to enlarge. Chart courtesy of StockCharts.com.
The long upper wick and smaller real body on last week’s candlestick is slightly bearish. The decline in volume is also bearish.
The strongest weekly volume in recent weeks is a downwards week, and this too is bearish.
On Balance Volume is some distance away from resistance.
ADX continues to decline indicating no clear trend.
DAILY CHART
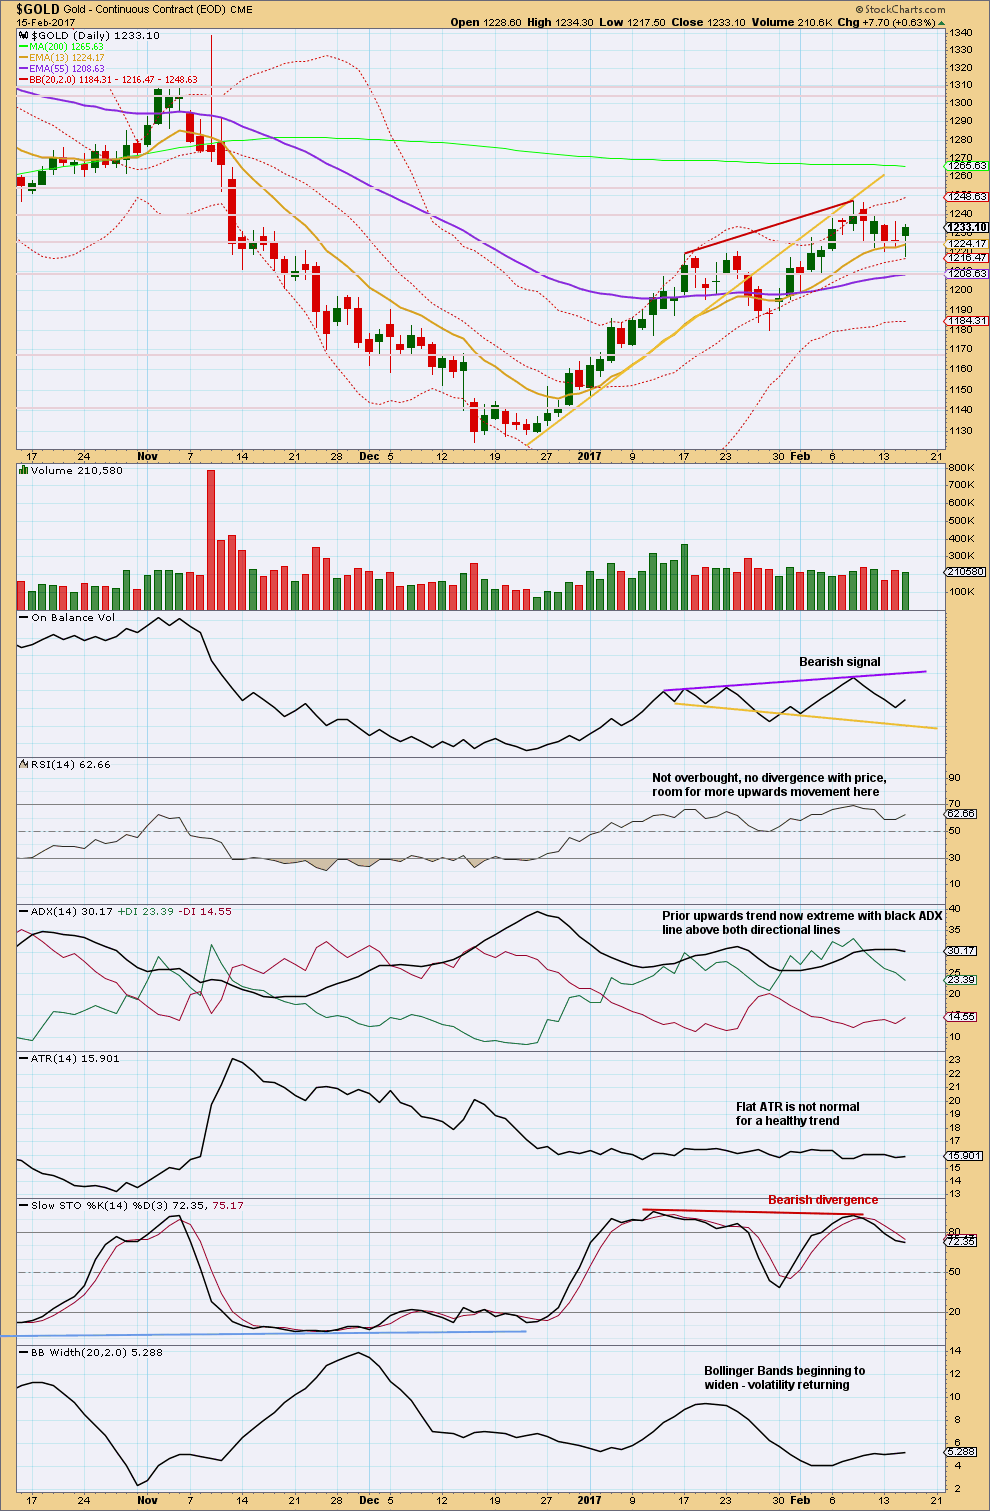
Click chart to enlarge. Chart courtesy of StockCharts.com.
Price made a lower low and lower high today, the definition of downwards movement. However, the candlestick closed green and the balance of volume for the session was upwards. A decline in volume from yesterday’s balance of downwards day indicates more support yesterday for downwards movement during the session than support today for upwards movement during the session.
On Balance Volume has some distance to travel before it finds support.
ADX is now extreme, so a pullback should be expected.
GDX
DAILY CHART

Click chart to enlarge. Chart courtesy of StockCharts.com.
The bearish signal from On Balance Volume yesterday should still be given weight. OBV may be coming up now to back test resistance at the line. If it moved down tomorrow, that would strengthen the bearish signal.
The balance of volume for this session was upwards and it shows a reasonable decline. There was not support during the session for upwards movement. This is bearish.
This analysis is published @ 07:20 p.m. EST.
Classic. Chart action will not declare itself one way or the other before the close. Tonight/tomorrow will be the tell. Only thing on economic calendar tomorrow is retail sales.
Don’t forget to factor in a 3 day weekend, so I’m expecting some profit taking across all sectors tomorrow.
Even if Gold breaks to the downside, I can’t imagine holding a short position over a 3 day weekend.
We will probably see the entire thing unfold after hours…that’s the way they roll…😛
What is going on now with Gold reminds me of how price was acting in SPX just before its own recent third wave up….
(I may be jumping the gun here but nothing about this price actions suggestive of an imminent third wave down. I am buying a small GLD position via Feb 24 118.00 callls @ 0.90 per contract. If I get ambushed by the banksters and we head South, will hedge by selling 115.00 strike calls.
Okay, this one’s for you Melanie. 10 minute chart for the main wave count.
Yes, a five up could be very close to completion.
And this actually looks better than a very bullish alternate, which would be just a series of six overlapping first and second waves. That idea looks less likely because momentum is weakening, if price is winding up to move through the middle of a third wave at multiple degrees it should be strengthening not weakening.
Lara,
Thanks so much for doing this and making sense of a SLOW moving Alternate 1s &2s count as being the weaker alternative.
I was close w/my subminuette count, but was having a Very hard time, likely because as you point out, those 2s & 4s are quite disproportionate.
Again…thank you for the guide.
I’m always wary when a comment has the “no offence” in it… that usually isn’t good.
And it’s unclear if your comment was directed at me or Melanie? Because my 10 minute chart has nothing about volume….
Anyway. We have a smaller range day with yes, lighter volume. On Balance Volume is still below resistance. I will give this a fair amount of weight.
Because if today was the start of a third wave up at two degrees (see the alternate daily chart I’ve published below in comments) then upwards movement should be clear, strong and supported by volume. It’s not.
Perhaps new high will represent end of a contracting diagonal minuette fifth wave.
I think I have identified one source of confusion. My alternate daily count is actually also an alternate weekly. And I’m trying to use it to show an alternate also for the main.
So that’s rather confusing isn’t it.
At this time because the main and alternate weekly counts don’t diverge, I’m going to stop publishing anything daily that covers that longer term alternate.
I’m going to change the labelling of the alternate count to a true alternate for the daily chart.
So instead of A-B-C up it will be 1-2-3.
Then it will be clearer that the alternate calls right here right now for a third wave up already underway at two degrees.
Where the main count sees only a second wave correction, very deep, ending soon.
This is what the alternate idea looks like. A third wave up at two degrees.
If price does break above 1,244.49 this is why shorts should be closed and longs opened.
Flexibility. Jump on the opportunity if it presents itself, but the balance of probability still points to the main count being more likely, and this alternate less likely.
Hi Lara,
I appreciate your chart published @ 1:45pm. I see where (c)=1.618 x (a).
IF Minute ii has ended @ 1240, I cannot make sense of a count in 5 waves.
Could you show how it would count on a chart. If you feel it is too premature, I understand.
Currently, I am hedged and ready to pull the trigger on which ever direction wins out.
A very pertinent question. I’ve spent some time this morning on the 5, 10 and 15 minute charts.
I can see a five up complete but it has problems of gross disproportion.
And so I tried the devils advocate view of looking for a very bullish alternate scenario. (I don’t like being a devils advocate though, I think the devil has far too many advocates about already 😉 ). What I come up with there actually looks worse. There would now be six overlapping first and second waves, and they’re coming with some reasonable decline in momentum so that just looks horribly wrong.
I have not got a solution yet for you. Still working on it.
My conclusion for now is one more high at least. I’ll publish a 5 minute chart when I am comfortable enough with my count.
May have tri-star reversal pattern on GDX hourly chart.
Verne, what did you make of the indicies and VIX yesterday? That is one massive divergence from normal. I’ve never seen anything like that before.
I have been in non-stop exchanges with a few other folk I know who watch volatility and we all think it was remarkable. As you said, unlike anything any of us has ever seen. Something huge is brewing no doubt. There are rumors that a hedge fund unwound a 17 B position. As you can probably guess, I jumped on that divergence for one of my infamous 10X trades via SVXY 135 puts! I suspect we are not done…
Thank you Verne. Yes, I did figure you would have jumped on that one.
Although we’ve seen small divergence a very few occasions recently, that one yesterday was just massive. It was just asking for you to bank some big profits 🙂
That move from high yesterday (SVXY) to low this morning was something that usually occurs over days! I have a sneaky feeling it’s just a warm-up for what’s coming. It seems as if the whole world is convinced
( understandably!) volatility is dead. We will in all likelihood test or exceed yesterday”s extremes- the best trading set-up I have seen in quite some time…😍
Interesting. The only problem I see with that theory is that the size of the move in volatility was entirely at variance with broader market sentiment recorded just the day before- three year DSI highs! Traders don’t all suddenly decide they need insurance while the market is making a series of all time highs. What we saw 8yesterday was much more typical of the kind
of fear seen at capitulation lows. I honestly do not understand what happened yesterday or
what it means. It is unlike anything I have ever
seen-a bit sobering really…in uncharted waters imho..
So far Gold is doing as expected, and is right now at the pivotal point. The main count calls for a quick reversal here. The alternate calls for price to continue higher with a strong increase in momentum.
This is one approach to this market at this time:
If price makes a new high above 1,244.89 all shorts should be closed, be ready to open a long position. I’ll be setting an order to do that automatically for me so I don’t have to sit and watch the chart, that approach also takes emotion out.
If price reverses here then wait for a support line breach. I’ve drawn one here in bright green. If that happens then enter short. I’m already holding a small short position, I’m looking to add to it today.
Ha. Trying to set a limit order to open a buy if price makes a new high here… and it won’t let me.
I guess I’ll just have to watch my screen today 🙁
Don’t you mean a stop buy order? If you tick the limit box it won’t let you because limits are for trades in the opposite direction.
That GLD candle looking rather weak. Expanded flat still in play methinks…gravestone doji?
We will probably see another rapid final wave down to coindide with a final SPX fifth wave. I am done trying to catch th declines….banksters are too quick. I will open a contingency order to buy the next dip.
I agree. On the daily chart this candle has a small real body.
Remember, the alternate count calls for Gold right now to be within minor 3 of intermediate (3). Price should be rocketing upwards with large real bodies and long lower wicks. It’s not doing that.
This does not mean it can’t begin to do that tomorrow, it only points to the balance of probability still being with the main count.
The main count calls for a lower degree third wave about to begin, not already underway, and only one degree. Not two.
With that in mind look again at the daily charts.
Hi Verne and Lara,
I see a teaching moment for me here regarding the body of the candle. While the GLD daily candle appears small, it doesn’t account for the gap up open so it appears smaller than say the daily gold body on PM Bull. Which one would you give more merit since they do appear as two different candles?
Thanks!
I think your question is asking to pick which data feed to give more weight to? If I understand correctly?
The gap on the BarChart data looks like a pattern gap. These are commonly filled. The small real body does not look as bullish as the alternate count calls for.
On PM Bull data there is as you note no gap. The real body for todays candlestick is bigger than on BarChart data which is a bit more bullish. It’s still smaller than the recent red bodies though, and so for the alternate count it still doesn’t look as bullish as we would hope for confidence.
Thanks for your response!
I was thinking that both you and Verne were talking about the candle related to the GLD ticker…. trading at 118.10 currently. This candle does have a very small body but doesn’t account for the gap up at the open.
From any of the 24 hour gold feeds, the candle is much larger reflecting the $8 or so gain.
It sounds like I may have interpreted things incorrectly within your exchange. I guess I didn’t see the current candle on the 24 hour feeds as a gravestone doji but can see that being interpreted using the body of the GLD ticker.
Thanks!
Yep! 🙂
Selling APC 70.00 strike puts. Will roll profis to 68.00 strikes on upcoming bounce…
The dollar index has not too much more room to fall in second wave of 5, so think gold will turn down soon
That monster gap down looking way more bearsih than a second wave to me…
The good thing about the current price action is that if we are starting a third up, the best is yet to come…Mr Market is allowing ample time to get positioned…volume on miners tepid…
Taking the money and running on bullish spreads…waiting for confirmation…
If GDXJ takes out 43.00 today I will be adding 45.00 strike calls…
Need to see high of 1244+ taken out to have confidence in third wave. Volume in miners not impressive so far and upwards movement since low of yesterday is wedge-like.
When the market moves against my position, I pay attention to whispers as well as
shouts…😛
Brazen move by Gold price; hard to see this break below 1235 for 1228; what’s to stop Gold price to take out last week high 1244-45 for 50% retrace H 1375 / L 1123…. ?
Looking now to me as If preferred trade in this market is BTD.
That is what the algos are doing…
JNUG broke upwards from same sort of triangle formation. Sometimes the initial break quickly reverses, but apparently not today…closing 11.50 puts for a loss, holding put spreads at modest gain so far…
Exiting my experimental Jnug 11.00 puts.
FWIW, I have observed over the years that when an expected third wave fails to materialise, there is a better than even chance it will not, and the count requires adjustment…If you have to ask If it is a third wave,it is not…
Truer words never spoken! Expect the unexpected! 🙂
Except both counts are calling for a third wave. The main count a third wave down, the alternate count a third wave up at two degrees.
While price remains below 1,244.89 I’m going to have to hold that the main count has a higher probability because the subdivisions have a better fit. And because classic TA sees the prior upwards trend as still returning from extreme with OBV bearish.
Barrick Gold (ABX), the largest miner in GDX just announced very strong earnings yesterday after the close
http://seekingalpha.com/article/4046522-barrick-gold-blowout-earnings
ABX up over 7% today
Decision point soon…
https://www.tradingview.com/x/KoGXuSsU/
Gold is back testing breakout from a 1 hour inverse HNS bullish pattern at the neckline now.
At 1236 is critical to hold. If it does than gold target is 1245+ .
The moment of truth approaches. If this does launch into a third wave down, it will be a horrible bull trap with recent bullish trendline break and swing low. Would make my day though!
The bullish reversal candles in Gold, Silver, and Miners has me considering that the correction in GDX may be over, although volume does not support a GDX bull move yet. GDXJ was weaker than GDX today which leans bearish.
Volume for Gold and Silver was solid. The quick move down out of the Gold triangle today , followed by a swift move up was also very bullish.
So I am showing a possible bull count for GDX today with a bear move down toward 22.72 still possible if there is no upside follow-through tomorrow. We are at a critical point now.
https://www.tradingview.com/x/c01dyqxW/
SVXY, the leveraged inverse VIX futures ETF printed a red candle yesterday while all the indices continued to cavort above their BB with strong green candles, a very notable divergence. I had intended to exit short positions after that strong bounce off the move down yesterday but decided to wait for the 1244 invalidation point. The pattern has been sharp reversals and it is entirely possible that we saw another one yesterday. We should know in a few hours.
Did the $USD top today?
https://www.tradingview.com/x/f1qWBmfN/
http://www.gold-eagle.com/article/are-you-still-waiting-pullback
Published Feb 7, but unlike Avi Gilburt’s Feb 12 article on Seeking Alpha, this one attaches charts on GDX, GLD and Silver futures. You may wish to review…