
A new low below 1,202.92 invalidated the alternate hourly Elliott wave count and added confidence to the main hourly Elliott wave count.
Summary: The target for this next wave down to end is at 1,154. If a new high above 1,214.91 is seen, then expect some more upwards movement to end between 1,219.11 to 1,233.43.
New updates to this analysis are in bold.
Last monthly and weekly charts are here. Last historic analysis video is here.
Grand SuperCycle analysis is here.
MAIN ELLIOTT WAVE COUNT
DAILY CHART
Click chart to enlarge.
This main wave count has a better fit for prior movement. To see the difference between this main wave count and the alternate below please refer to last historic analysis linked to above.
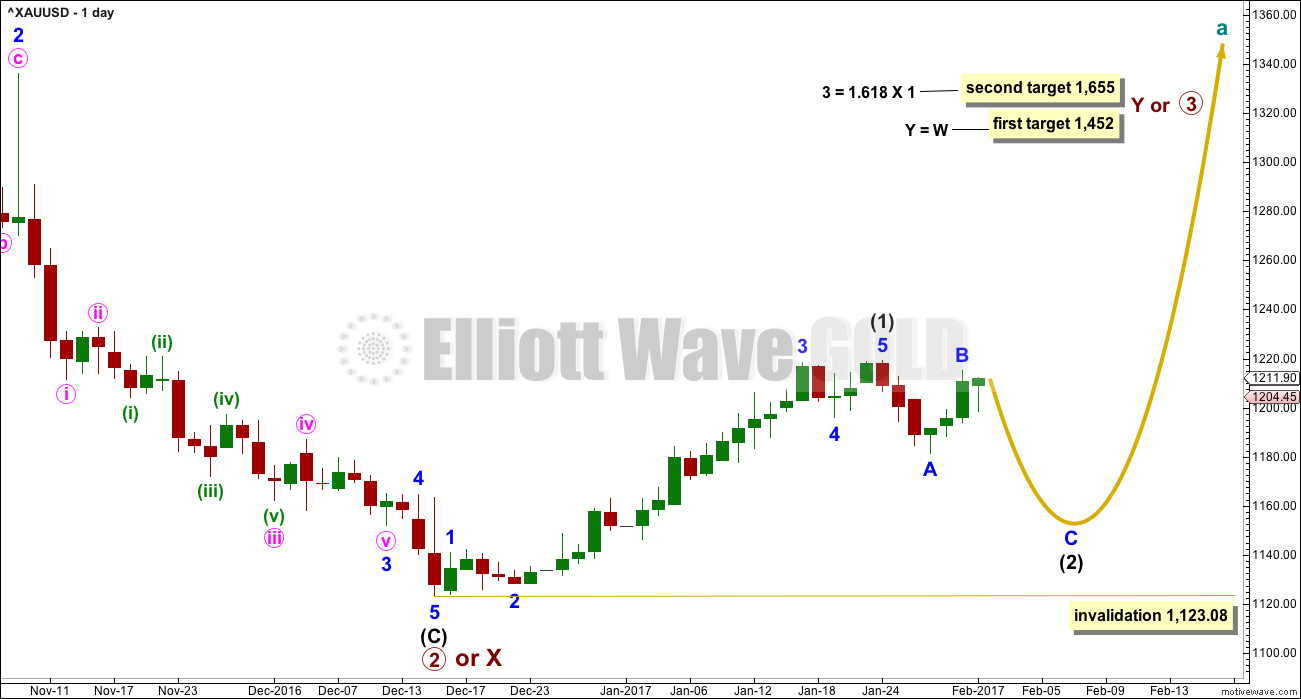
This main wave count expects Gold has had a primary degree trend change in December 2016. The new upwards wave is either a primary degree third wave, or a primary degree zigzag to complete a double zigzag.
At this stage, the degree of labelling within intermediate wave (2) is tentatively moved up one degree. Minor wave A is complete and now minor wave B may be complete. If this is correct, then minor wave C down should be relatively time consuming. Intermediate wave (2) at its end should be somewhat in proportion to intermediate wave (1), which lasted 30 days. Intermediate wave (2) is expected to last a Fibonacci 21 or 34 days.
The first in a series of second wave corrections for Gold’s new impulses is usually very deep. Intermediate wave (2) is expected to be at least 0.618 the depth of intermediate wave (1), and very likely may be deeper. It may not move beyond the start of intermediate wave (1) below 1,123.08.
HOURLY CHART
Click chart to enlarge.
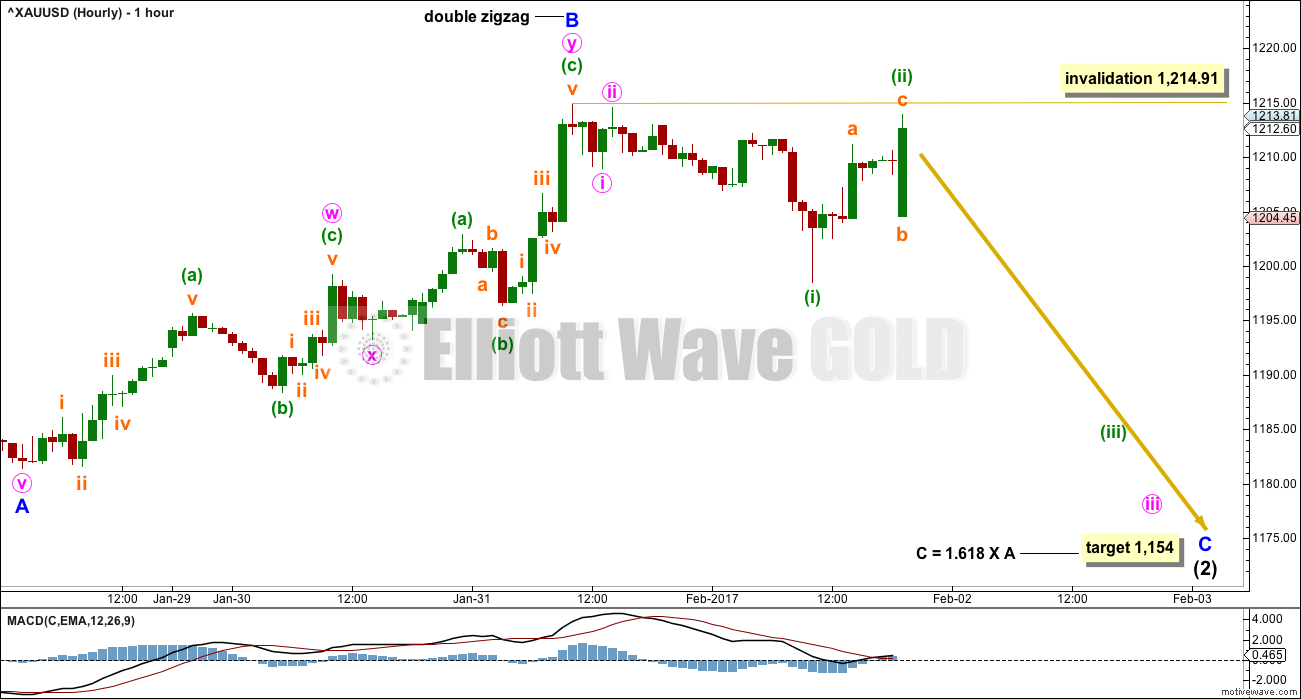
A movement at intermediate degree should begin with a five down at the hourly chart level. This may now be complete.
Minor wave A is seen here as a five wave impulse.
The target for minor wave C expects intermediate wave (2) to be very deep.
Minor wave A lasted a Fibonacci three days, and minor wave B also lasted a Fibonacci three days. Minor wave C may last 15 days if intermediate wave (2) totals a Fibonacci 21 sessions. It may also last only seven days if intermediate wave (2) totals a Fibonacci thirteen sessions.
ALTERNATE HOURLY CHART
Click chart to enlarge.
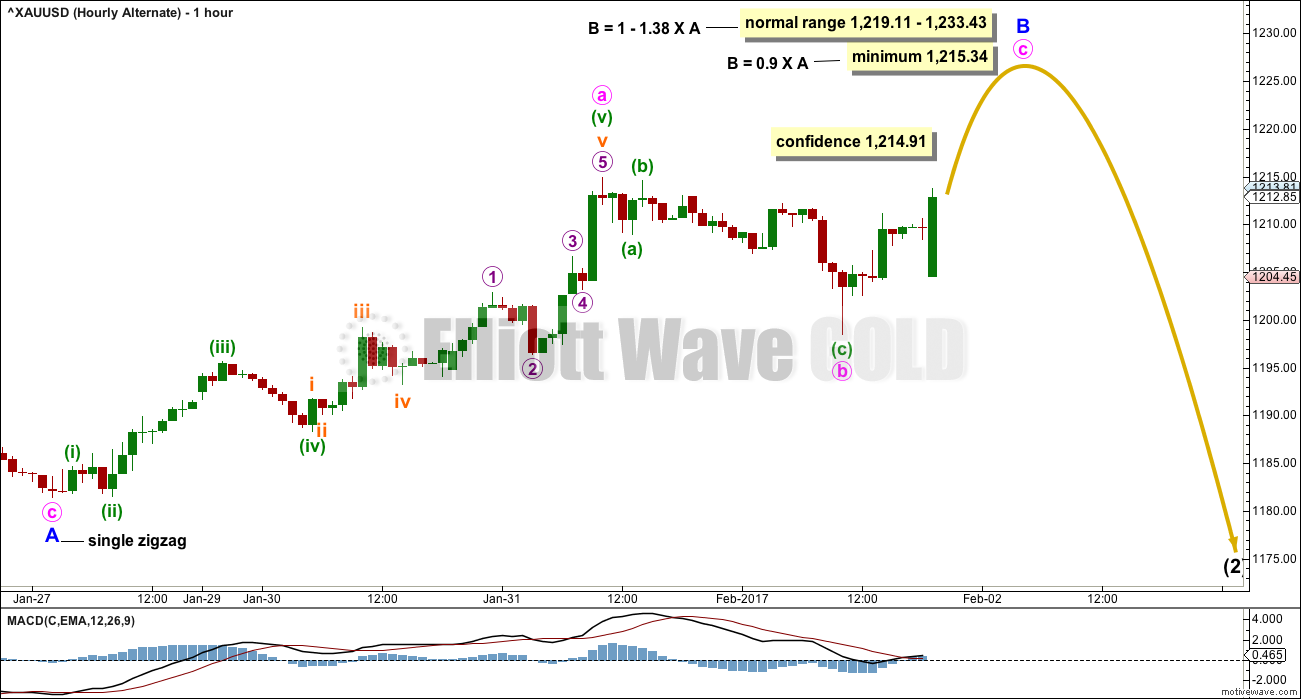
What if the main wave count is invalidated with a new high above 1,214.91? What else could be happening?
This alternate sees minor wave A downwards as a single zigzag. This will fit but is not as good a fit as the main wave count, which sees it as a five wave impulse.
Minor wave B may be continuing higher as a single zigzag. Within minor wave B, minute wave a may have been a five wave impulse. Within the impulse, the last wave of minuette wave (v) looks forced. This wave count is possible, but it does not have as neat a fit as the main wave count. This must reduce the probability.
This wave count should only be used if a new high above 1,214.91 is seen.
Upwards movement is still expected to be minor wave B, but here intermediate wave (2) may be unfolding as a flat correction. The most common type of flat correction is an expanded flat where minor wave B would make a new high above the start of minor wave A at 1,219.11.
ALTERNATE ELLIOTT WAVE COUNT
DAILY CHART
Click chart to enlarge.
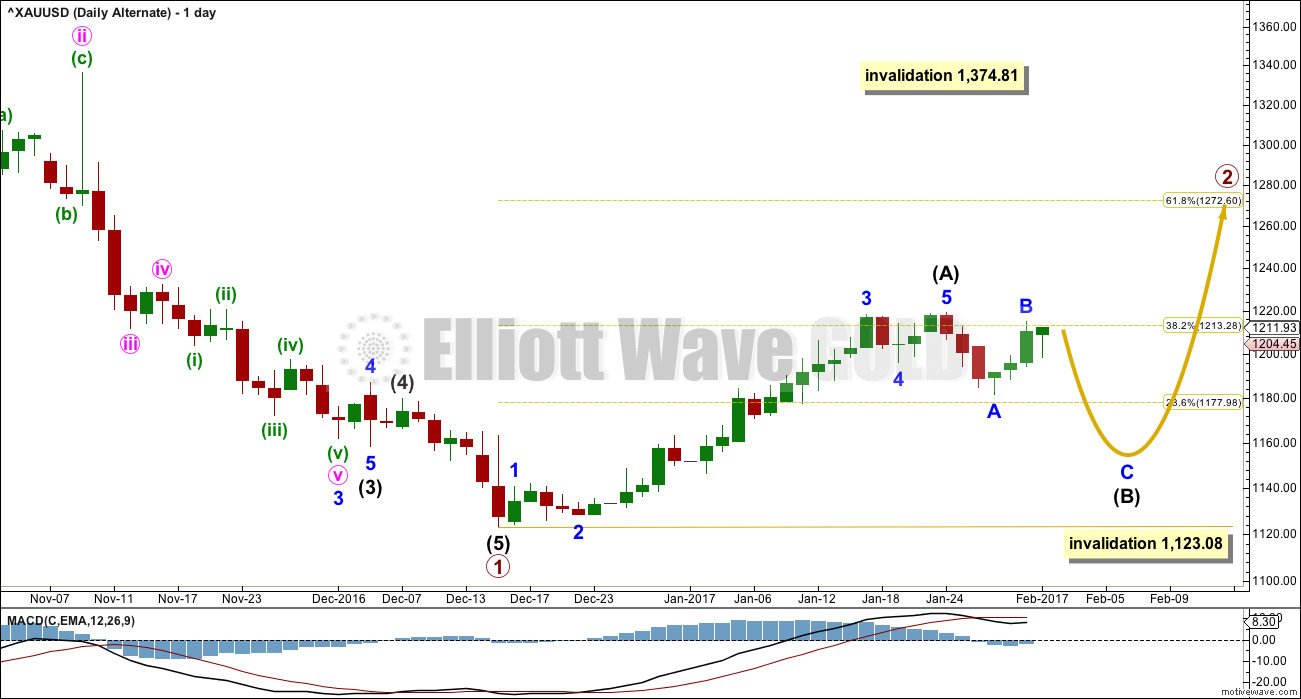
This alternate wave count expects that Gold is still within a bear market. Targets for new lows can be seen on weekly and monthly charts.
Within the bear market, a primary degree correction is underway.
Primary wave 2 is most likely to subdivide as a zigzag. Intermediate wave (A) is complete and a correction for intermediate wave (B) has begun.
Intermediate wave (B) may not move beyond the start of intermediate wave (A) below 1,123.08.
Primary wave 2 may not move beyond the start of primary wave 1 above 1,374.81.
TECHNICAL ANALYSIS
WEEKLY CHART
Click chart to enlarge. Chart courtesy of StockCharts.com.
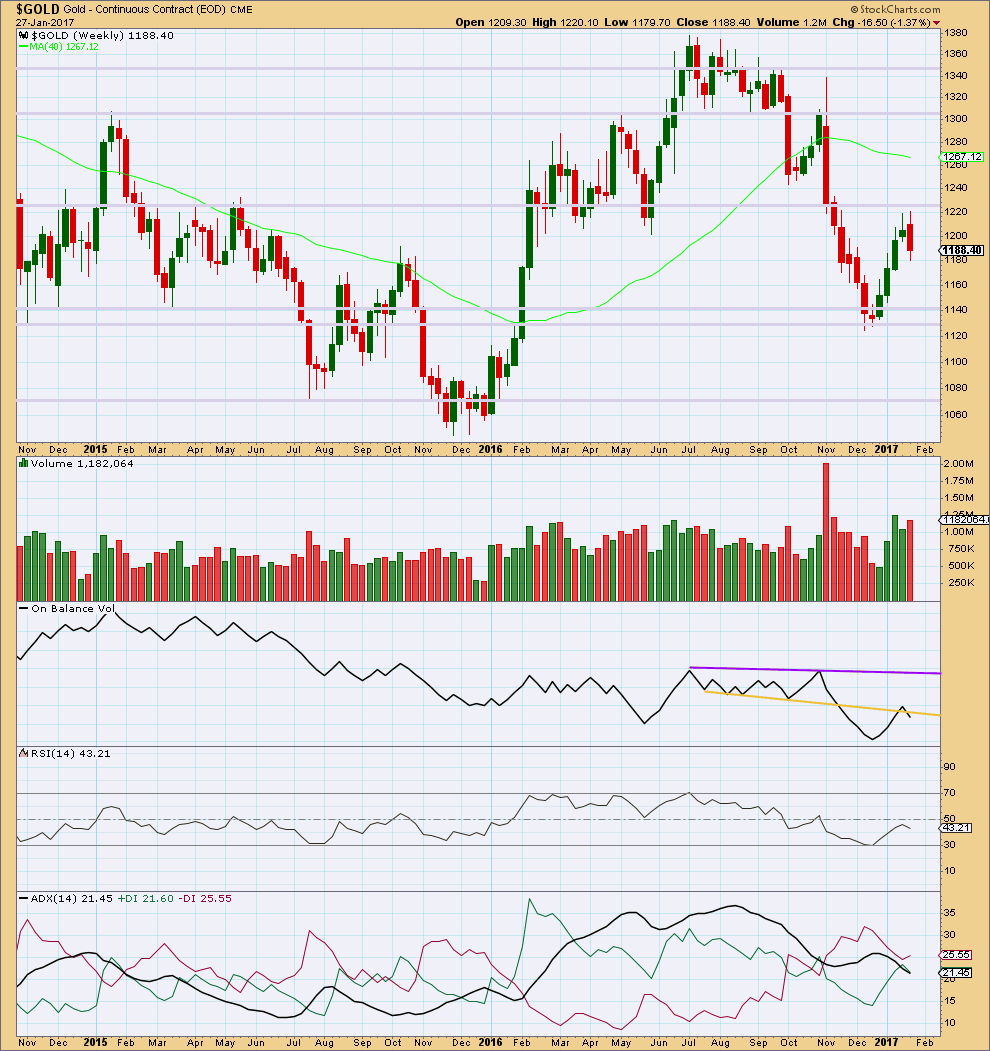
Last week completes a bearish engulfing candlestick pattern. This is the most reliable reversal pattern. It is supported by an increase in volume from the prior week. Price has found strong resistance about 1,220.
On Balance Volume gives a weak bearish signal last week with a break below the yellow line. The signal is weak because the line has been broken before.
At the weekly chart level, ADX indicates no clear trend.
DAILY CHART

Click chart to enlarge. Chart courtesy of StockCharts.com.
An inside day moved price overall lower during the session. Downwards movement does not have support from volume.
The long lower wick on today’s candlestick gives cause for concern over the main Elliott wave count as does light volume. The alternate is today published for this reason.
On Balance Volume is at support at the yellow trend line, but this is very weak. If OBV breaks below this trend line tomorrow, then it should be redrawn.
RSI is not extreme. There is room for the market to rise or fall.
ADX has slightly declined today indicating the market may no longer be trending. ATR remains flat in agreement.
Price should find strong resistance about 1,225 and support about 1,179. Price recently found resistance and Stochastics was overbought. A downwards swing may be expected to continue overall until price finds support and Stochastics reaches oversold. These swings during a consolidating market rarely (almost never) move in straight lines, so this may be what is happening here.
Bollinger Bands continue to contract as the consolidation continues.
During the consolidation which began back on the 18th of January, it is the downwards day of the 25th of January that has strongest volume suggesting a downwards breakout may be more likely than upwards.
GDX DAILY CHART
Click chart to enlarge. Chart courtesy of StockCharts.com.
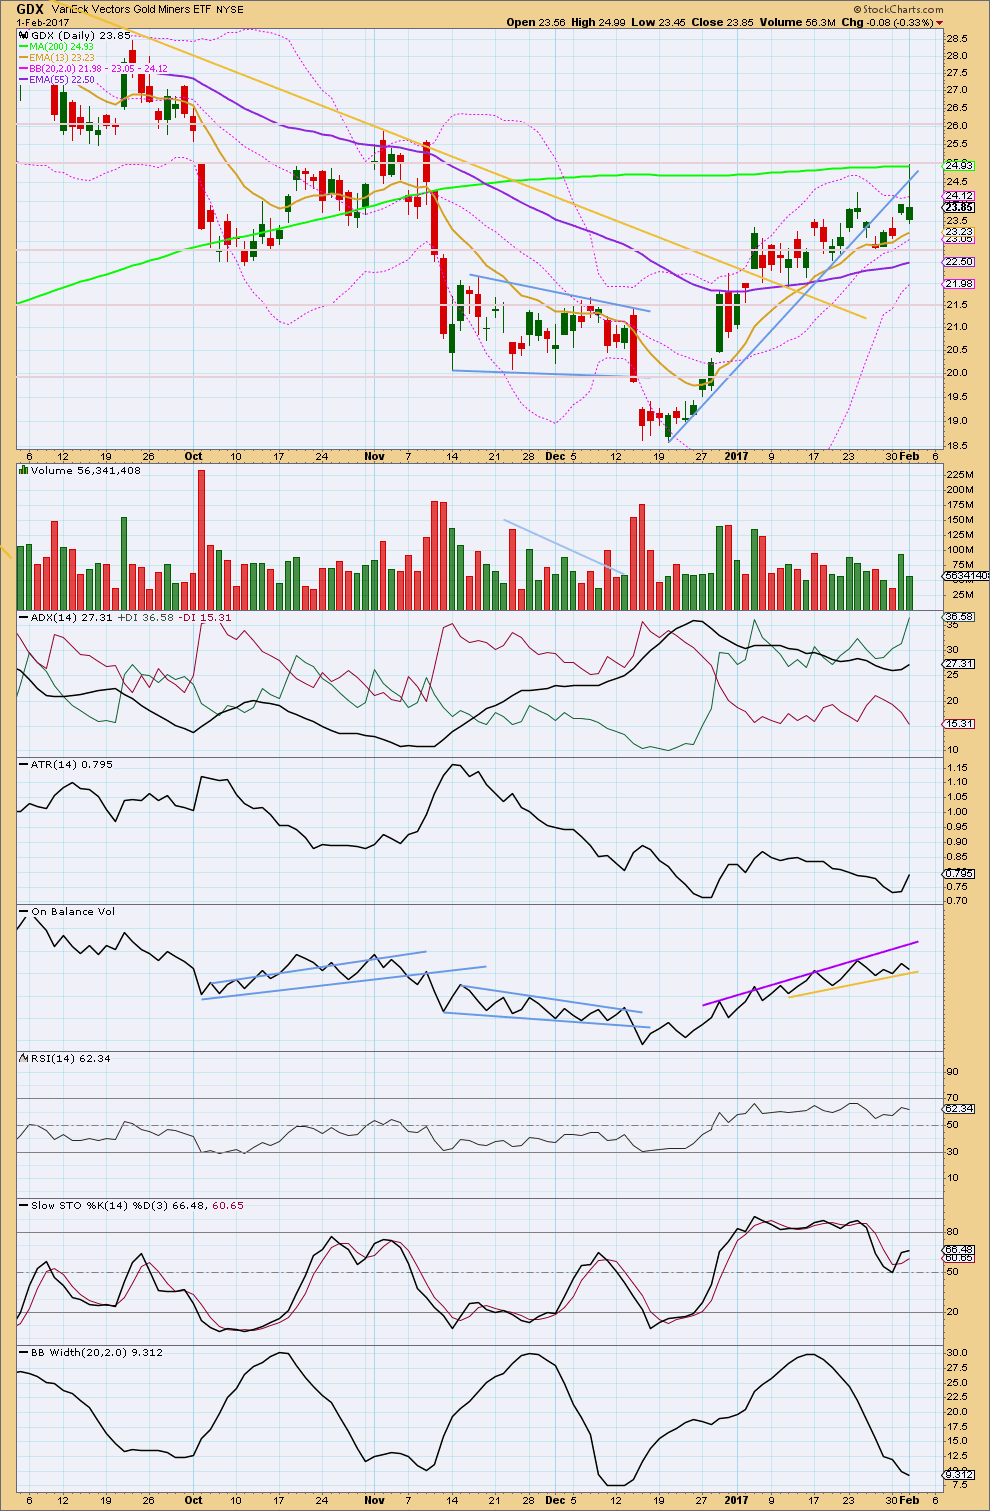
GDX had a sharp spike upwards to reach resistance at 25.00. The balance of volume for this session is downwards. The long upper wick on today’s candlestick for GDX is bearish.
Lighter volume suggests that for GDX this market fell of its own weight along with Gold today. This offers some small concern for the expectation of a downwards trend developing from here.
ADX is increasing, indicating an upwards trend that is not extreme. ATR increased today in agreement with ADX.
On Balance Volume is at support. This line has a reasonable slope, has been held now for some time, and is tested four times so far. A break below this line would be a bearish signal but not a very strong one.
There is divergence today between the new high for GDX and RSI indicating some weakness in upwards movement. This is bearish.
Stochastics is not extreme, so there is room for price to rise further.
Bollinger Bands are contracting, indicating either a weakening trend or a consolidation.
This analysis is published @ 08:42 p.m. EST.
It seams it is decision time. USD index at a major resistance line and turning north now? This would turn Gold south, or is the US$ going further south and Gold more north?
What do you think about this correlation?
Hi Verne and Thomas,
Verne, I did not have an opportunity to reply to your post until 9:37pm last night EST, USA, under Jan 31st. Thanks again for sharing.
Thomas…thank you for your chart. Helpful to see how different traders use certain indicators.
Yes, last few days (and counts) relatively confusing (whipsawing). Perhaps I should have waited as Stephen K suggests, but I am currently long both JDST and JNUG. Will have to sell one like a ‘hot potato’ @ open. I don’t like to hold on to these instruments, 1-3 days @ most. Even that may be too long considering the leverage, and as you would say….Verne…the tricks played by… the larger players, who can really push things around.
Verne, I know you don’t put a lot of weight on Avi Gilburt’s counts. BUT, another possibility shown besides our being in a ‘b’ wave…possibly about done; is an leading diagonal starting at about a low of 1180-81(depends on the XAUUSD chart), Lara’s ‘A’ Bottom [ their (ii) ]. So the diagonal would form i of (iii) @ about 1240ish. It has a pretty good look on a 60min or 15min chart. We’ll see…. there is currently a bit of divergence (weakness) as Lara mentioned.
Melanie,
You’re welcome! And thank you for sharing your links to the pod cast and SeekingAlpha’s article on GDX.
Verne has way more knowledge on all this than I do. You appear to have way more than I do as well!!
I will say the chart I shared and the method, when I’m disciplined to use it as described, has been about the easiest way to not screw up a trade I’ve ever come across. And like you, I prefer not to hold anything for more than 1-3 days at the most(current situation has me holding DUST and JDST because I neglected to put in a stop loss as any wise trader would do, but thankfully only about 2-3% down right now! When I make dumb mistakes like that, it’s hard to believe that I’ve made way more than I’ve lost! But it still doesn’t make losing feel good:)
EW and Lara’s(and everyone else on this blog’s) analysis of it, have been very helpful for me to get a good idea of where the market is heading. And Lara did say numerous times over the past few weeks that a great deal more caution should be exercised because of the complexity of the current wave structure…big player manipulation aside. I need all the help I can get and it seems this is a good place to get it.
I wish I was better at counting the waves, but I guess that’s why I am a member here…learning all the time and re-remembering stuff all the time too.
Thomas
From the Eastern USA too.
Hi Melanie:
I actually was just browsing yesterday’s comments and saw your reply.
I actually do think Avi is a very good analyst although his counts do not always strictly adhere to EW rules. He generally gets the trend correct which is the most critical thing for traders. I did post a TLT spread trade today and will update any changes. I like your “synthetic ” straddle with JDST and JNUG!
My SLV 16.50 puts are back to break even today and I suspect I will be buying back my hedging 17.50 puts at the open tomorrow. The miner ETFs all looking toppy with some serious cavorting above their respective upper BBs. I went back and took a look at a few months worth of data and they seem to trade fairly predictably after these penetrations, notwithstanding the abnormal behavior of quite a few instruments that have been lately staying pinned in extreme price ranges for days on end. If the metals and miners start doing this I am going to scream…well, maybe yell a little…. 🙂
NUGT , JNUG, and GDX and GDXJ all printing dojis or spinning tops cleanly above upper BBs today. Once upon a time this would be a no-brainer trade set-up but not these days. Prices have in some cases these days taken to setting up residence in such rarefied air…
Gold AND the Dollar up today…
is that on the daily or hourly chart?
Daily.
thanks Verne
The cat and mouse game continues! SLV coyly refusing to take out 16.32.
Fine! I ain’t buying back those puts till it does…so there!! 😀
Verne, Good idea…
Is the $15.87 in SLV you cite based on the 200 day MA?
For shorter trades, like during a single market day, one indicator I look for is when the 10 day crosses thru the 50 day MA using either short or long ETF’s..the further away from the 200 day MA the riskier the trade unless that setup is bringing you toward the 200 MA. Usually good for a quick bounce.
But you trade options, which I’ve never done…
Previous gaps.
interesting that they are so similar to the MA’s
Traders do tend to make big trades around those averages, hence the often associated gaps… 🙂
Verne, that totally makes sense 🙂
I should probably stress that is just “one” of three primary indicators of a short term bounce when I’m using 15 minute charts.
The other 2primary indicators are:
-When MACD is greater than the Blue trigger line, and
-When the Slow STO %K(144) %D(1) Black line is greater than 20 and trending up. The other Slow STO indications help to see smaller trends.
SEE the JNUG chart
Wow, 60 comments…..must be an important inflection point
hehe obviously Gold price has everyone on the hop and guessing! Quite frankly don’t see Gold price breaking below 1200 anytime soon to test a break below 20dma (1199-98); but then there is always providence and Lara’s wave counts to rely on. Tough one though to see too much downside with the lower band having moved up to meet 50dma at 1176; with the NFP tomorrow, one never knows!
Silver let the way in this recent run higher. Could it be doing the same today in the opposite direction?
It’s possible that minor B is over as a zigzag. The structure of minute c here looks good.
BUT I’m not going to be entering short until I see two things:
1. A new low below 1,205.64 to invalidate the chart I published in the comment below.
2. A breach of the channel containing minor B.
This channel fits perfectly. A full hourly candlestick below and not touching the lower edge would increase the probability that upwards movement is over, and that the next wave down is underway. That would lead to a higher probability trade.
After the channel breach I’ll be looking for a throw back to resistance at the lower line. That would offer a perfect opportunity to join a downwards trend with some confidence.
The problem there is that price often behaves like that, but not always. Sometimes it just rockets away and you miss the opportunity. That’s okay, I’m still going to exercise patience and watch it.
Looks good. I am again looking at SLV’s chart and I think odds are that we fall away from the upper BB. especially if we go below 16.45 before the close. The problem with bankster shenanigans in the precious metals arena is that it is not always easy to distinguish short term anomalies in price due to attempted manipulation, which I think usually show up as expanded flats, and genuine trend changes. Waiting for a break of 16.45 to exit short SLV puts.
Silver’s looking a bit more bearish than gold today with two red candlesticks in a row with today’s having a long upper wick. Both at upper edge of BBs.
Two charts this morning for you.
I’m labelling them main and alternate, but TBH the probability is about 50:50. Maybe I’ll relabel them “1” and “2” to make that clearer.
One more high? Entirely possible.
I can see good divergence with multiple indicators, weakness in this last high. That’s typical of B waves.
Now, this does not mean this has to be the case. It is possible that Gold is in the next wave up. But of all the possibilities I can see that one has the lowest probability. So I’m not going to publish it. That is a big judgement call, but I’m going to make that one. And I’m going to be trading on my advice.
Intermediate 2 target 1,219? Looks like an oops…
Hi Dreamer,
Any more thoughts on your Inverse H&S chart published earlier?
Top may be in. If there’s any more up tomorrow, GDX must not exceed 24.99.
Thanks..
Yep! 🙂
Oops!
This morning I have some conclusions:
1. While for Silver it looks possible that the correction was brief and shallow, for Gold that just looks ridiculous. A correction for a second wave at intermediate degree should not be over in just three days at just 0.39 of intermediate wave (1).
2. Expanded flat corrections are very common. When they unfold their B waves fool almost everyone into thinking the correction is complete, but it’s not. The C wave then moves strongly in the opposite direction. Don’t let us discount this option, it is such a common scenario.
I agree. If SLV prints a bearish engulfing candle today above the BBs this will add to evidence for an imminent decline. I expect SLV to swiftly decline back below 16.32 for confirmation. I was fully expecting this kind of mis-direction of price but that does not make it any easier to trade.
LVVery itchy fingers to buy back those SLV puts as it looks to be finally heading South. I still want to see 16.32 summarily taken out before taking the plunge…these expanded flats are murder… 🙂
An SLV move below 16.45 a bearish engulfing candle.
Heh heh
I too have itchy fingers Verne to go short on Gold. Still holding onto my long on S&P.
When I get antsy about entering a trade and want to hurry up, I’ve learned to stop and calm down. Do a more thorough analysis, don’t let greed make my trade 🙂
Me too! 🙂
Could this be a false upside breakout at 1220? Back below with a neg RSI divergence (below). Rally over?
Yes, that’s entirely possible. That’s exactly what the alternate wave count calls for.
B waves are suckers. They should exhibit reasonable weakness. There should be something off, something wrong about them.
I’m in the process right now of going through a bunch of indicators on various time frames looking for strength or weakness. That will guide what chart I post this morning for you all here.
Another challenge for me of late has been the matter of market correlation. Although Lara’s main SPX count is bullish, I have been partial to the alternate count in expecting a broader market decline. The one thing Lara has been spot-on about is the inverse relationship between PMs and equities. Logically my bearish outlook on the markets should have made me bullish on PMs, but frankly I was thinking they would de-couple. I have so far been wrong on that score.
Well, not entirely Verne.
Yesterday the S&P moved up; higher high, higher low. Although it closed red.
Gold essentially moved sideways to complete a doji, an inside day.
Today they’re inversely correlated; S&P down, Gold up.
But…. the S&P has not made a new minor swing low. Where Gold has. So the size of their respective movements means that the main count for the S&P is still the main count, but Gold has switched to it’s alternate.
And that’s one reason why I’m wary of letting analysis of one of these markets influence my analysis of the other too heavily.
Once again we are seeing how forays into extreme price territory is no longer necessarily a price reversal signal. I interpreted SLV’s second move above its BBs yesterday as probably heralding a move down, yet price continued higher overnight. While that reversal may still soon take place, we are seeing another example of how extreme price movement can persist longer than anticipated. I suspect a lot of algo trading is driving wave complexity and uncertainty, and that by design.
I suspect that you’re right on that Verne. The algos may be pushing this move further than it would otherwise go.
So now that we know FOMC created waves (no pun intended), I’m seeking thoughts here. Next major resistance 1225? Seeing a slight drop to 1219 now, but you guys see that as consolidation prior to breaking bullish more? Disclosure, I’m short and a bit confused, and don’t want to knee-jerk out of the position yet. Possibly wait for the next upside breach? I understand silver is charted to grow, and the technicals on gold support as well, from what I see on daily…hourly is bearish (a break of the lower BB would be most welcome)…so potentially looking for an exit once RSI is optimal on the hourly. I know it’s my decision…just looking for thoughts.
Some analysts called a quick wave two correction and while few of us were expecting this, it is entirely possible that is exactly what happened. I originally had planned on letting the price action of SLV around 15.87 – 16.32 be my proxy for price going forward and it turns out that was a valid thesis. Now I will be short term bullish until we get a close below…
Thanks, Verne
No problem. Looking at what price is now doing makes me wonder If the banksters will have the last laugh now that they have dislodged all the shorts. These guys aire good! 😀
Verne,
Did you see Dreamers chart below which called for the HS pattern to turn at 1225? My Spot Gold chart hit 1225. and started back down. Any opinion on that call? And Lara did mention the alternate allowing for a range between 1219-1233, which 1225 obviously falls within.
Yep. My gut feeling on the recent price action is that it was contrived to shake out short positions so that could be in keeping with Dreamer’s targets. I am keeping an eye on SLV. It is printing a red candle on a third day of penetration of the upper BB. I am going to wait for a move back below 16.32 to re-enter short trades.
Verne,
Here’s my hourly for SLV. Does appear to be turning on the hourly, but I do see your 16.32 is approximately where the 10 day and 50 day moving average would intersect. And I see how SLV has deviated from the BB. Are you using the same chart that I’ve attached?
Hi Joseph – A few thoughts….
– I’m a terrible trader and have lost so much money even with Stops. Did I say horrible. Yes! I’ve placed too much faith into Lara’s analysis over the last year and half only to find that the alternate wave counts were more accurate… too late.
– Lara is excellent but it’s proof that even the best analyst can’t predict the next moves with accuracy. Even her disclosed recent trades, which helps show conviction behind her thoughts, wound up being unprofitable.
– While the FOMC statement weakened the dollar and strengthened gold yesterday and overnight, Lara has stated several times that her analysis is separate and distinct of “noise”.
– Recent analysis that was shared on USD/JPY has not panned out and the expected move to parity for the EUR/USD has actually increased to 108.
– The best thing to do is to use Lara’s information combined with the very smart traders that offer their insight in this blog to make the best judged trades for yourself. As you mention, the accountability is yours as it is for each trader.
– The FOMC has stated 3 rate increases are expected to issued this year. However, yesterday’s FOMC statement was very bland simply because they need to wait and see how the most recent increase in December 2016 impacts the economy. The first 2017 rate increase is expected in June. Also, the FOMC needs to wait and see what Trump does with fiscal policy so more time is needed before they can act. This is the reason why the US dollar is weaker and gold higher.
– The Jobs report will be issued tomorrow morning at 8:30 Eastern. This is a very powerful report that will move markets if the numbers don’t align with estimates. So many times, I’ve been on the wrong side of the trade in advance of economic data being released so now, I’ve learned to wait for the news to break even if it takes place before market hours. I’d much rather give up the potential gains for more improved percentages to make smaller gains.
– Earlier this week, Lara had forecasted a drop in the S&P. Gold has certain correlations to many things and at different times throughout the year. I’d suspect that should the S&P decline, the safe haven assets such as gold, will climb.
– Add in the uneasy political landscape and Trump’s daily Twitter comments and I’m afraid that you can have some wild swings either way. His comment on the need to have the dollar lower and a week later stated how the EUR/USD was deeply discounted and it only provides fuel for inconsistency.
– Should you ever be in a profitable position, please take your profits and run. In addition, should you be in a losing position, please do your best to take your medicine by exiting and waiting for a better entry.
– In no way is this commentary criticizing Lara. I believe she is excellent, a wonderful communicator, and has our best interests in mind. She wants to succeed and is basing her analysis on probabilities which are much different than certainties.
Addressed to Joseph, but applicable to everyone.
Oh, and don’t forget FAKE news! Economic reporters who put a negative slant on everything a world leader says or does could equally impact public opinion.
Don’t want to steal your thunder Stephen…well said. Thanks
To both Thomas and Stephen…thanks for your notes back, and I’m in alignment w/ your words. Yea, I’m sold on the analysis logic and justification Lara is providing to the “team”, as it’s right up my alley as an engineer. As a bonus, I’m learning a lot from this forum and comments from guys like you….thanks.
I’ve come here because I learned how Elliott Waves work and most of the charts I found out on the internet were blatantly wrong. Lara is the first person I’ve found who consistently presents correct (according to the rules) wave counts. Calling the moves correctly alone isn’t everything to trading however.
To trade successfully you need discipline and a repeating process that will earn money over a long time of repetitions. Lara’s analysis can provide this in the long run I think. If you do however make “random” changes to the process like some people in here suggest I believe the answer to the question “will it work in the long run” also becomes “random”.
The secret to being successful in the long term is not just being right more often than wrong, but also in keeping winnings trades consistently bigger than losing trades. Even if you have just a 50/50 chance of being right, you can still earn money if you successfully earn more when right than you lose when wrong.
It’s a big and important part to trading that many overlook. It takes practice, experience and strong psychology to pull it off. I suggest you practice this discipline with small positions until you can consistently win more than you lose – then scale up the money you put in slowly. There’s many psychological hurdles to overcome while scaling up the money. You also mustn’t fall in the trap of thinking you’re a god after a few winners.
In short: Lara’s analysis is very valuable as the basis that will give you more correct trades than wrong trades over the long term. The rest to trade successfully has to come from you yourself – through practice.
Good luck everyone 🙂
Thank you Harald.
There is some excellent advice in this comment. I would recommend inexperienced members read this multiple times!
Well said! 👍
Sound
Thanks Harald. Great advice.
Yep Thomas. That is pretty much what I am seeing in SLV. It has been very cagey lately though and I do want to see it actually take out 16.32, and even better 15.87
Stopped out of JDST expected.
Sold SLV 17.50 Feb 17 puts for 0.45 per contract and will buy back short side spread if SLV closes below 16.50
Opening TLT March 17 expiration 112/115 bullish put credit spread for 0.32 per contract. Will exit with a close below 119
Hi all,
You may wish to read this…by Andrew McCElroy…
http://seekingalpha.com/article/4041891-gdx-gold-map-higher?app=1&uprof=51&isDirectRoadblock=false
Thanks.. remarkable the similarities isn’t it?!
Maybe we are still in 1 up and this is wave 5 and wave 2 down has not started yet?
David,
I look at EW as a way to help make the best guess I can. I’ve never heard Lara or any of the people on here say they know for certain what’s going to happen. But I have seen wave patterns that just always seem to materialize all the time, just not always when or where I want them to based on my guess or following the best guess of someone else. Sometimes doing what John says works too…just do the opposite of what everyone else is saying they are doing, but that isn’t fool proof either, as I believe John would attest!
Whatever the count, the key thing is that we are probably going higher in the near term.
The corrections of 2 and 4 are so disproportionate, it doesn’t look right.
For Silver it could work, but for Gold it just looks wrong.
New member here and I’ve been getting crushed trying to follow these EW predictions. I was long yesterday and flipped again to short at exactly the wrong time…again.
How predictive/accurate is EW? I’m 0-4 in my trades since joining.
I thought the news justified the wave count? The news yesterday obviously did not. I’m lost…need some guidance. Thank you.
Lara is excellent with her Elliot Wave counts. Today’s price action is mostly a reaction to yesterday’s FOMC interest rate decision.
Lara is the best in EW.
Thank you, John. I was taking it as more of the lead in technical analysis. Expensive lesson for me.
What % of the analysis in this site should I give to EW and what % to classic technical analysis?
I think my number is too big. 🙂 I’ve read seasoned professionals who will risk only 1-3% of equity.
David, if you learn only one thing from me then let it be risk management.
Poor risk management is the number one reason why newbies wipe out their accounts at least once. Trading without stops will do that.
Reducing position size means reducing potential profit. If you find you don’t want to do that because you want the larger profit, then you’re making a decision based on greed.
Greed and fear are the two emotions to be most aware of and managed.
If you are getting overly stressed when the market moves against you, your position sizes are probably too large.
ALWAYS have a number firmly etched in your mind that says you are wrong and exit the trade accordingly.
Loosing trades are part and parcel of the process. The key is keeping your losses as small as possible, which can be even more important than winning more often than you loose, strange as that may seem.
Exactly Verne. I’ve read from Nison (the candlestick guy) that he has more losses than wins. Many more.
But he keeps the losses small and the wins bigger, so overall he profits.
Nison is exactly the guy I first learned that from Lara!
He actually had shots of his trading account and he ACTUALLY had more losses than wins, but was STILL able to grow his account. Most folk will not believe it when you make a statement like that because it is so counter-intuitive, yet it underscores the critical importance of r disciplined risk management as you have so often advised.
The main hourly wave count is invalidated, the alternate confirmed.
Short term expect price to keep going up for a while.
I’m analysing Silver right now, and while I’m really cautious of letting my Silver analysis lead Gold (because Silver behaves… erratically, it has a lot of price shocks and gaps) I am coming up with a very bullish wave count for Silver and this is supported by classic analysis.
In short, don’t go short here on Gold.
I’m stopped out. Tomorrow I may have to review the mid term picture for the Gold analysis. Was there a really brief pullback to intermediate (1)? Could intermediate (2) be over already? It looks really unlikely. It looks wrong. But I’m going to have to consider this possibility.
Only because I now see Silver as very bullish.
Lara, what do you make of the ending expanding diagonal that I identified for GDX? That looks pretty bearish, no?
I guess alternately you could have a GDX count that’s in Intermediate wave 3 up with 3 bullish 1-2’s in play, but I think a pullback here and backtest of the channel looks better. GDX also hit resistance at the Magee bear trend line which seems significant.
I agree, that ED on GDX looks really good Dreamer.
Ugh. The situation is really unclear.
Maybe I should go with my initial conviction to not let Silver lead Gold…
Yep. I will be selling the SLV 17.50 puts and switching my trade to a bullish put spread. Will buy back with any close of SLV below 16.50. I will also be stopped out of JDST at the open for a loss cushioned by sale of short calls. Looks like we are indeed going higher.
1,225 looks like a solid target and it’s within Lara’s range for an extended flat.
Minute c = Minute a @ 1,225 and it’s also the inverse H&S target. Interesting how that works…
Thanks Dreamer, your work is very helpful and appreciated…1225 is not what I prefer hearing, but I’m just along for the ride.
A turn down toward 1154 right now would not hurt my feelings 🙂
Interesting…Gold seems to have hit 1225 and turned back down.
GDX count is updated today with an ending expanding diagonal for Minor 5. Intermediate wave 2 may just be starting today.
Thanks Dreamer. Price continues a bit higher this evening but I expect the the decline should get going in earnest next session. Markets are like molasses.
Decline, or continue to rise since it broke 1214.91?
Now watching 1219.9 for Bearish Deep Crab matching Lara’s count.
Pretty much hoping for a turn down at or prior to 1219…now would work for me!! 🙂
I’ve been working all afternoon and evening. Did not expect the major swing this afternoon… Once again, when the FED speaks, investors react! The only thing consistent about it is that there never seems to be any consistency to how investor react. Buy or sell the rumors, then buy or sell the news and then buy or sell the meeting minutes. Banksters, as Verne puts it! Investment banker market manipulation?! Or is it just social mood that’s manipulating the market?
Gold exceeded 1216 a few hours ago, topping the 1215 high from 31JAN. I guess Lara’s 1219-1233 alternate is in play now!?
Banks, Fed, policies and other merely follow the trend, rather than shaping the market today. Those who form the target market in the shadows. But now a lot of them. Not a single force – all have different interests. Therefore, trading the news is only possible intraday or 2-3 days and it is a big risk – for those who need emotions, not profit, though it does not exclude it. Decisions based on the balance of probabilities, not 100% sure, her in trade is not, if you are not God, of course.