
An upwards day with some increase in volume has broken above resistance.
The main Elliott wave count was invalidated and the alternate Elliott wave count was confirmed.
Summary: An upwards breakout has some support from volume, but there is enough concern that it may be false for an alternate wave count to be published. The target for the middle of a third wave to end is at 1,296. If price turns and breaks below 1,231.82, then the breakout was false. The target for a deeper pullback would be at about 1,206.
Members who took yesterday’s trading advice to close shorts and open longs above 1,244 should now move stops up to breakeven.
New updates to this analysis are in bold.
Last monthly and weekly charts are here. Last historic analysis video is here.
Grand SuperCycle analysis is here.
MAIN ELLIOTT WAVE COUNT
DAILY CHART
Click chart to enlarge.
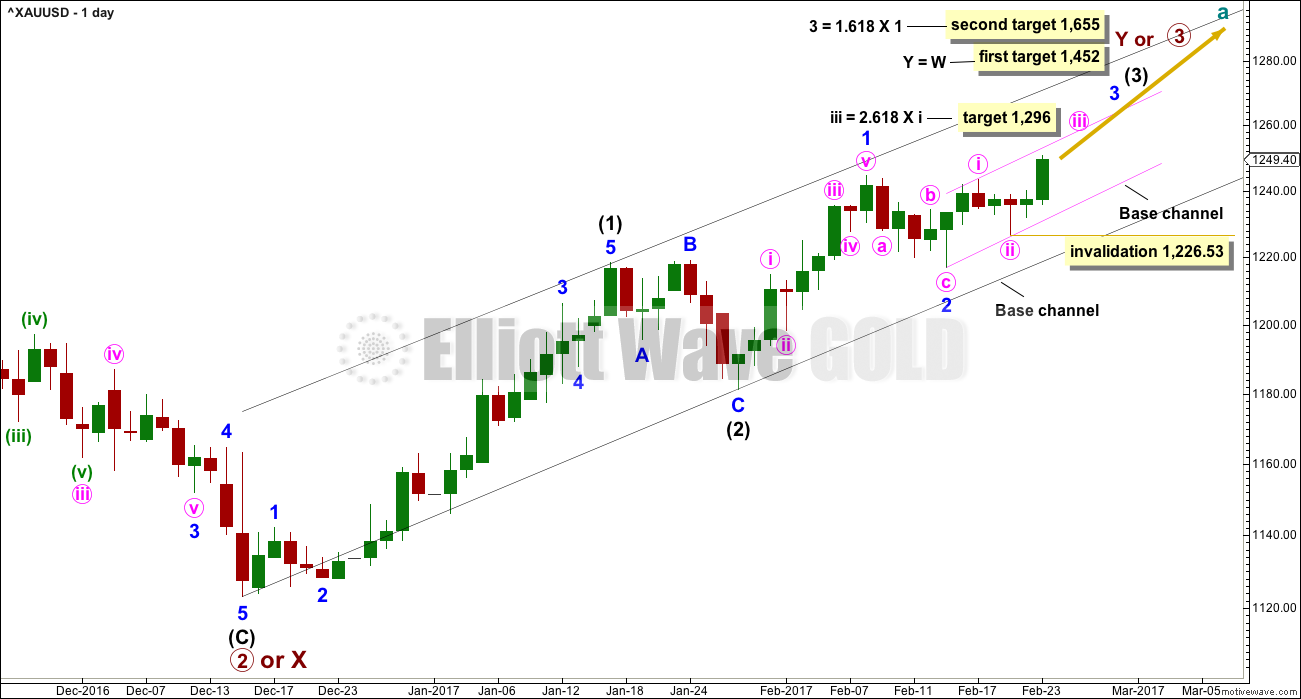
Yesterday’s main wave count has been invalidated and this wave count, which was an alternate, is now confirmed. Price indicates this should now be the main wave count.
A third wave up now at three degrees at the daily chart level should have begun.
Because minute wave ii is a little deeper than the 0.618 Fibonacci ratio of minute wave i, and because this is the middle of a larger third wave, the appropriate Fibonacci ratio for a target for minute wave iii is 2.618.
Within minute wave iii, no second wave correction may move beyond the start of its first wave below 1,226.53.
Corrections should now begin to be more brief and shallow along the way up for this wave count. Upwards movement should have support from volume and show an increase in momentum.
Add a short term base channel about minute waves i and ii as shown in pink. Copy this over to the hourly chart. The lower edge should now provide support for any deeper corrections along the way up. Given the stage the wave count is at, this wave count may be discarded if price breaks below the lower pink trend line.
The power of the middle of an upcoming third wave should be able to break above the upper edge of the pink base channel, and also the wider black base channel. If price does not do that within the next few days, this wave count would be in doubt.
Members who followed yesterday’s trading advice and opened long positions as soon as price broke above 1,244.49 should now move stops up to breakeven to reduce risk.
HOURLY CHART
Click chart to enlarge.
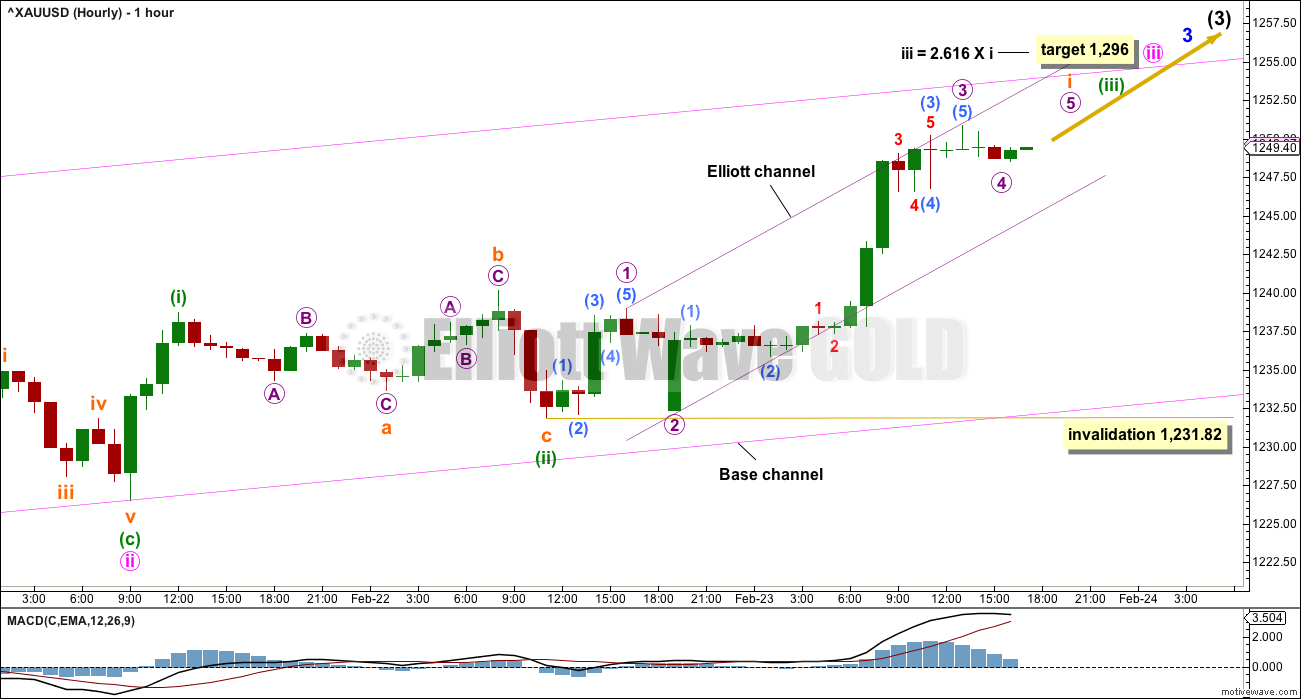
The middle of the third wave is most likely not yet passed. This third wave should show an increase in upwards momentum and along the way up should have the power to break above the upper edge of the pink base channel. If that happens, then that trend line should provide support.
Another first wave may be close to completion within the middle of the third wave. When subminuette wave i is a complete structure, then draw a Fibonacci re-tracement along its length and expect subminuette wave ii to most likely end only about the 0.382 Fibonacci ratio.
The Elliott channel is drawn about subminuette wave i in violet. Micro wave 4 may be unfolding and should not move into micro wave 1 price territory below 1,238.96. When micro wave 5 is complete, then downwards movement may break below the lower edge of the Elliott channel. If that happens, it would confirm subminuette wave i as complete and subminuette wave ii as underway.
Subminuette wave ii may not move beyond the start of subminuette wave i below 1,231.82. A new low now below this point would also mean a breach of the lower edge of the pink base channel, so this wave count would be discarded if that happens.
ALTERNATE ELLIOTT WAVE COUNT
DAILY CHART
Click chart to enlarge.
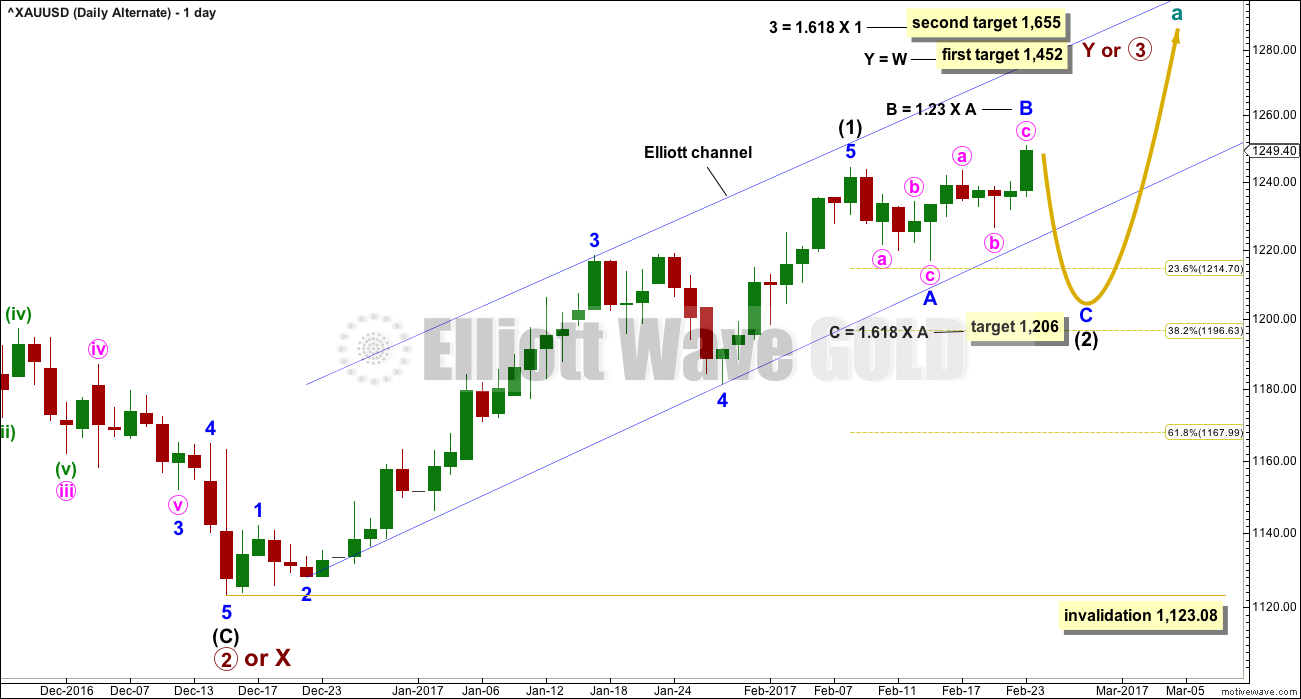
This alternate wave count is new.
It expects that the breakout for today’s session may be false. Sometimes this happens, so this wave count would provide a road map for what may happen next.
Intermediate wave (1) may have been over later. The structure within it still looks adequate.
Intermediate wave (2) may be an incomplete expanded flat correction, and so far within it minor wave B would be a 1.23 length of minor wave A, still within the normal range of 1 to 1.38. If minor wave B continues higher, then the normal range is up to 1,255.
If minor wave B is over here, then the appropriate Fibonacci ratio for minor wave C would be 1.618 the length of minor wave A. If minor wave B continues higher, then this target must also move correspondingly higher.
Intermediate wave (2) may not move beyond the start of intermediate wave (1) below 1,123.08.
HOURLY CHART
Click chart to enlarge.
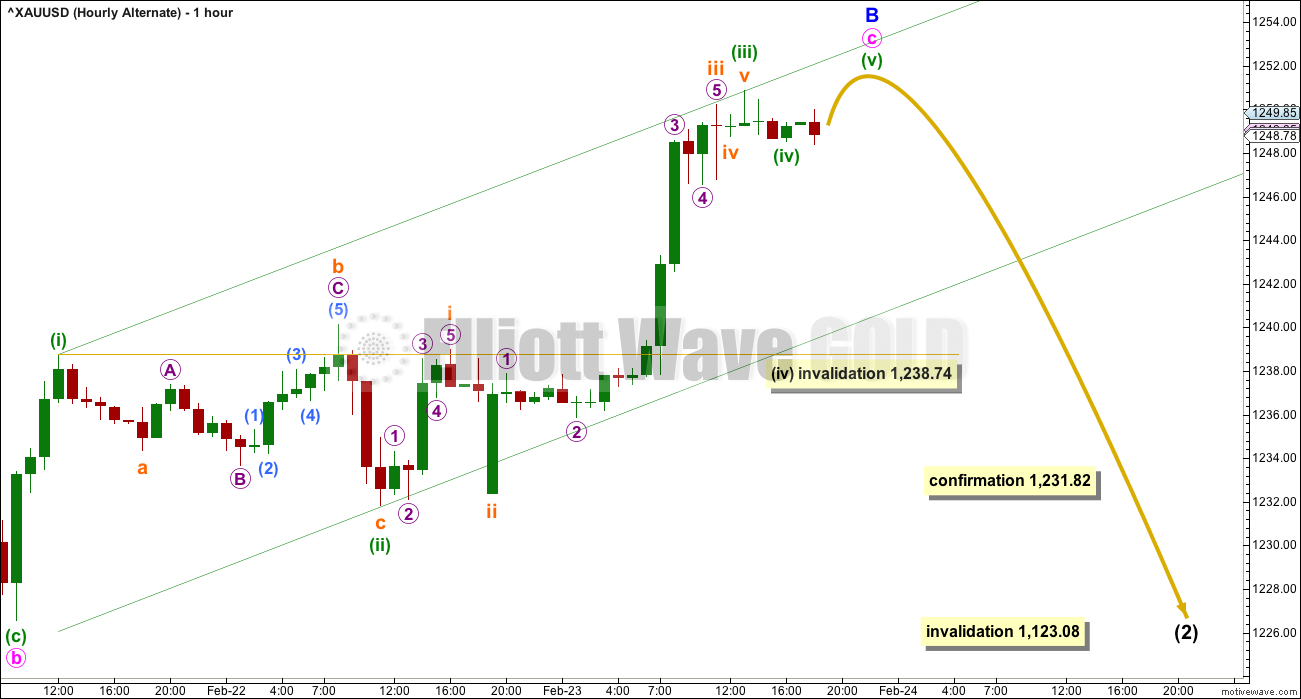
In the short term, minute wave c may have a final fifth wave, one final high, before the structure is complete. If this happens, then the target of 1,206 on the daily chart would have to be moved correspondingly higher.
If price makes one final high, then the invalidation point for minuette wave (iv) at 1,238.74 no longer applies.
If price turns and makes a new low below 1,231.82 (whether or not it makes a final high first), then the main wave count would be discarded in favour of this alternate. At that stage, a deeper pullback would be expected.
TECHNICAL ANALYSIS
WEEKLY CHART
Click chart to enlarge. Chart courtesy of StockCharts.com.
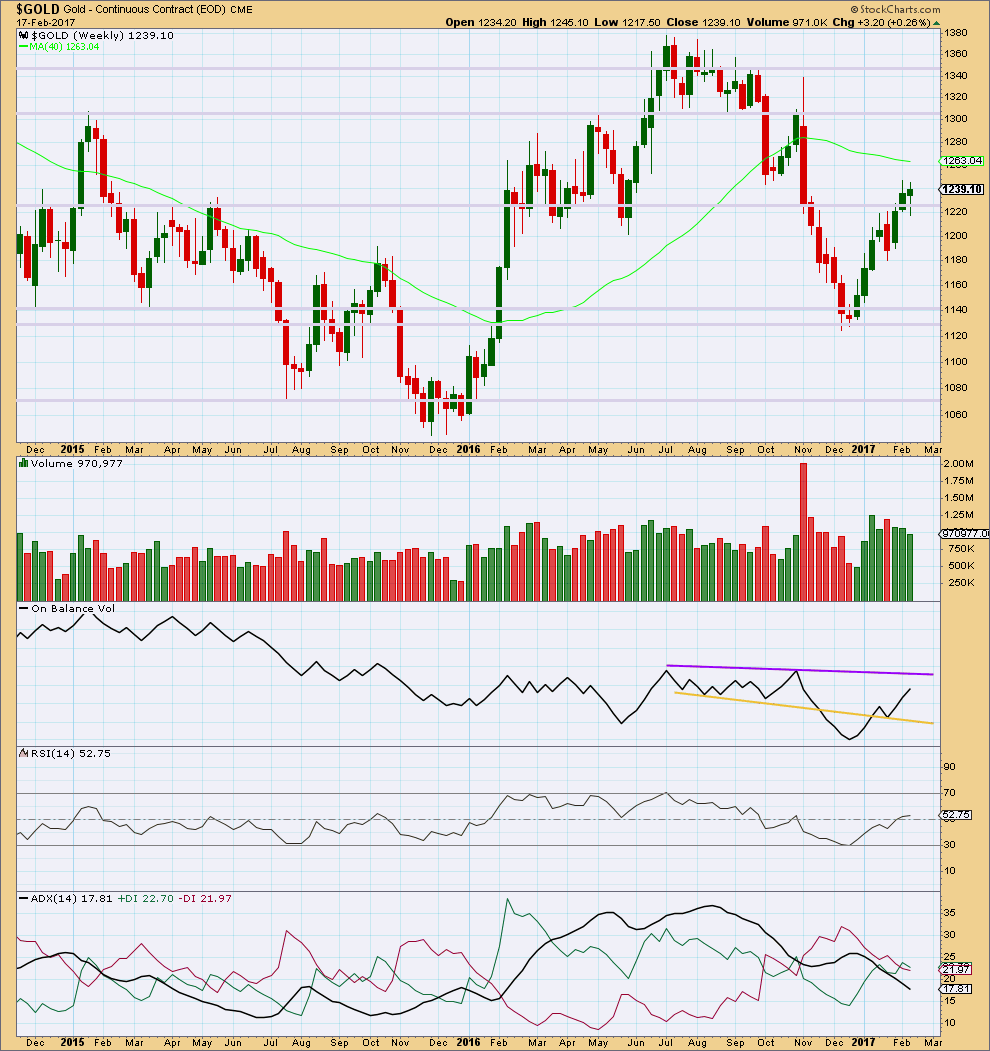
Price for last week made a lower high and lower low, the definition of downwards movement. However, the candlestick closed green and the balance of volume during the week was upwards. A decline in volume for upwards movement during the week is bearish. The long lower wick and green colour of the candlestick is bullish.
Resistance for On Balance Volume is some distance away as is support. The last break above resistance at the yellow line and backtest of support is bullish.
RSI is close to neutral. There is plenty of room for price to rise or fall here.
ADX is still declining after reaching extreme during the last upwards trend. The +DX and -DX lines have now crossed. If ADX turns up here, then an upwards trend would be indicated.
DAILY CHART
Click chart to enlarge. Chart courtesy of StockCharts.com.
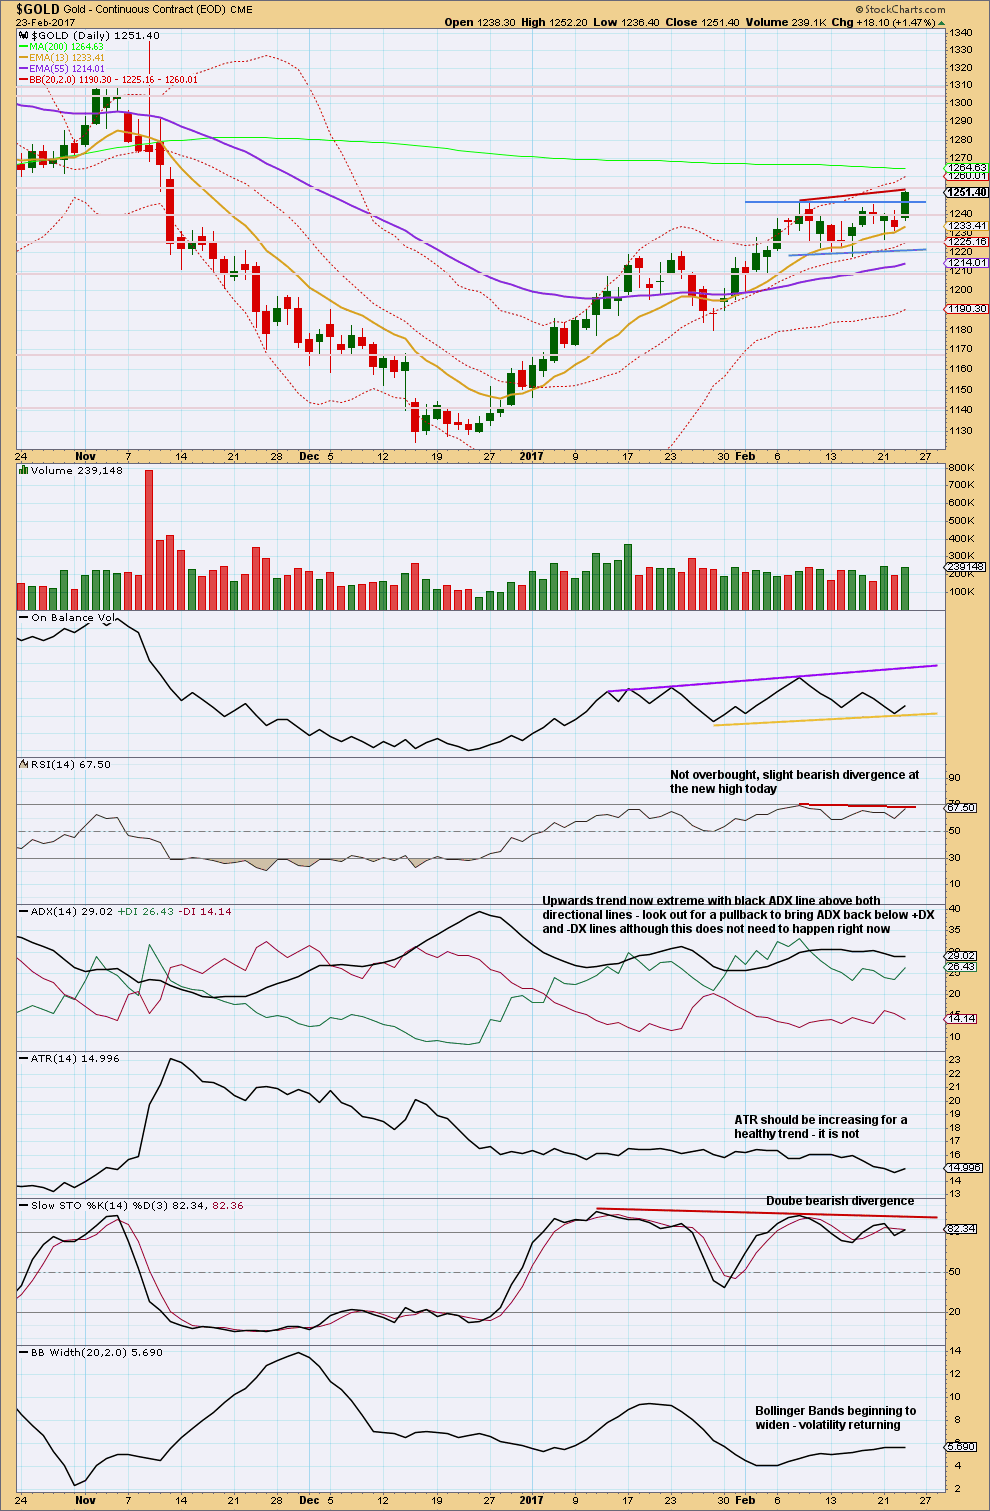
Price has moved strongly higher and closed above prior resistance with some increase in volume. At this stage, this looks like a classic upwards breakout.
However, there is some small concern today that volume is still a little lighter than the prior downwards day of the 21st of February. There was more support from volume on that day for downwards movement than there is support from volume today for upwards movement. This is slightly bearish.
Slight divergence between price and RSI may indicate a false upwards breakout, but sometimes divergence simply disappears. If price tomorrow continues higher and divergence disappears, then it should be ignored. But if price tomorrow moves lower, it should be read as bearish.
The lower support line for On Balance Volume did not work, so now it is redrawn.
ADX may remain extreme for a reasonable period of time during a strong trend. It is still below 35, so there is room for this trend to continue.
Double bearish divergence with Stochastics today is concerning. This supports the alternate Elliott wave count.
GDX
DAILY CHART
Click chart to enlarge. Chart courtesy of StockCharts.com.
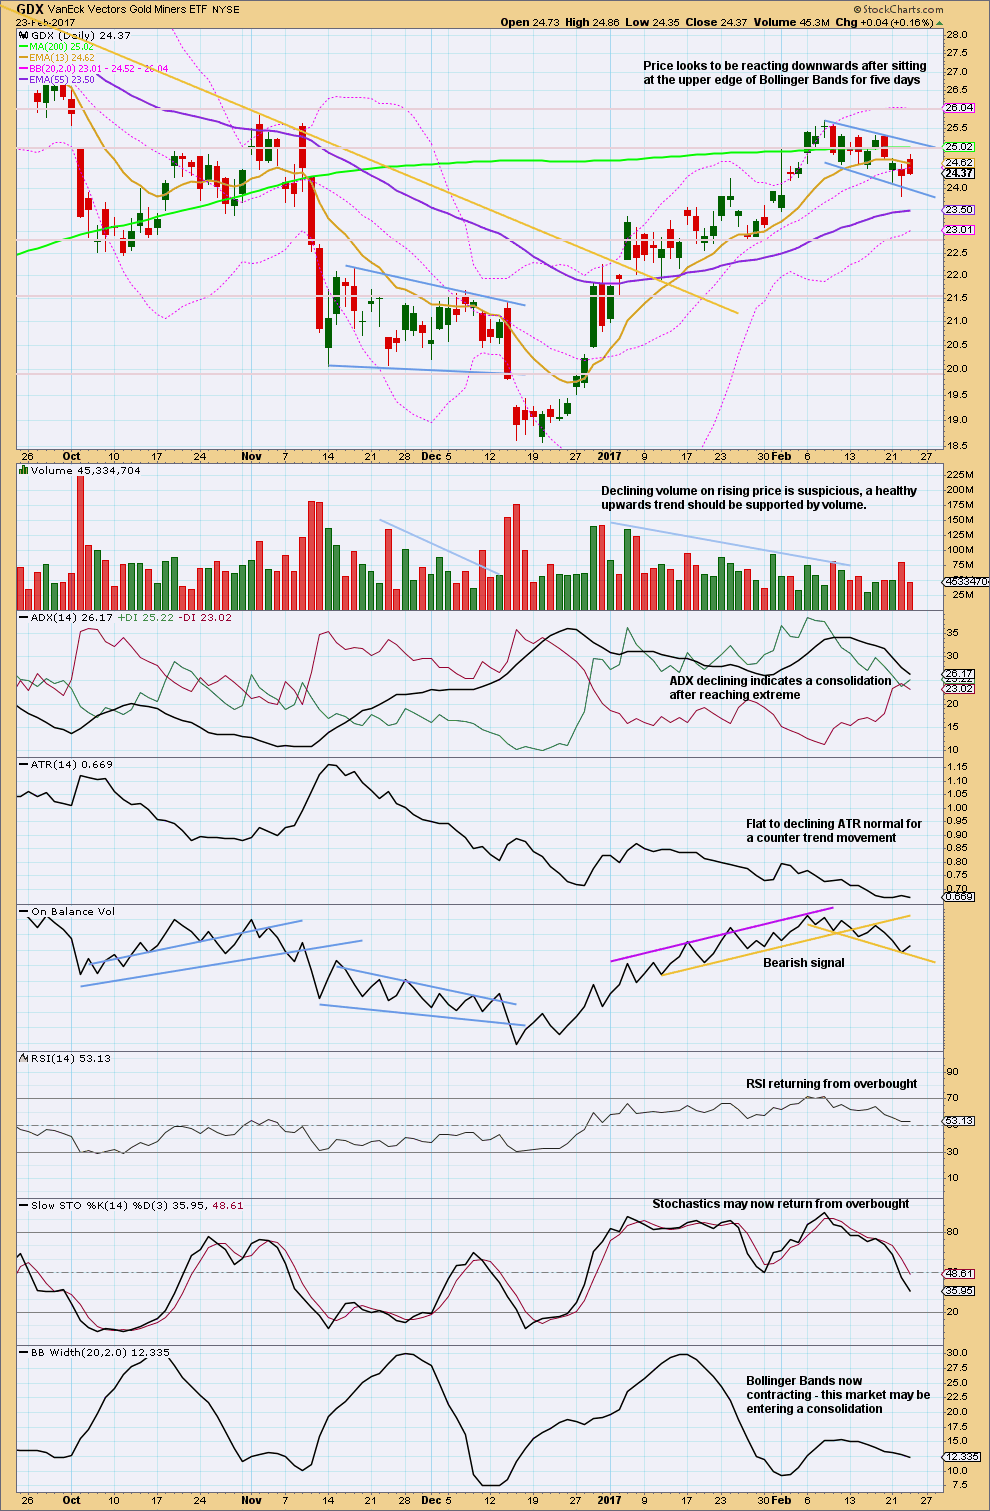
An upwards day completes with the balance of volume upwards, yet the candlestick closed red. Much lighter volume for this session indicates little support for upwards movement during the session from volume. This is bearish.
This upwards day may have resolved the bullishness in yesterday’s long lower wick.
A range bound approach to GDX at this time would expect more downwards movement until Stochastics is oversold.
It looks like GDX may be completing a flag pattern. These are the most reliable of continuation patterns. The target using the measured rule would be about 27.93. First, GDX needs to breakout above the upper edge of the flag pattern, preferably on a day with an increase in volume.
This analysis is published @ 07:08 p.m. EST.
While that does not negate in any way the impulsive move up in both Gold and Silver, it could be telling us something about the longer term prospects. This could be a bear market rally. I cannot remember if one of Lara’s earlier counts saw a possible B wave up underway. We also saw the miners lag quite badly on the way toward the 2011 highs.
Updated hourly chart:
As per Alan’s suggestion I’m moving the degree of labelling in they move up one degree.
Minute iii may end with a strong extended fifth wave, ending in a blowoff top.
If this is the correct wave count then corrections may become brief and shallow, momentum should build. Price should stay above the base channel shortly… minuette (iv) may not move much lower if at all.
No one of the miners wants to get sold – one reason with fact. More or less you can argue that miners are now going to sell what they have. They are discounting their own worth. That´s my my view.
If earnings are Ok they will again produce a little more and you can hope the stocks will go up. That´s all
Seems like a negative the miners are lagging. Their earnings are leveraged to the price of gold..so seems as though as long as we are in 3 of 3 of 3, gold is likely going higher short term and the miners would seemingly play catch up fairly quickly.
The miners have been leading so maybe the price of gold has to rise to justify the new multiples for the miners.
What I find even more interesting is the bullish charts we are seeing in both Gold and the Dollar. I have seen some counts with the buck in a three of a fifth wave up.
It is kind of weird to see the inverse miners ETFs and Gold both printing green!
I’m afraid there are no rules that the market must follow. Personally I see it as a bearish indicator for Gold rather than subscribing to the conspiracy theories that banks are suppressing/accumulating before the miners pop.
The move down from today’s high would give a good indication whether the Main or the Alternate is the correct count.
For the Main, it will be 3 waves down.
For the Alternate, it will be 5 waves.
So far looks like a 3 down?
Lara. Could the move up from 1231.82, which is currently labelled as subminuette 1 in the Main Count, be actually Minuette 3? The movement is already close to 2.618 Fib of Minuette 1.
Yes. and i agree, I’m moving it up one degree
I think I favour the alternate here; it just seems to fit better with my expectations of the wider market and the commodity cycle.
Gold broke out of another small HnS bullish pattern on top of massive 4 hour period inv HnS. The target now is high of Nov 8 2016 high volume day.
Per price- volume analysis price points of unusual high volume days are always tested.
Since gold bottom 1123 it has been forming inv HnS on top of each other.
Post from past:
“February 9, 2017 at 6:41 am
In TA analysis and EW wave counts historical similarity matters??? May be.
Current charts of gold and silver in 4 hour period have been showing HnS in various hourly time periods.
If one look at the 4 hr chart from Nov 8 it looks similar to gold chart from 1980 drop to bottom in 1999 and then the rise till 2005. Where gold broke above 500 critical level. Rest is the history.
Silver target may be 18.50 and gold is 1320+.”
Silver is close to the target at 18.30 now.
Got Gold.
The high of the day for Silver appears to be exactly at the Intermediate Downtrend resistance line.
I see two options:
1) Silver experiences a pullback here. This would align with Lara’s EW Silver counts. The pullback would likely be a wave C of an expanded flat for either Minor 2 or Minute 2 (the 2 Daily correction possibilities)
2) Silver powers up through resistance and up it goes for a powerful 3rd wave
Here’s the hourly GDX chart showing the more bearish count. This count expects a few more down days. Look for a new low below 23.82 to validate this count.
Tomorrow is a key day to decide bull or bear in the near term.
https://www.tradingview.com/x/NIiUtoME/
Here is my most bullish Daily GDX chart. Intermediate wave 2 is very brief and shallow, but this is entirely valid. Follow through to the upside tomorrow would give support to this count.
https://www.tradingview.com/x/gNJwJKe5/
Hi Lara,
Thanks for all your updates and in particular, for the trading room concept.
I favour the alternate above, mainly because the behaviour of the equities is more in accord with it. If it proves correct, shouldn’t the guideline of deep second wave corrections obtain here? I note you expect C= 1.618 x A which is reasonably close to the 38.2% retracement. In the first instance, shouldn’t we expect 61.8% retracement as more likely?
Thanks. Johno
It may be deep, yes. When I calculate a target I see if I can find a confluence of Fibonacci ratios at different degrees. I’ve chosen to go with 1.618 for minor C because it’s somewhat close to the 0.382 Fibonacci ratio of intermediate (1).
It’s also the most common ratio for C waves within expanded flats.
As it unfolds downwards, if that’s what happens, then when there’s more structure to analyse the target may change.
Melanie posted a similar chart to this by FullGoldCrown a couple of days ago. Here is an update.
Solid green candles are often followed by one or more down days. $HUI remains below the upward channel. Markets love symmetry. A move down further would build out a better inverted right shoulder. Need to see what happens tomorrow.