
Upwards movement continued for Friday as the main wave count expected.
Summary: Assume the trend remains the same until proven otherwise. The target for the middle of a third wave to end is at 1,296. If price turns and breaks below 1,238.74, then the breakout was false. The target for a deeper pullback would be at about 1,216.
Members who followed trading advice and opened long positions as soon as price broke above 1,244.49 may either leave stops at breakeven or may take some profits now. The alternate wave count has enough support from classic analysis to have a reasonable probability, so it is possible that profits may disappear.
New updates to this analysis are in bold.
Last monthly and weekly charts are here. Last historic analysis video is here.
Grand SuperCycle analysis is here.
MAIN ELLIOTT WAVE COUNT
DAILY CHART
Click chart to enlarge.
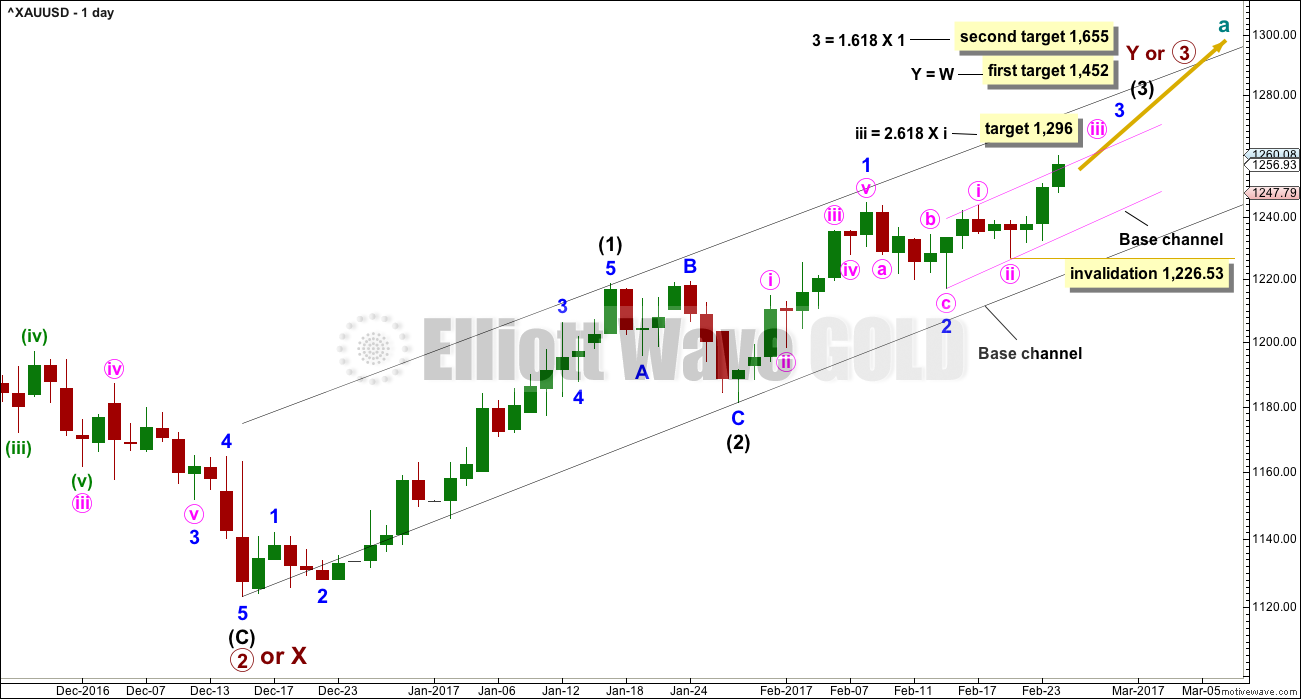
A third wave up now at three degrees at the daily chart level may have begun.
Because minute wave ii is a little deeper than the 0.618 Fibonacci ratio of minute wave i, and because this is the middle of a larger third wave, the appropriate Fibonacci ratio for a target for minute wave iii is 2.618.
Within minute wave iii, no second wave correction may move beyond the start of its first wave below 1,226.53.
Corrections should now begin to be more brief and shallow along the way up for this wave count. Upwards movement should have support from volume and show an increase in momentum. It is concerning that Friday’s upwards day does not have support from volume.
Add a short term base channel about minute waves i and ii as shown in pink. Copy this over to the hourly chart. The lower edge should now provide support for any deeper corrections along the way up. Given the stage the wave count is at, this wave count may be discarded if price breaks below the lower pink trend line.
The power of the middle of an upcoming third wave should be able to break above the upper edge of the pink base channel, and also the wider black base channel. If price does not do that within the next few days, this wave count would be in doubt.
HOURLY CHART
Click chart to enlarge.
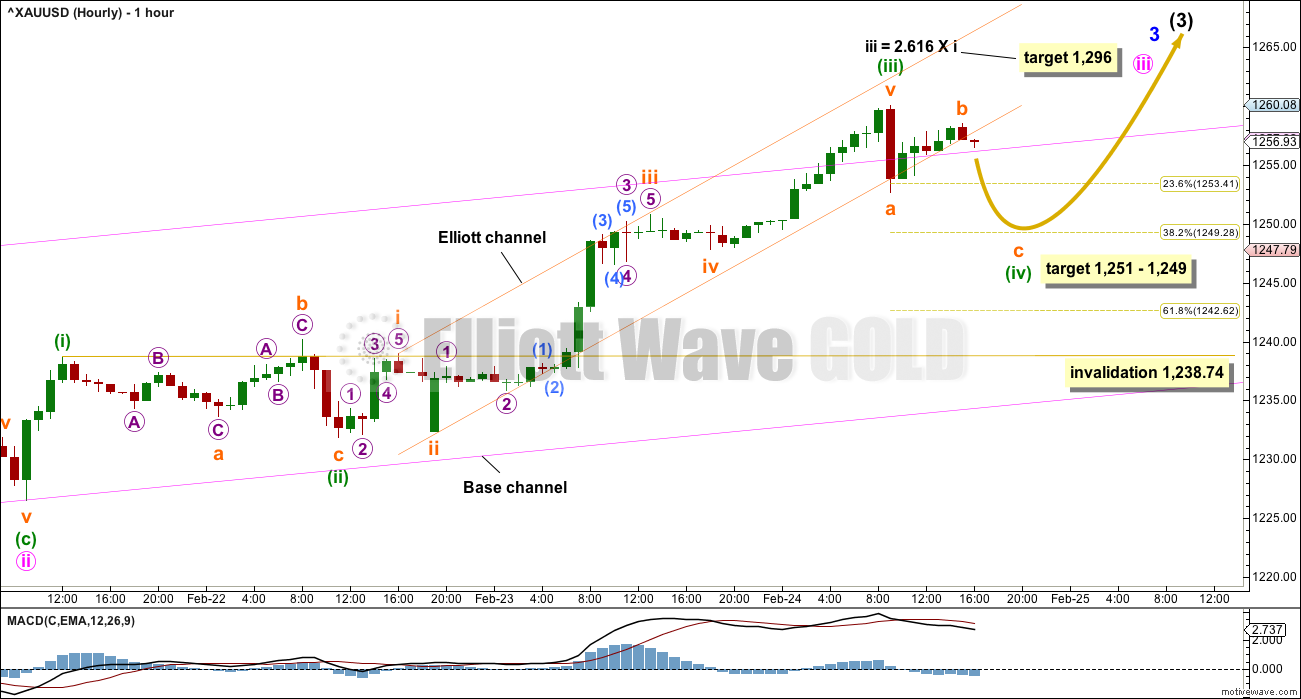
The middle of the third wave may have passed. Alternatively, the degree of labelling within minuette wave (iii) may be moved back down one degree because this may be only subminuette wave i complete.
Price is beginning to break above the upper edge of the pink base channel. When minuette wave (iv) is complete, then minuette wave (v) would be expected to be a very strong extension that should have the power to break back above the base channel and then stay there.
Minuette wave (iv) may not move into minuette wave (i) price territory below 1,238.74. At this stage, if this wave count is invalidated at the hourly chart level on Monday, then the alternate would have a much higher probability.
This wave count expects that minuette wave (iv) may be the last reasonable sized correction for some days. Momentum should begin to build along the way up.
ALTERNATE ELLIOTT WAVE COUNT
DAILY CHART
Click chart to enlarge.
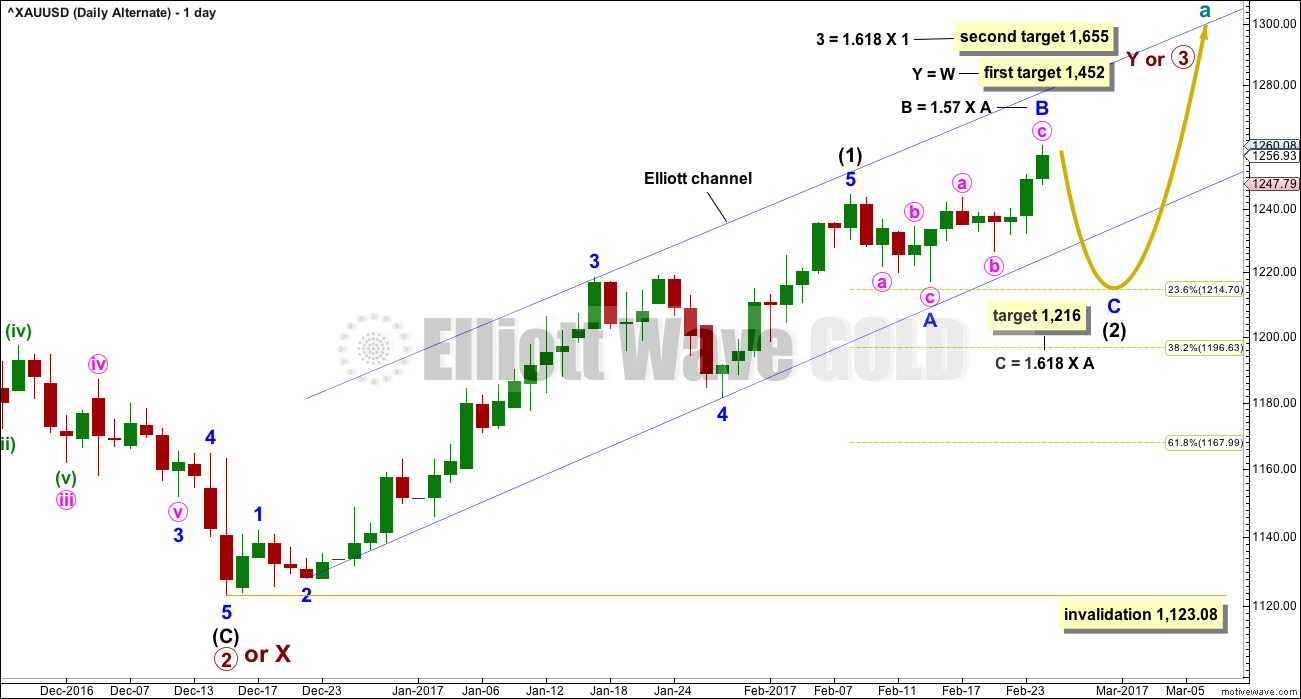
This alternate wave count expects that the breakout may be false. Sometimes this happens, so this wave count would provide a road map for what may happen next.
Intermediate wave (1) may have been over later. The structure within it still looks adequate.
Intermediate wave (2) may be an incomplete expanded flat correction, and so far within it minor wave B would be a 1.57 length of minor wave A, now outside the normal range of 1 to 1.38.
If minor wave B is over here, then the appropriate Fibonacci ratio for minor wave C would be 1.618 the length of minor wave A. If minor wave B continues higher, then this target must also move correspondingly higher.
Intermediate wave (2) may not move beyond the start of intermediate wave (1) below 1,123.08.
HOURLY CHART
Click chart to enlarge.
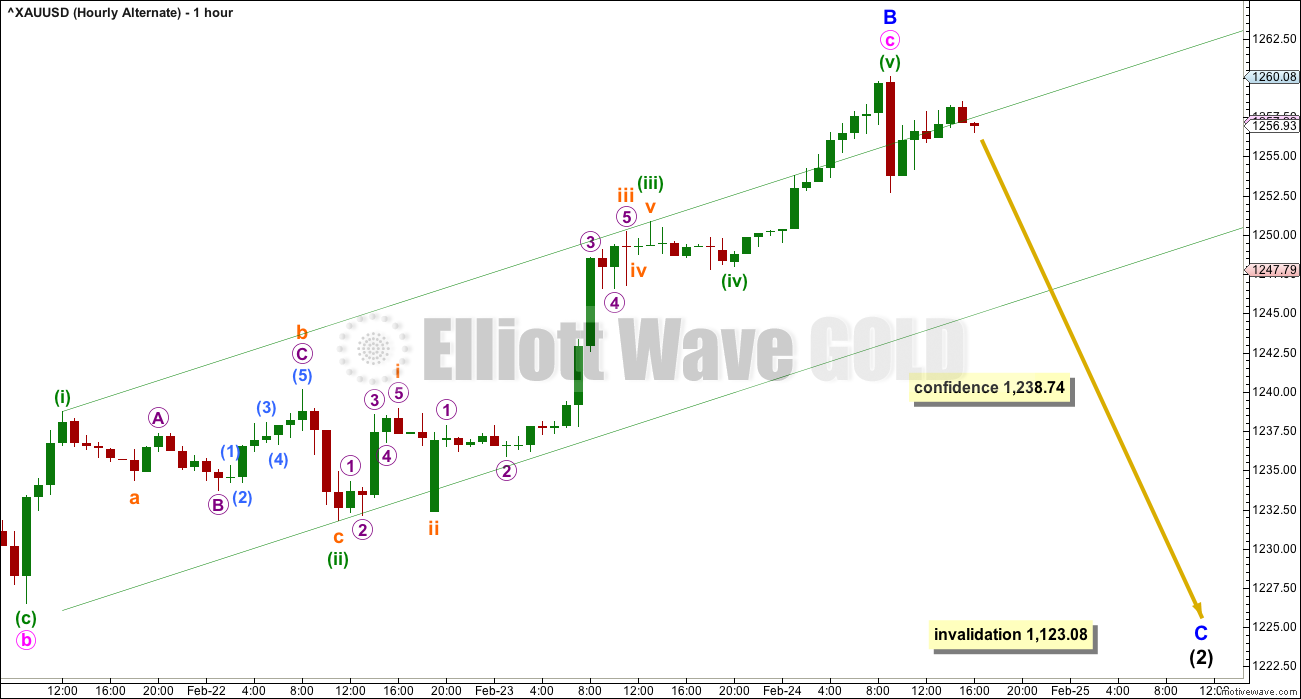
Minor wave B may now be complete. This wave count expects a trend change and strong downwards movement for a few days towards the target at 1,216.
If minor wave B continues higher, at 1,272 minor wave B would reach twice the length of minor wave A. At that stage, the probability of an expanded flat unfolding would be so low the idea should be discarded.
A new low below 1,238.74 would see this wave count substantially increase in probability.
TECHNICAL ANALYSIS
WEEKLY CHART
Click chart to enlarge. Chart courtesy of StockCharts.com.
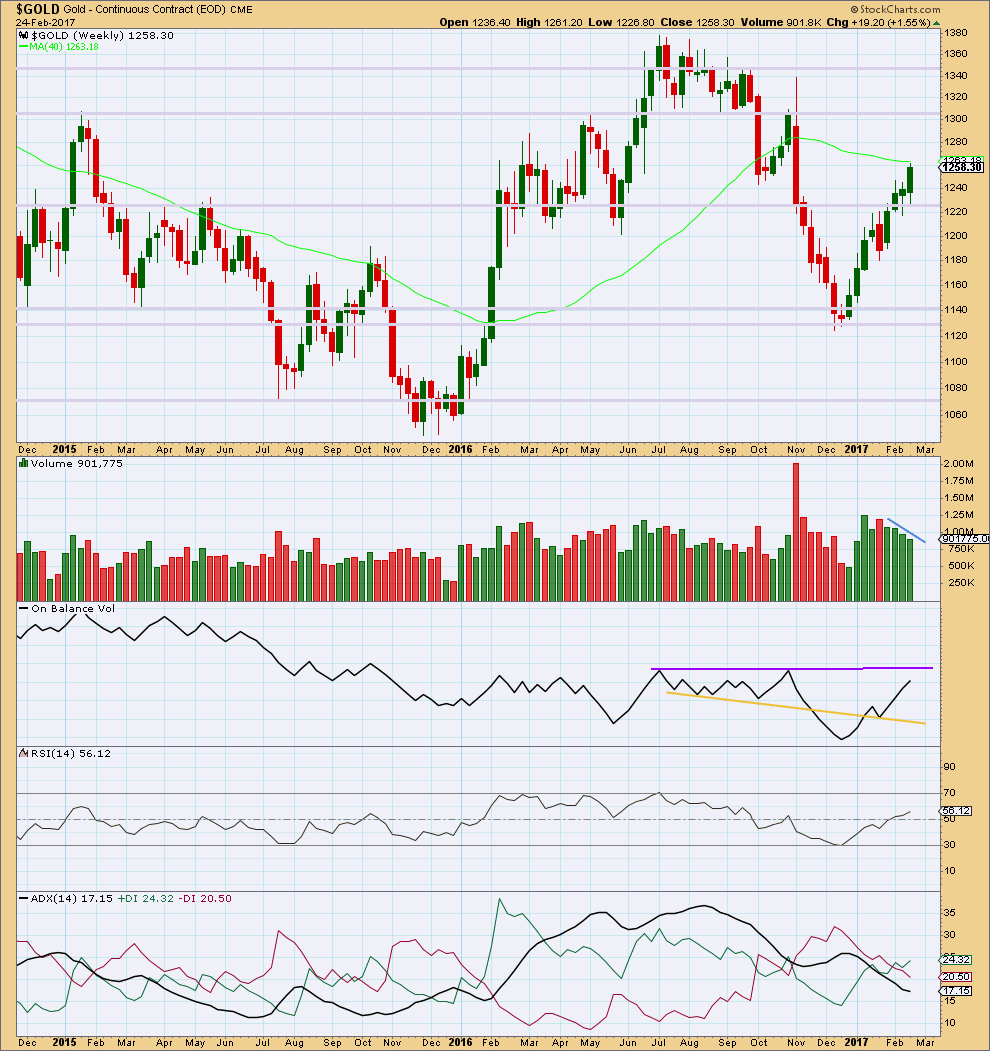
The last four weekly candlesticks are all green and all show a constant decline in volume. At the weekly chart level, this supports the alternate wave count but is very concerning for the main wave count. A third wave up at multiple degrees should have good support from volume.
On Balance Volume is nearing resistance, but it is not there yet.
RSI is not overbought. There is room for price to rise further.
ADX indicates a possible trend change from down to up, but does not yet indicate there is an upwards trend.
DAILY CHART
Click chart to enlarge. Chart courtesy of StockCharts.com.
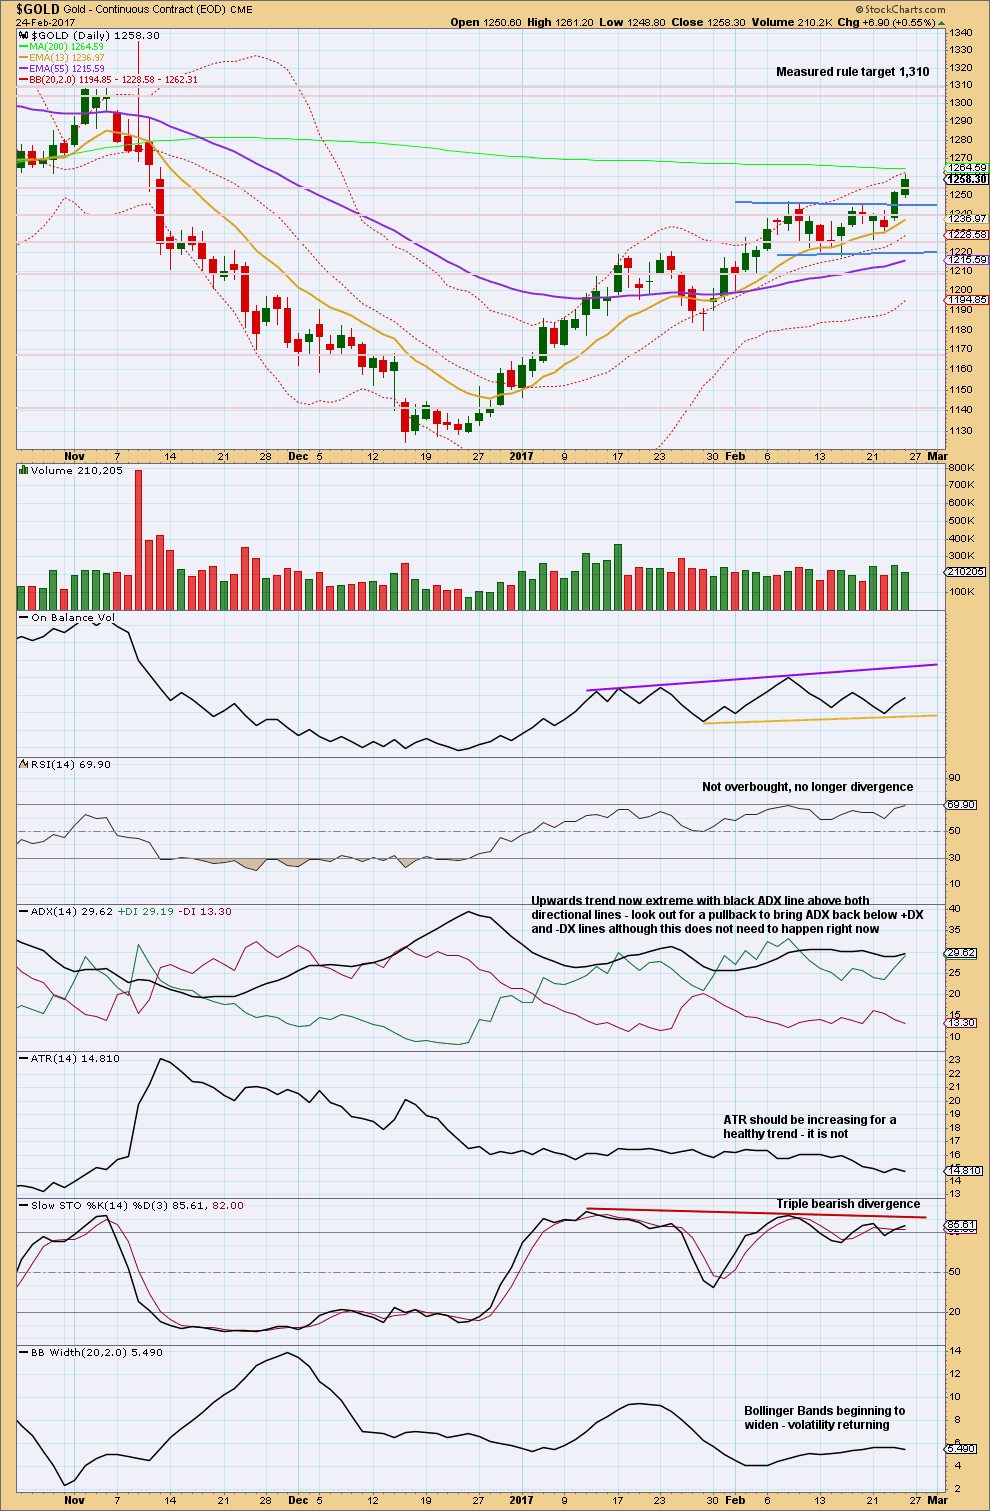
The decline in price for Friday’s session supports the alternate wave count but is a concern for the main wave count. If price does turn down here, then initially look for support at the upper blue line.
The consolidation pattern which ended this week may be a bull flag. It is not a very good one though. They are more reliable when they have a slope against the primary trend and this one has no slope. A target using the measured rule is calculated for the pattern.
ADX is extreme and Stochastics exhibits triple divergence with price while overbought. These two indicators strongly support the alternate Elliott wave count.
There is enough bearishness in this picture to be doubtful about the main wave count, but still assume the trend remains the same (upwards) until proven otherwise. Protect or take some profits.
GDX
DAILY CHART
Click chart to enlarge. Chart courtesy of StockCharts.com.
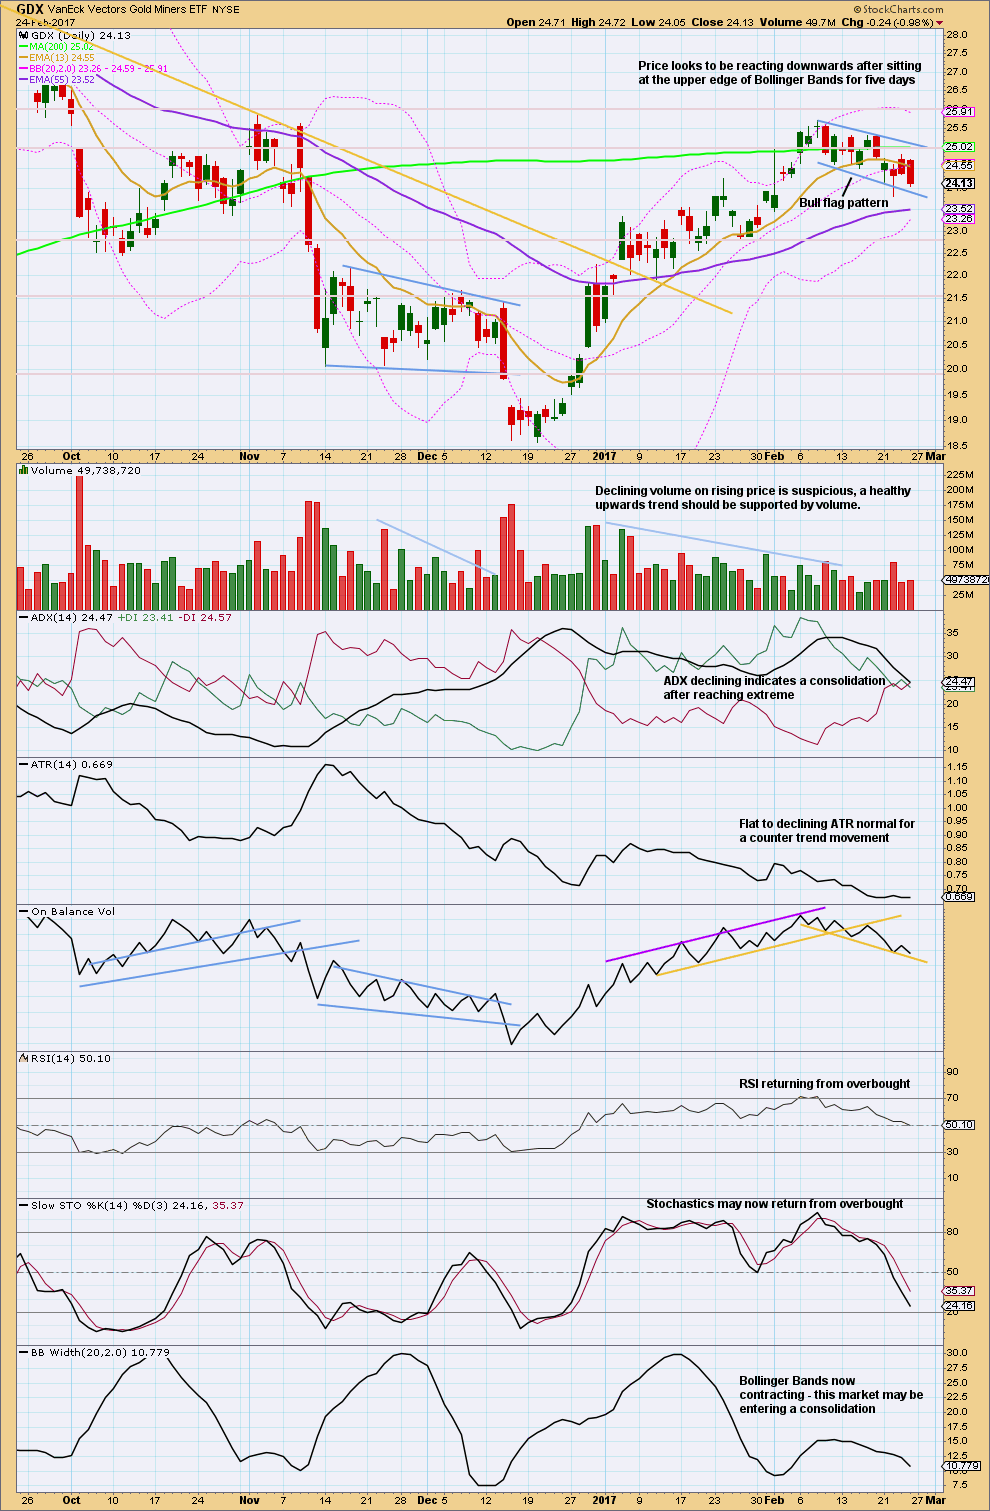
It looks like GDX may be completing a flag pattern. These are the most reliable of continuation patterns. The target using the measured rule would be about 27.93. First, GDX needs to breakout above the upper edge of the flag pattern, preferably on a day with an increase in volume.
There was some small support for downwards movement during Friday’s session from volume. If price moves lower, look for support at the lower blue trend line of the flag pattern.
This analysis is published @ 02:40 a.m. EST on 25th February, 2017.
The Dow’s new closing high streak has now stretched to 12 consecutive days, from February 9 through today, February 27. If the index closes higher tomorrow, it will match the 13-day streak that occurred to start 1987. We discussed the significance of tracking streaks in Friday’s STU and this one is being propelled by a burst of optimism. The Daily Sentiment Index (trade-futures.com) has now risen to 92% stock bulls (as of Friday’s close); just 8% of traders think the stock market will decline in the coming weeks, an extreme that hasn’t been reached in over three years. In addition, Market Vane’s Bullish Consensus of newsletters has been at 69% every day since last Tuesday (Feb. 21). The last time the survey recorded the current level of optimism was on May 14-15, 2013. The S&P 500 was nearing the end of a five-wave rally that started six months prior, in November 2012. The advance concluded on May 22, 2013, four-and-a-half days after the sentiment extreme was reached; the S&P declined 127 points (7½%) over the next month to a low on June 24, 2013.(EWI STU 27FEB2017)
$VIX up 5% today also. Correction coming.
What was really freaky was that the inverse ETF of VIX, XIV was also up. This is one screwed up, schizoid, bizarro market. Who knows what it’s going to do next?!
Rumour has it that JPM now has taken delivery of enough Silver to cover their substantially short position. When I read that a few days ago I did get to wondering if we would see another sharp move down so they could keep taking delivery at better prices. I am already starting to nibble on a few JNUG June 1.00 strike calls for 6.50 apiece. I will lower cost average on any further downside move. I am setting my stop at just below December’s low at 3.75 This ought to be real interesting…. 🙂
Miners getting crushed!
FWIW,
I sat next to a guy in first class on a flight the other day. Turns out he works for Barrick Gold Corp and is currently working on a project in the Dominican Republic. He said that they had some production delays in January in gold, but are having a great 1st quarter in all other mining(zinc, copper, etc) and the delay in gold is more than offset by how well silver is doing(both in mining and spot price). He said that the cost to mine gold is currently about $730 per ounce and that he expects the gold production should still be excellent by the March 31st end of the 1st quarter. He was aware of the action of the Gold Stocks/ETF’s on Thursday and Friday diverging from GOLD and believed they would “follow” Gold and Silver before long.
Very providential that I would sit next to a Gold Miner!!! 🙂 Very interesting fellow.
Interesting indeed. Barrick was only down 1/2 as much as GDX today. That’s significant considering that Barrick is GDX’s #1 holding.
I’d say that implies Barrick has a strong balance sheet and has gotten its costs and debt under control.
Hourly chart updated:
It looks like a triangle completed, so now it looks like a five wave impulse for minute iii is complete.
If I leave the degree of labelling as it is here then the next correction for minute iv should be brief and shallow, and may not move into minute i price territory below 1,243.49.
If I move the degree of labelling within minute iii all down one degree then we have another first wave complete, with a second wave now beginning which may not move beyond the start of the first wave below 1,226.53. I will chart that and post a separate chart so it’s really clear and there is no confusion about what I mean.
If volume today is lighter then the alternate wave count should be given very serious consideration.
If volume today is heavy then the main wave count would be supported. Third waves should have higher volume.
Daily chart updated:
You will see why I’m labelling minute iii over already when I put up the hourly chart.
So here is the problem with this idea: the middle of a big third wave may have passed, but minute iii looks too short and lacks support from volume (that is a really big deal).
So I’m leaving the invalidation point at the daily chart level at the start of minute iii. Moving the degree of labelling within that impulse down one degree would see only minuette (i) complete. Minuette (ii) may not move beyond the start of minuette wave (i) below 1,226.53.
The massive bullish inverse HnS that formed during Nov 2016 and late Jan 2017 had an initial target of 18.5 for silver and 1260eesh for gold. Now the price is in the resistance zone and expect Gold and silver to test the high of Nov 8 2016.
I am sure Lara’s main wave count will propel the prices to higher level. There are three wave at waves 3 unfolding and it should be interesting.
I have been watching her wave count and impressed that gold is following the wave excellent count.
Thanks Lara.
Thanks Papudi. I do think that I gave some pretty good trading advice on the breakout, and I hope a few members took it and have now booked some profits.
Now I’m getting more familiar with my new brokers platform I should be booking more profits too.
I’m not convinced that the main count is very good though; a third wave absolutely should have support from volume. It is very concerning that this one doesn’t.
My thought that a triangle was formed has been voided.
Now, it is quite plain that the move up from 1252.69 Subminuette A is a 3-wave simple zigzag Subminuette B. Price should now be dropping for the 5-wave Subminuette C to complete Minuette 4.
Alternatively, for the Alternate Count, 1252.69 was Subminuette 1 of Minuette 1, and the 3-wave zigzag constitutes Subminuette 2. A 5-wave drop is in order.
Alas, as yet there are no indications vis-a-vis EW to distinguish between Main and Alternate.
Interesting, that rise above the previous high of 1260.08 …
Expanded flat again?
Or that the 4th wave was very quick down to 1252.69?
Or subminuette 3 is not complete yet?
Those of you that trade the miners may find this very informing and this may even be beneficial for those that trade Gold.
On Thursday and Friday, the Miners were down and Gold was up. Is this “normal”? I set out to find some quantitative factual information instead of guessing.
I downloaded over 7 years worth of closing prices for Gold and GDX and then analyzed for the 4 possible scenarios that could occur on any given day. These 7 years include both bull and bear timeframes. I show the total # of days analyzed as well as what an “average” year and month would look like. Obviously, results may vary by month based on the overall main directional trend.
As you can see, Gold and GDX trade together (either both up or both down) 77.1% of the time. On the other 22.9% of the time, Gold and GDX diverge (one up and the other down).
So overall, it’s completely normal that Gold and GDX diverge in direction. It only seems very noticeable when Gold or GDX has a significant move in the opposite direction. That’s basically what happened last Thursday and Friday.
Hope this is useful info. Let me know if you have any questions about the data.
Fantastic. Thank you.
It is very useful. I am trading some mining companies.
One important fact is the magnitude of the move for a single mining company. You can note for a single mining company the profitability level and around this level moves up and down in difference to GDX ( or NUGT ). My dream is to have a list of profitability levels in xxxx $/oz for the mining companies.
The only data on that subject that I’ve run across was published free on Gold Eagle a long time ago by Adam Hamilton of ZealLLC.com. Haven’t seen anything recent.
Most of the miners have deleveraged, so their costs are likely much better, making them more profitable at lower gold prices.
Big thanks for sharing this info. I have only my one notes for some miners. A collection from news in the years 2011 ..2014. This notes are not really confirmed, and not so fresh as what you send. I am aware that the companies work for better profitability and don´t post it…
Lara, I posted a reply to Rafael with a chart, then edited the text after I posted it. This caused the post to go into “moderation”. This has happened many times before.
Can this issue be fixed? Many thanks,
I’ll ask Cesar to look into that. It’s caught me before too.
One fix is if your comment disappears into moderation while I’m not around is just post it again. Annoying, but it works.
Thanks Dreamer, that is awesome work!
I wonder if you were to analyze these figures further, would there be a correlation between those trends and which wave they fall into. For instance, would Gold/GDX trade together or diverge depending on the wave count…like if we are in a wave 1, 3 and/or 5 vs. 2 and/or 4? Is that even something you could figure out without too much work?
Thanks again Dreamer
I think that would be an absolutely enormous amount of work, and would involve a large degree of subjectivity as to which wave price may have been in. For the kind of work Dreamer has done here I think it’s better left to just the facts and figures.
Well if you don’t ask, you’ll never know. 🙂 And Dreamer seems to have a way of pulling off what to most of us would be impossible.
That said, I’m not asking him to do anything…it was more of a hypothetical question!?
Thank you too Lara for all your great work.
Thomas
Hi Thomas, I will be analyzing the data further. I want to look at the differences in movement between GDX and Gold. This I can do with Excel formulas.
Trying to tie the moves to EW would be crazy time consuming and as Lara stated, subjective.
Yep…but wouldn’t it be interesting to see if there were some kind of correlation to Elliott Wave counts that was discernible?
Thanks again for adding to the wealth of information on this site.
I wish I knew 1/100 of what you, Lara and others bring to this discussion.
Happy to be here:)
I may look at a couple of short time frames where Gold and GDX are clearly trending to see what they look like. Maybe a 21 day (trading month) Bull period and a 21 day Bear period and see what the results are.
That’s awesome Dreamer. I agree, it’s best to look at the actual numbers rather than guessing. This exercise shows us that it’s fairly normal for them to diverge. So we shouldn’t read too much into it IMO when they do.
It appears that the price action so far today looks like a triangle. If so, then minuette 4 for the Main Count may be a triangle. For the Alternate Count, this can fit at best as part of Minute 2 of Minor C. Let’s await further developments for clarity.
If gold starts to correct in the next day or two, then all should be well for another thrust higher in both metals and equities after a few weeks. However, if gold refuses to correct and has a blow off while equities continue to languish, then that would be scarily bearish for me intermediate term.
In my experience, prolonged divergence between the metals and the equities always ends in tears for both asset classes, with 2011 being a notable example.
Agree!
Thanks for the great charts Dreamer. It is going to be interesting to see if equities and PMs continue to tango together or (fox) trot off in different directions….
Another 5% drop to 38 for GDXJ could form a powerful inverted H&S pattern. chart by FullGoldCrown
The current candle in GLD looks like a possible topping candle based on previous similar candles
Short term, looks like the Miners have more down to go, so the Gold alternate count may be in play.
Good post by theDailyGold
https://thedailygold.com/underperformance-in-gold-stocks-argues-for-interim-peak/
Some nice charts from Rambus showing that there is likely much more up opportunity within the PM complex. Green arrows look like good targets.
https://rambus1.com/2017/02/25/late-friday-night-chart-11/