
Two hourly Elliott wave counts look at two possible scenarios for the next session.
Summary: The target for this next wave down to end is at 1,164 – 1,160. First, a breach of the Elliott channel on the hourly charts is required for any confidence in a high. A new low below 1,205.64 would add confidence. If a new high above 1,225.11 is seen, then expect some more upwards movement to a target at 1,232.
New updates to this analysis are in bold.
Last monthly and weekly charts are here. Last historic analysis video is here.
Grand SuperCycle analysis is here.
MAIN ELLIOTT WAVE COUNT
DAILY CHART
Click chart to enlarge.
This main wave count has a better fit for prior movement. To see the difference between this main wave count and the alternate below please refer to last historic analysis linked to above.
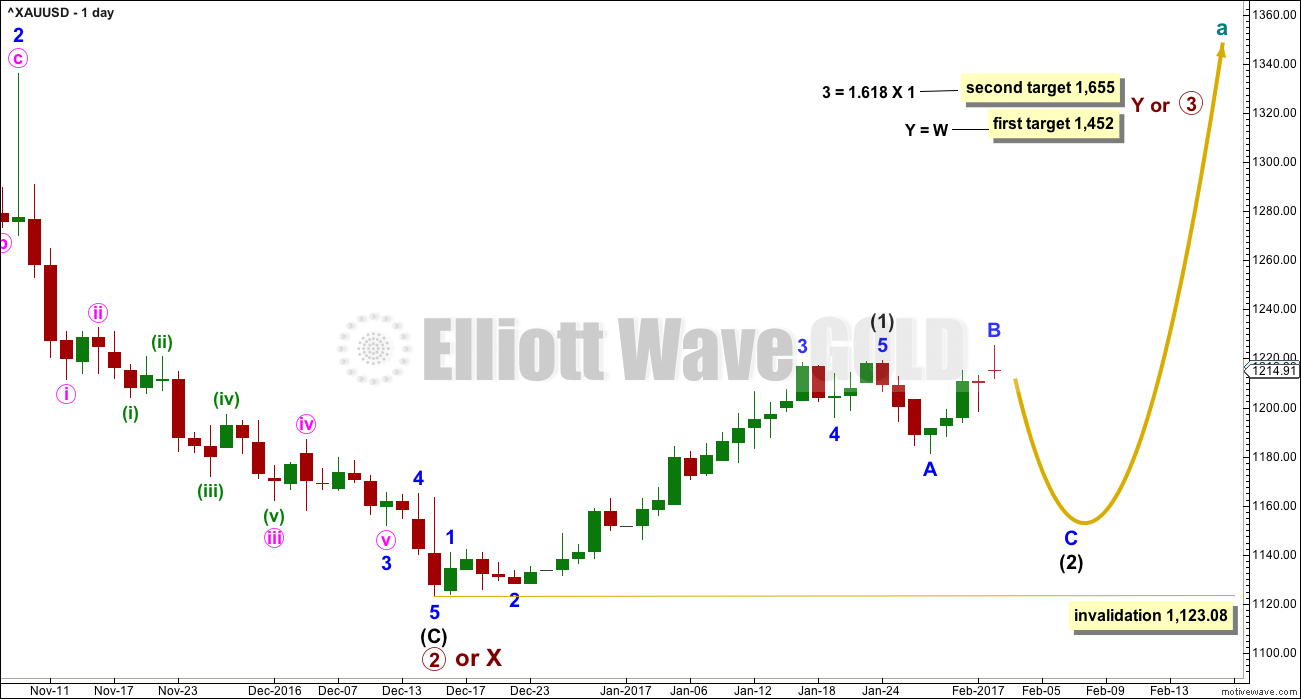
This main wave count expects Gold has had a primary degree trend change in December 2016. The new upwards wave is either a primary degree third wave, or a primary degree zigzag to complete a double zigzag.
At this stage, the degree of labelling within intermediate wave (2) is tentatively moved up one degree. Minor wave A is complete and now minor wave B may be complete. If this is correct, then minor wave C down should be relatively time consuming. Intermediate wave (2) at its end should be somewhat in proportion to intermediate wave (1), which lasted 30 days. Intermediate wave (2) is expected to last a Fibonacci 21 or 34 days.
Intermediate wave (2) is labelled as an incomplete expanded flat correction. These are very common structures. Within them their B waves make a new price extreme beyond the start of the A wave. B waves of expanded flats should exhibit clear and strong weakness.
The first in a series of second wave corrections for Gold’s new impulses is usually very deep. Intermediate wave (2) is expected to be at least 0.618 the depth of intermediate wave (1), and may be deeper. It may not move beyond the start of intermediate wave (1) below 1,123.08.
FIRST HOURLY CHART
Click chart to enlarge.
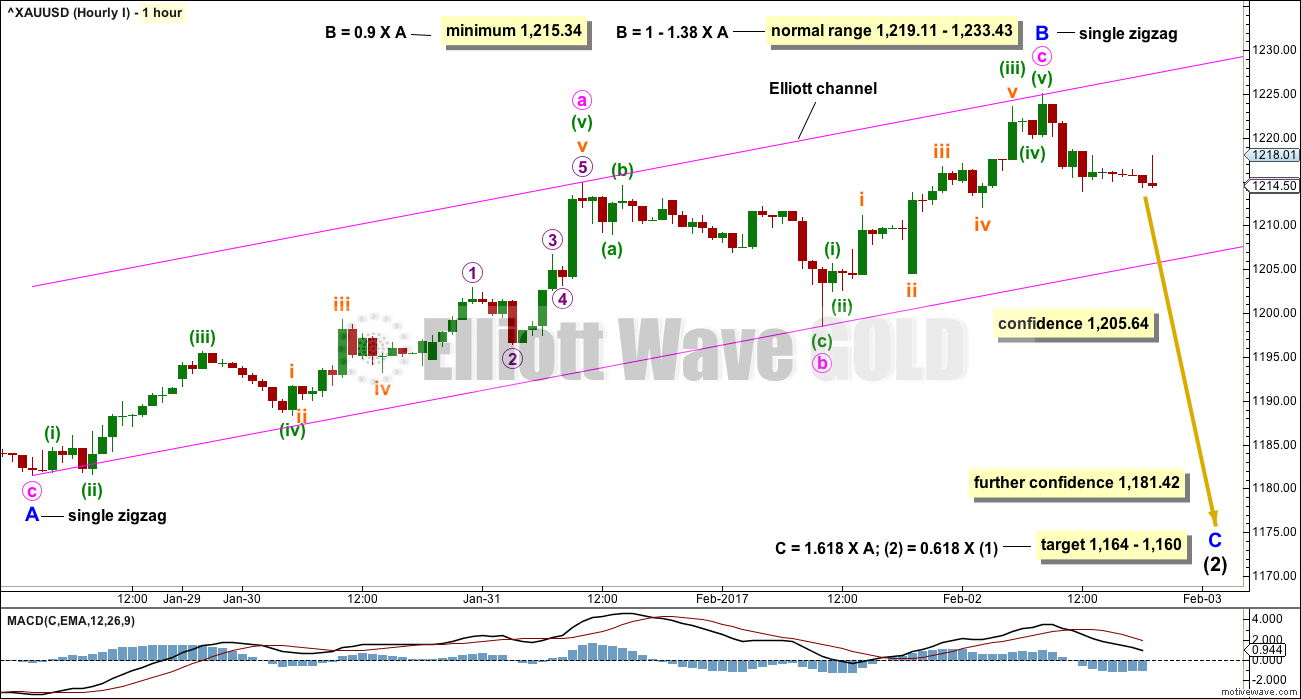
Minor wave A is seen as a zigzag for both wave counts today. The difference between the two is the structure of minute wave c within minor wave B.
There is no Fibonacci ratio between minute waves a and c.
The target is a small $4 zone calculated at two degrees. It assumes the most common Fibonacci ratio between minor waves A and C for an expanded flat.
A new low below the Elliott channel would add reasonable confidence to this wave count. Look out for price to breach the channel, then bounce up and retest the underside for resistance. If price behaves like that, it would offer a good entry to join a downwards trend.
A new low below 1,205.64 would invalidate the second hourly chart below and provide some confidence in a trend change. A new low below the start of minor wave A at 1,181.42 would add further confidence.
It is up to each member on how to approach this today according to risk appetite.
SECOND HOURLY CHART
Click chart to enlarge.
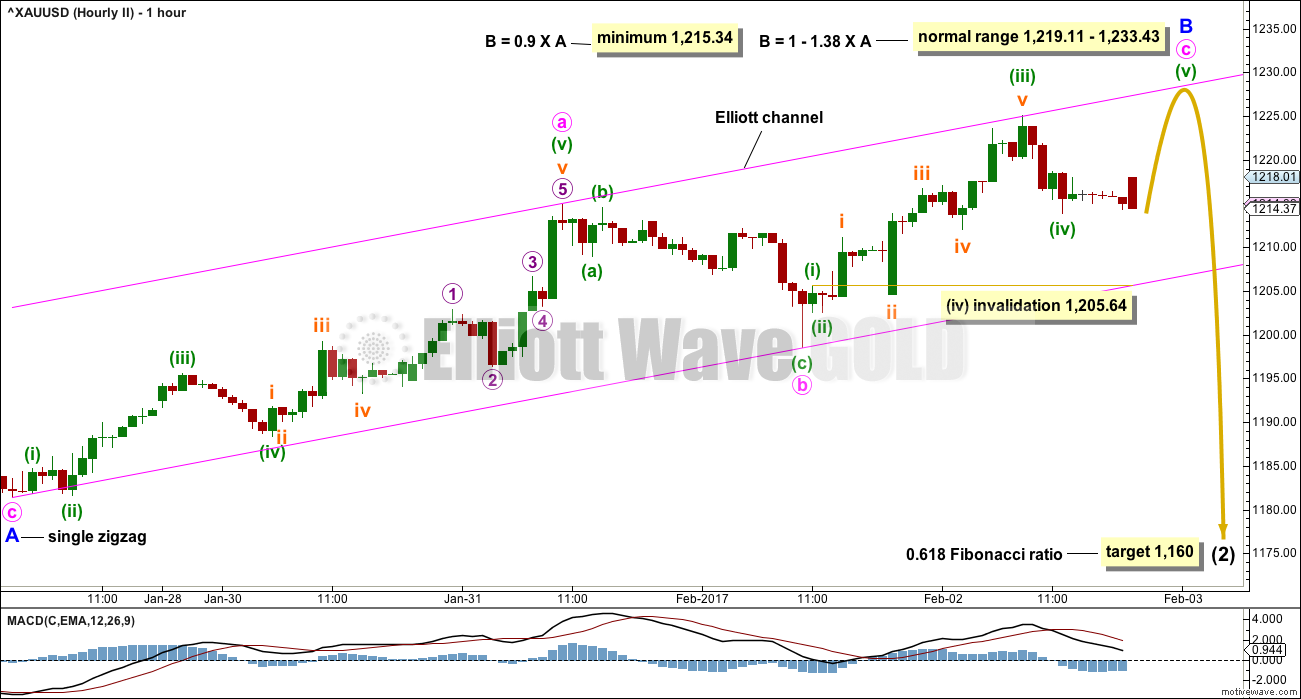
It is possible that Gold may yet see one more high before it turns.
At 1,232 minute wave c would reach equality with minute wave a. This target calculation is within the normal range for minor wave B, so if a new high is seen then use this target.
Minuette wave (iv) may not move into minuette wave (i) price territory below 1,205.64. It is not possible to place minuette wave (i) any lower down.
If this wave count is correct, then price should stay within the upper half of the Elliott channel.
ALTERNATE ELLIOTT WAVE COUNT
DAILY CHART
Click chart to enlarge.
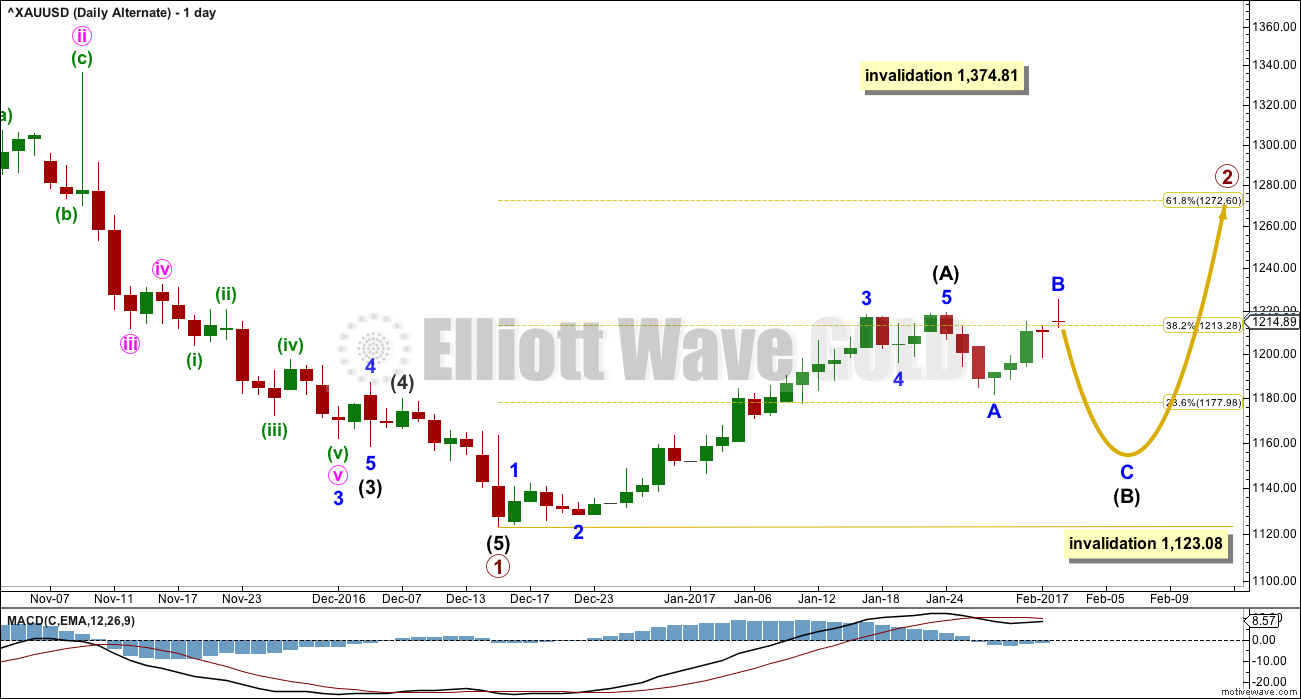
This alternate wave count expects that Gold is still within a bear market. Targets for new lows can be seen on weekly and monthly charts.
Within the bear market, a primary degree correction is underway.
Primary wave 2 is most likely to subdivide as a zigzag. Intermediate wave (A) is complete and a correction for intermediate wave (B) has begun.
Intermediate wave (B) may not move beyond the start of intermediate wave (A) below 1,123.08.
Primary wave 2 may not move beyond the start of primary wave 1 above 1,374.81.
TECHNICAL ANALYSIS
WEEKLY CHART
Click chart to enlarge. Chart courtesy of StockCharts.com.
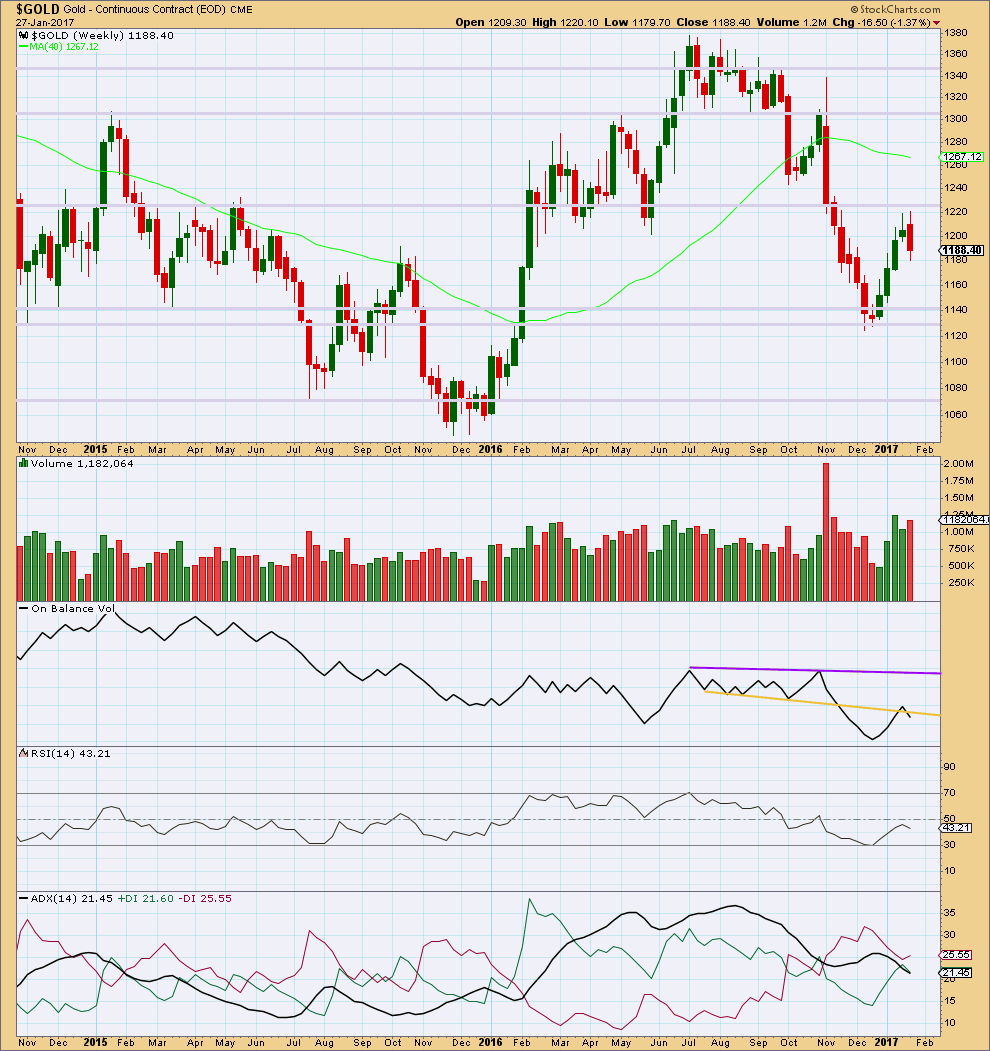
Last week completes a bearish engulfing candlestick pattern. This is the most reliable reversal pattern. It is supported by an increase in volume from the prior week. Price has found strong resistance about 1,220.
On Balance Volume gives a weak bearish signal last week with a break below the yellow line. The signal is weak because the line has been broken before.
At the weekly chart level, ADX indicates no clear trend.
DAILY CHART
Click chart to enlarge. Chart courtesy of StockCharts.com.
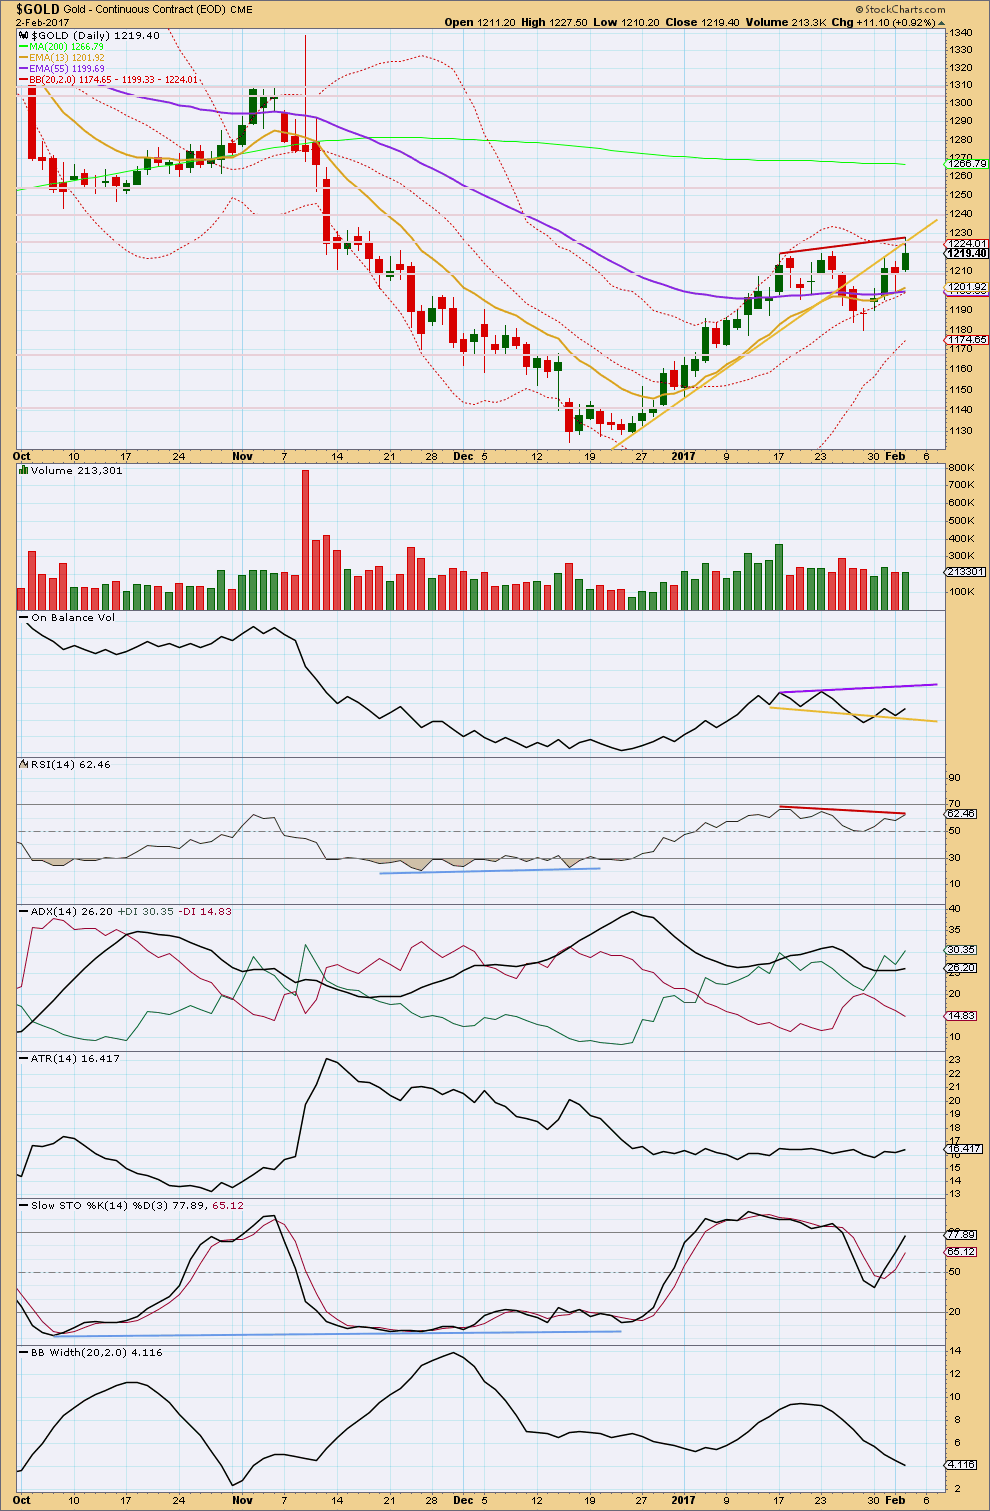
Yesterday’s long lower wick looked bullish. Now today’s long upper wick looks bearish. Price has again found resistance exactly at the sloping yellow trend line.
A very slight increase in volume today is very slightly bullish. The balance of volume today was upwards.
On Balance Volume has bounced up from the yellow line. A break below this line would be a weak bearish signal. If OBV continues higher, it may find resistance at the purple line.
From the high of the 17th of January, 2016, to today’s new high there is bearish divergence between price and RSI (red lines). This is more reliable than divergence with price and Stochastics. This divergence indicates weakness and supports the Elliott wave count, and this is exactly how B waves should look.
ADX is indicating an upwards trend, which is not yet extreme. There is plenty of room for this trend to continue.
ATR is overall flat still. If a new upwards trend is developing, it may be starting out slowly. Alternatively, ATR remaining flat may indicate something wrong with this upwards trend; that is what should happen if it is a B wave and not a new trend. This supports the Elliott wave count.
Stochastics is not extreme, but it shows strong divergence with price. However, this can persist for reasonable periods of time before price turns.
Bollinger Bands continue to contract. This is more normal of a consolidation than a trend.
GDX DAILY CHART
Click chart to enlarge. Chart courtesy of StockCharts.com.
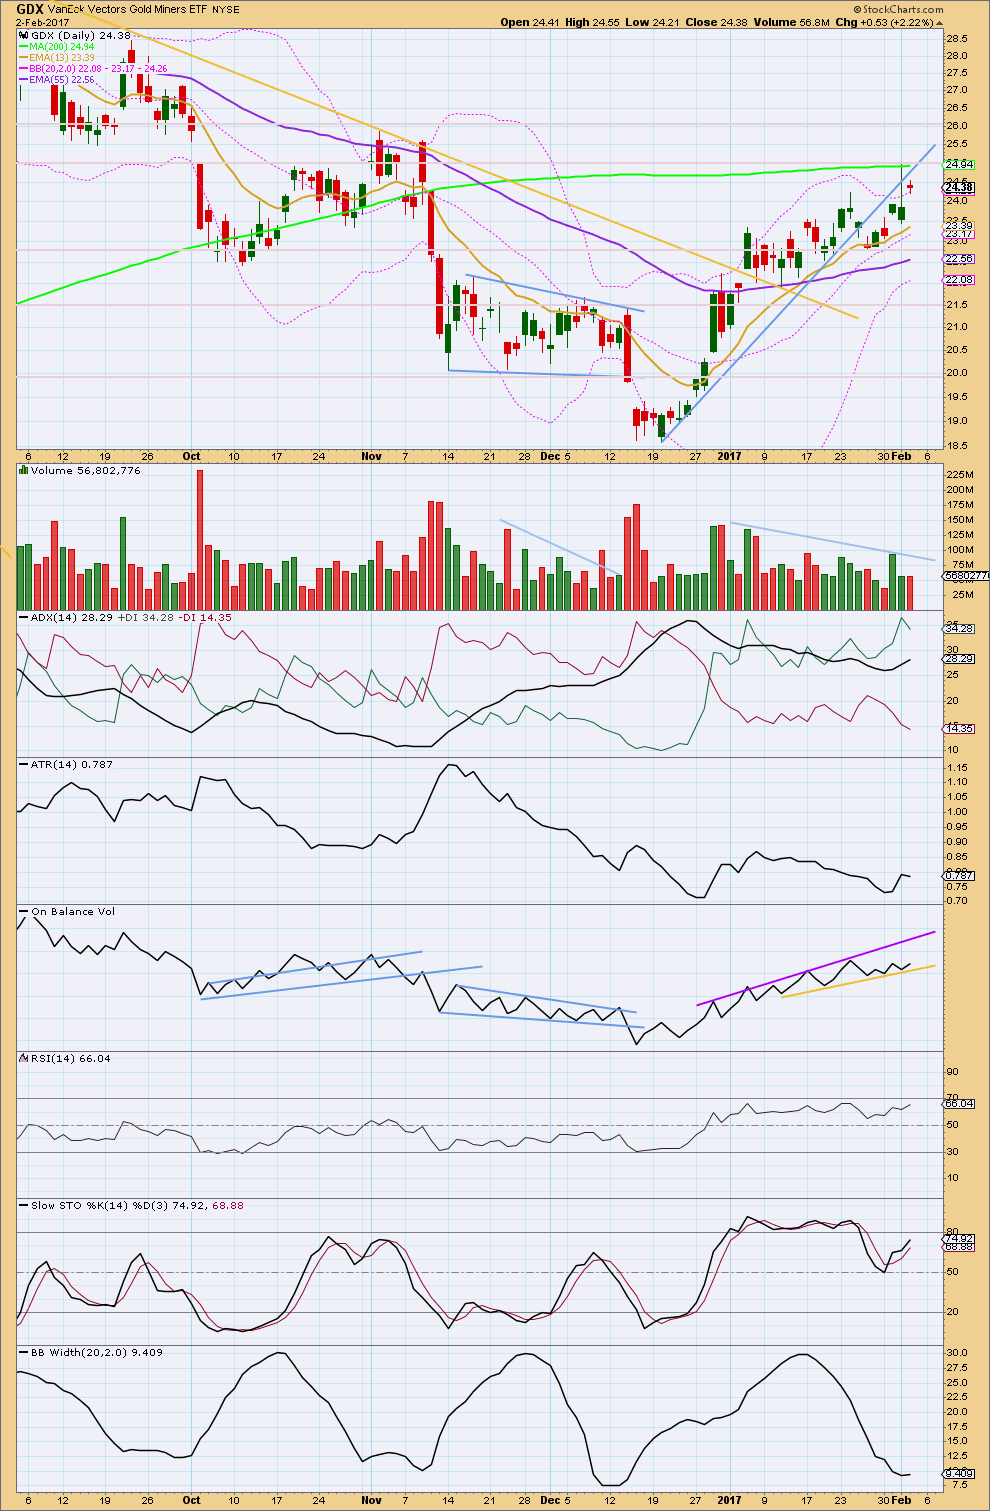
GDX is finding resistance mostly at the blue sloping line, with one overshoot.
The very long upper wick on yesterday’s candlestick is bearish. Now followed by a very small doji this puts the expectation of a trend from up to neutral.
Volume is declining as price is rising overall. This is not normal for a healthy and sustainable trend.
ADX still indicates an upwards trend is in place, which is not yet extreme.
ATR is overall flat.
On Balance Volume continues to find support at the yellow line. It has not yet given any signal.
There is very slight divergence today between price and RSI back to the 24th of January, 2016. This indicates some weakness, but it is so slight it should not be given much weight.
Stochastics exhibits stronger divergence. This is bearish.
Bollinger Bands have been contracting since the 17th of January. This is normal for the end of a trend.
There is some concern here if expecting GDX is still in an upwards trend. The apparent breakout yesterday was quickly reversed. GDX continues to find resistance about 25.00 and support about 22.75. A breakout above or below this range is required for any confidence in the next direction for GDX.
This analysis is published @ 07:53 p.m. EST.
Closing out bullish SLV 16.50/17.50 put spread for a tiny profit. I am neutral going into the week-end – too much uncertainty I am afraid. Hope everyone has a restful and relaxing weekend away from the charts! Cheerio!
No position….time for wine. Have a good one!
I was working all day…checked in for a few minutes late afternoon. Missed a lot I guess. Hope we get some clarity next week!
Have a nice weekend Verne and all.
I don’t like what TLT is doing. This move down militates against the start of a C wave to the upside and I am going to wait for price to clear 20.40 to re-enter trade. I’m out.
Thanks for posting your TLT trade ….Verne. I know, it has been a frustrating week.
Occasionally a trader gets a week where it all seems effortless (trending), but much of the time, we are having to step up to the plate to make difficult decisions.
I may have to purchase a little more JNUG (to balance my trade a bit better), and hold over the weekend [ which I am not looking forward to ].
But, thank you for your posts. I am sure several traders here are quite appreciative.
Most welcome Melanie!
It has definitely felt like a week of treading water, and calling for patience and nerves of steel.
It does look as if TLT is putting in a double bottom so perhaps we will soon begin to see some well-defined trends again…
Update on March 17 112/117 TLT bullish put spread. TLT moved below 119 today and unless it moves back up to close above 119 I will exit that spread trade for a small loss. Spread now trading for about 0.45 and was bought for credit of 0.32.
Prices in these market are behaving very erratically and have me quite concerned. Something is not quite right about the way these prices are moving but I am not sure what exactly is going on. Nothing is proceeding in any kind of orderly fashion and correlations continue to go haywire. I think I am going to move to the sidelines until we get some clarity. SOH time!
For the second hourly wave count:
I’m changing the labelling of minor B to a double zigzag. The correction I’ve labeled minute x is too deep to be part of the prior wave now labelled minuette (c) of minute y.
A double zigzag looks about right.
This means the invalidation point can be moved higher.
Yep. I think we are heading to the 1230 area for the yellow metal.
SLV shows no interest whatsoever in heading below 16.32 and I think that is bullish short term. Standing pat.
For the first hourly wave count:
I’ve looked at the 5 and 1 minute chart to see if minute i will subdivide as a five wave impulse, and it will.
A second wave correction for minute ii may be either over or close to it.
Thanks Lara! It looks like that trend line around 1205 is the level to keep a close eye on…
Yep. If that line is breached I’ll look for a throwback to go short.
I guess there is one important conclusion we can draw from today’s price action, and that is that the assumption of an on-going inverse correlation with equities and metals in the immediate term ain’t necessarily so. If prices rise in tandem, then it stand to reason they can similarly decline.
There was a time last year when they were positively correlated. I got used to that. If I had a wave count for both expecting different movements, I looked to see which one was more likely wrong.
Now they’re mostly inversely correlated… but not every day.
So my conclusion has been to just focus for each market on what I see in the technicals there, and not to let my analysis of the other influence it. That’s really hard though.
I think that is a wise approach. I have been tying myself up in knots otherwise…. 🙂
I posted yesterday about the strange new persistence of extremes across so markets. It would appear miners have joined the parade. Another above the BB excursion never seen prior!
C waves are Like third waves. If You have to ask…it usually a’int
I am doing to expert more upside for the metals toward 1232 for Gold.
Well…so much for clarification from today’s session. Gold and equities moving in lockstep make the situation as clear as mud. Someone is definitely playing possum here but who?!
I think I will let those short SLV puts be for the time being…
Yea, need clarity. This isn’t fun. Everything is out of whack….
Looking forward to seeing the technicals, but it’s a crap shoot.
Very strange indeed!
I am supremely conflicted on market direction these days. On the one hand, I am leaning toward an ongoing fourth wave correction in SPX that is incomplete and could take price down to the 2220-2300 level before the push to new highs, but on the other hand Gold looks to be quite close to some kind of correction, which would imply a move up in SPX if the inverse price correlation continues to hold. Either the correlation breaks, at least temporarily, and we get both scenarios unfolding, or it holds and they continue to go in opposite directions. Gold does not so far seem to be in any hurry to start going South. I am starting to think we are going to see a resolution to this uncertainty that is quite swift. We are going to have to be nimble methinks…..
https://www.kimblechartingsolutions.com/2017/02/gold-silver-repeat-bullish-pattern/
Hi Lara silver wave count calls for it go higher and gold count for it go gown. They do not diverge. If silver count is correct which I think it is gold will follow.
After a breakout on flat massive inverse HnS silver is back testing at 17.30-17.35 level.
Is there a wave count count for HnS??
Silver looks like it’s just started another second wave correction. That may move lower to test support at the yellow trend channel I have on the Silver daily chart.
That could happen and remain above the invalidation point, while Gold moves down for it’s C wave.
We may get some confirmations on direction Friday morning with the jobs report and other data releases.
Besides the 8:30 a.m.ET jobs report, there is services PMI at 9:45 a.m., ISM nonfmanufacturing at 10 a.m. and factory orders, also at 10.
http://www.cnbc.com/2017/02/02/companies-were-expected-to-ramp-up-hiring-in-january-even-with-higher-costs.html
So here’s a look at Bollinger Band contraction for Gold over the last two years. Based on this chart and the one below that I did for SPX, I think I’m seeing some patterns.
It looks like BB band contraction moves generally breakout in the direction of the Intermediate trend. That said, some breakouts can go against the trend if the correction is a large one. This could be an important learning.
So looking at the Gold chart here, during the move up in 2016, the BB contraction breakouts were up except for the large correction in May. That breakout was down.
So where are we now? If we assume we are in an uptrend, the breakout should be up…. BUT this may be a deep correction which means the breakout could be down.
So it’s not super clear yet which way the breakout will be, but we do know that if the breakout is down, then it’s likely to be a deep correction. The .618 target would qualify. Let’s see what happens.
Great charts Dreamer!
This longer term chart should replace the BB posted earlier for GDX.
The longer timeframe for GDX Bollinger Band compression shows that during the uptrend in early 2016, the breakouts were upwards and then during the downtrend in later 2016, the breakouts were all downwards.
So if we are in an uptrend now, the breakout may be upwards.
We need to watch this closely.
No change to GDX count
That expanding ending diagonal looks perfect now Dreamer. If that count is right, it should be down from here for GDX
There might be another small H&S pattern in play that could break the uptrend channel
A little addition to Lara’s GDX chart for emphasis…
Awesome analogies Dreamer. B Bands have been one of my favorite gauges over the years and your chart shows some neat correlations. I am actually hoping we get a bit more movement up tomorrow which I think would provide a compelling entry point (and let me buy back some short puts even cheaper!). I hope the correlation continues though. I have noticed a break-down recently in the BB metric that I have used for a long time to time the execution of many of my trades. Upper BB penetration and BB compression of late have been enduring for far longer than I remembered. Signs I believe, of a GSC topping process.
It would be awesome to see a comparitive chart of SPX for a similar time period…hint! hint! 🙂
Hint taken. I’ll work on it after dinner and post in the S&P comments 🙂
Thanks for the charts Dreamer. Awesome work!
Verne,
I took a look at SPX and on the daily, the BB contractions were not as pronounced as they are with GDX due to less volatility.
So I looked at a WEEKLY 5 year timeframe. Interestingly, it shows almost all upwards breakouts. That is not a surprise since we know SPX has been in a strong uptrend.
The only two times when the breakouts were down was during the deep correction in late 2015 that lasted into the beginning of 2016.
This could shed some light on the 2nd GDX BB chart that I posted above. The assumption is that GDX is now in an uptrend, so the BB breakout could be up. That said, based on what SPX shows, if its time for a deep GDX correction, then the breakout could be down this time before the uptrend resumes. Like I said above, we’ll need to watch this closely.
Hey, thanks Dreamer for doing that! I’ll just relax with a glass of wine and look at some other stuff…
The BB contraction for the S&P seems to happen at the end of a downwards pullback within the larger upwards trend, and at the beginning to middle of the big downwards waves in 2015
🍷🍹Enjoy. You’ve been working hard lately with lots of extra analysis and videos!
Thank you Dreamer 🙂
I’m trying to do some free analysis on EWG at least twice a week. So if any members have requests please let me know.
I’m also watching for an entry to go short for NZDUSD and EURUSD. When I see a set up there I’ll post charts in comments if I don’t have time for a full write up.
On a more personal note, we’ve had surf all week this week. I’ve managed to surf so much I’m surfed out 🙂 Super happy, stoked and looking forward to a nice family weekend
So glad to hear you are enjoying “spaghetti arms” Lara! 🙂
Thanks Dreamer!