
An inside day for Friday’s session leaves both Elliott wave counts valid. Classic technical analysis may assist to determine whether the main or alternate Elliott wave count is correct.
Summary: Use the pink channel on the hourly charts. A break below would indicate a downwards wave underway. If price touches the upper edge again, expect a reaction there. The target for this next wave down to end is at 1,164 – 1,160. A new low below 1,210.53 would add confidence in targets.
New updates to this analysis are in bold.
Last monthly and weekly charts are here. Last historic analysis video is here.
Grand SuperCycle analysis is here.
MAIN ELLIOTT WAVE COUNT
DAILY CHART
Click chart to enlarge.
This main wave count has a better fit for prior movement. To see the difference between this main wave count and the alternate below please refer to last historic analysis linked to above.
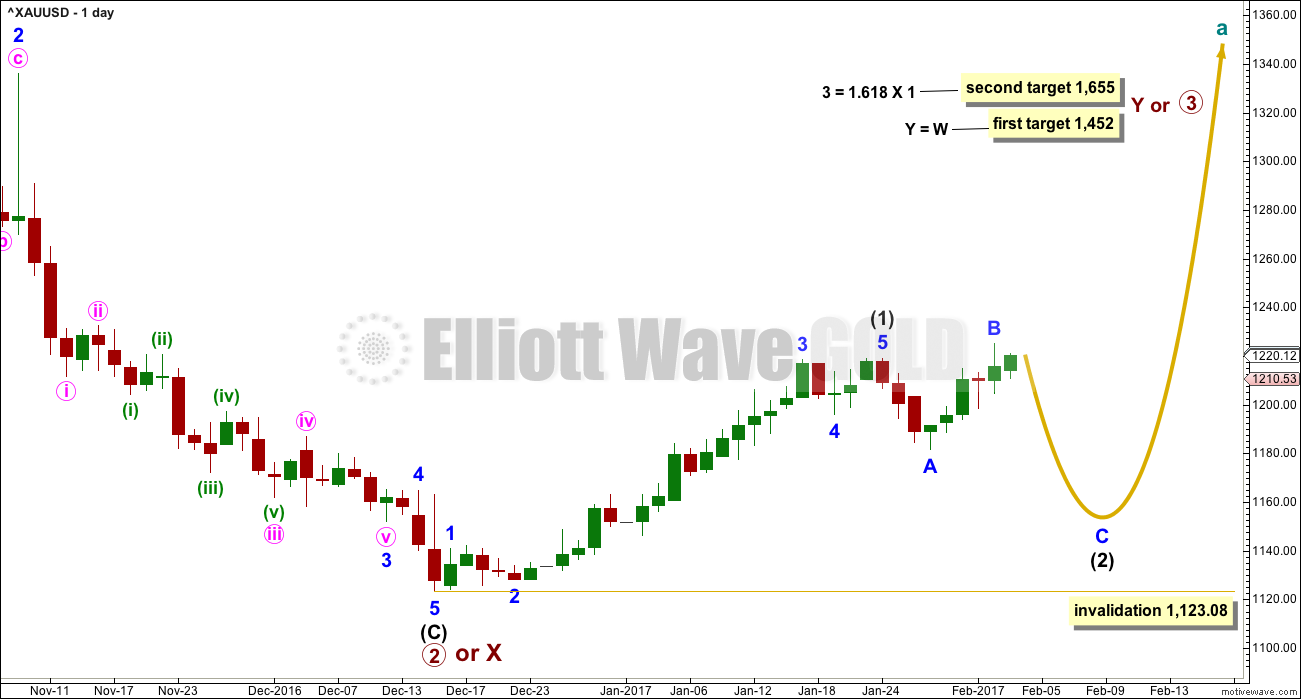
This main wave count expects Gold has had a primary degree trend change in December 2016. The new upwards wave is either a primary degree third wave, or a primary degree zigzag to complete a double zigzag.
At this stage, the degree of labelling within intermediate wave (2) is tentatively moved up one degree. Minor wave A is complete and now minor wave B may be complete. If this is correct, then minor wave C down should be relatively time consuming. Intermediate wave (2) at its end should be somewhat in proportion to intermediate wave (1), which lasted 30 days. Intermediate wave (2) is expected to last a Fibonacci 21 or 34 days.
Intermediate wave (2) is labelled as an incomplete expanded flat correction. These are very common structures. Within them their B waves make a new price extreme beyond the start of the A wave. B waves of expanded flats should exhibit clear and strong weakness.
The first in a series of second wave corrections for Gold’s new impulses is usually very deep. Intermediate wave (2) is expected to be at least 0.618 the depth of intermediate wave (1), and may be deeper. It may not move beyond the start of intermediate wave (1) below 1,123.08.
To label intermediate wave (2) complete as a very quick shallow zigzag at the low of minor wave A would be possible, but the probability is extremely low. It is much more likely that an expanded flat is unfolding.
FIRST HOURLY CHART
Click chart to enlarge.
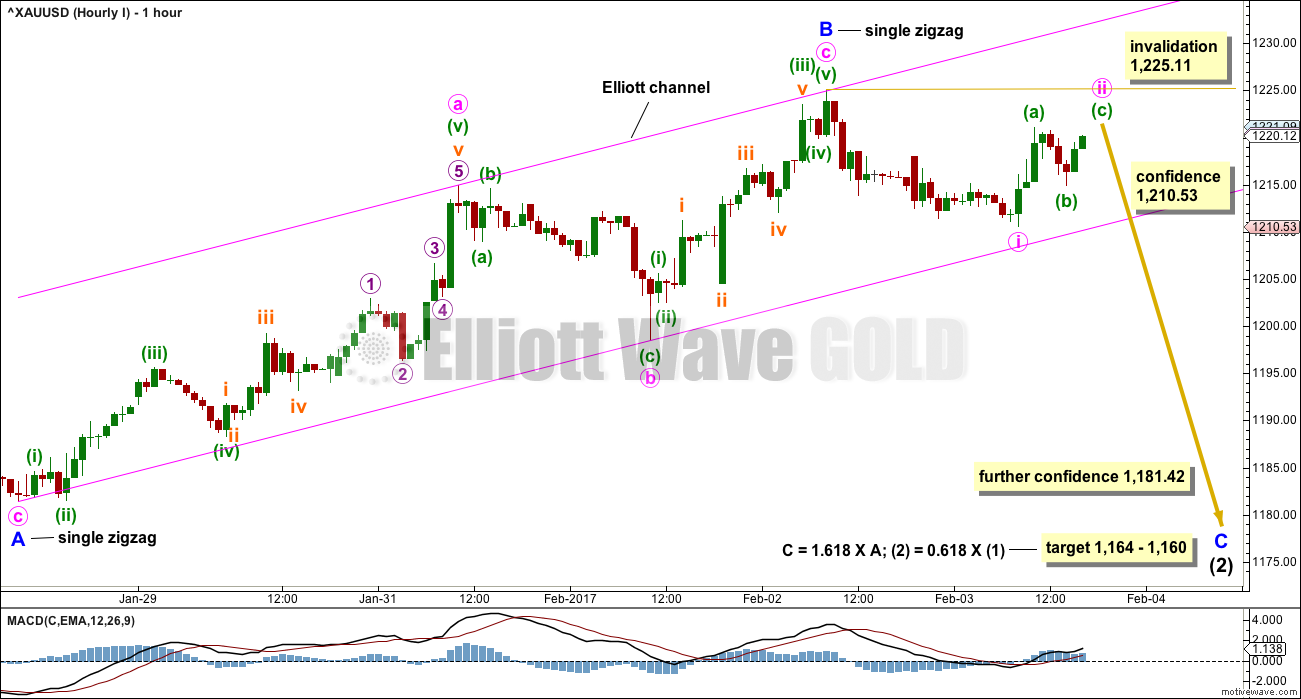
Minor wave A is seen as a zigzag for both wave counts. The difference between the two is the structure of minute wave c within minor wave B.
There is no Fibonacci ratio between minute waves a and c.
The target is a small $4 zone calculated at two degrees. It assumes the most common Fibonacci ratio between minor waves A and C for an expanded flat.
A new low below the Elliott channel would add reasonable confidence to this wave count. Look out for price to breach the channel, then bounce up and retest the underside for resistance. If price behaves like that, it would offer a good entry to join a downwards trend.
A new low below 1,210.53 would invalidate the second hourly chart below and provide some confidence in a trend change. A new low below the start of minor wave A at 1,181.42 would add further confidence.
SECOND HOURLY CHART

Click chart to enlarge.
It is possible that Gold may yet see one more high before it turns.
Minor wave B is relabelled today as a possible double zigzag that would be incomplete. The downwards movement labelled minute wave x is too big to be a correction within the prior upwards wave labelled minuette wave (c); this is a separate wave.
Double zigzags are very common structures. The second zigzag in the double exists to deepen the correction when the first zigzag does not move price deep enough. To achieve this purpose X waves within double zigzags are normally relatively brief and shallow. Minute wave x fits this description. So far this looks like a normal double zigzag.
Within the zigzag of minute wave y, if minuette wave (b) continues lower, it may not move beyond the start of minuette wave (a) at 1,210.53.
ALTERNATE ELLIOTT WAVE COUNT
DAILY CHART
Click chart to enlarge.
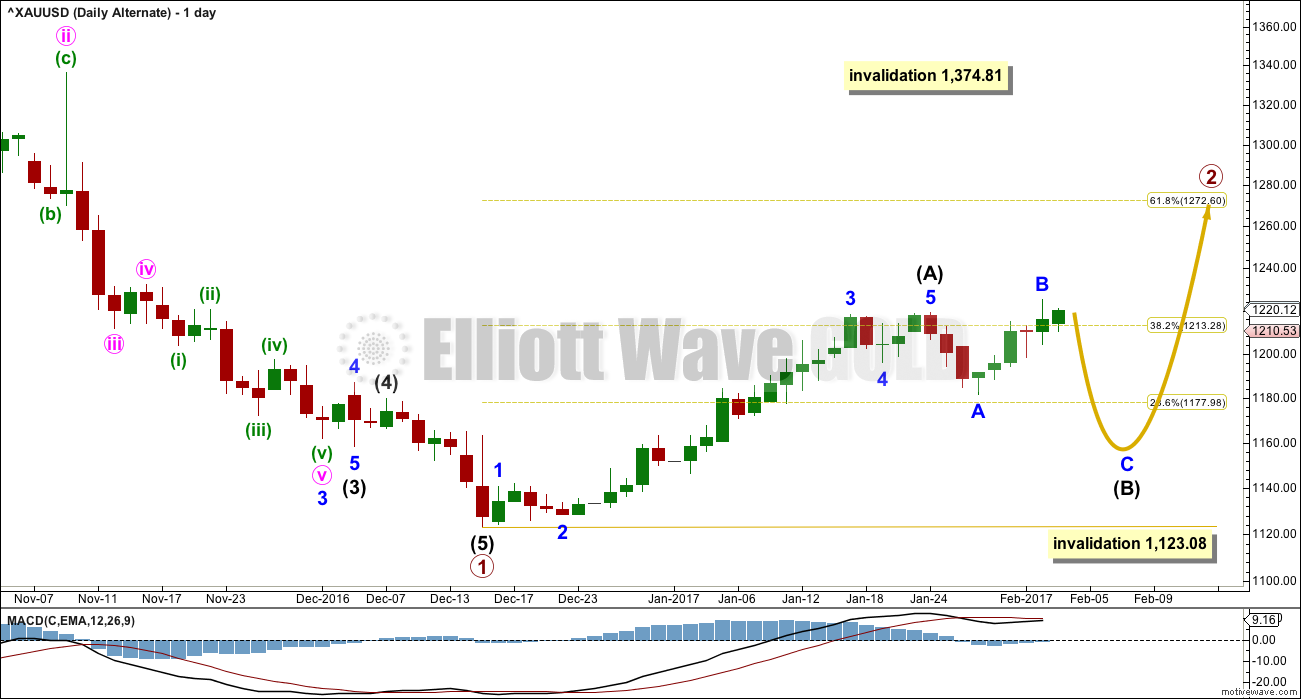
This alternate wave count expects that Gold is still within a bear market. Targets for new lows can be seen on weekly and monthly charts.
Within the bear market, a primary degree correction is underway.
Primary wave 2 is most likely to subdivide as a zigzag. Intermediate wave (A) is complete and a correction for intermediate wave (B) has begun.
Intermediate wave (B) may not move beyond the start of intermediate wave (A) below 1,123.08.
Primary wave 2 may not move beyond the start of primary wave 1 above 1,374.81.
TECHNICAL ANALYSIS
WEEKLY CHART
Click chart to enlarge. Chart courtesy of StockCharts.com.
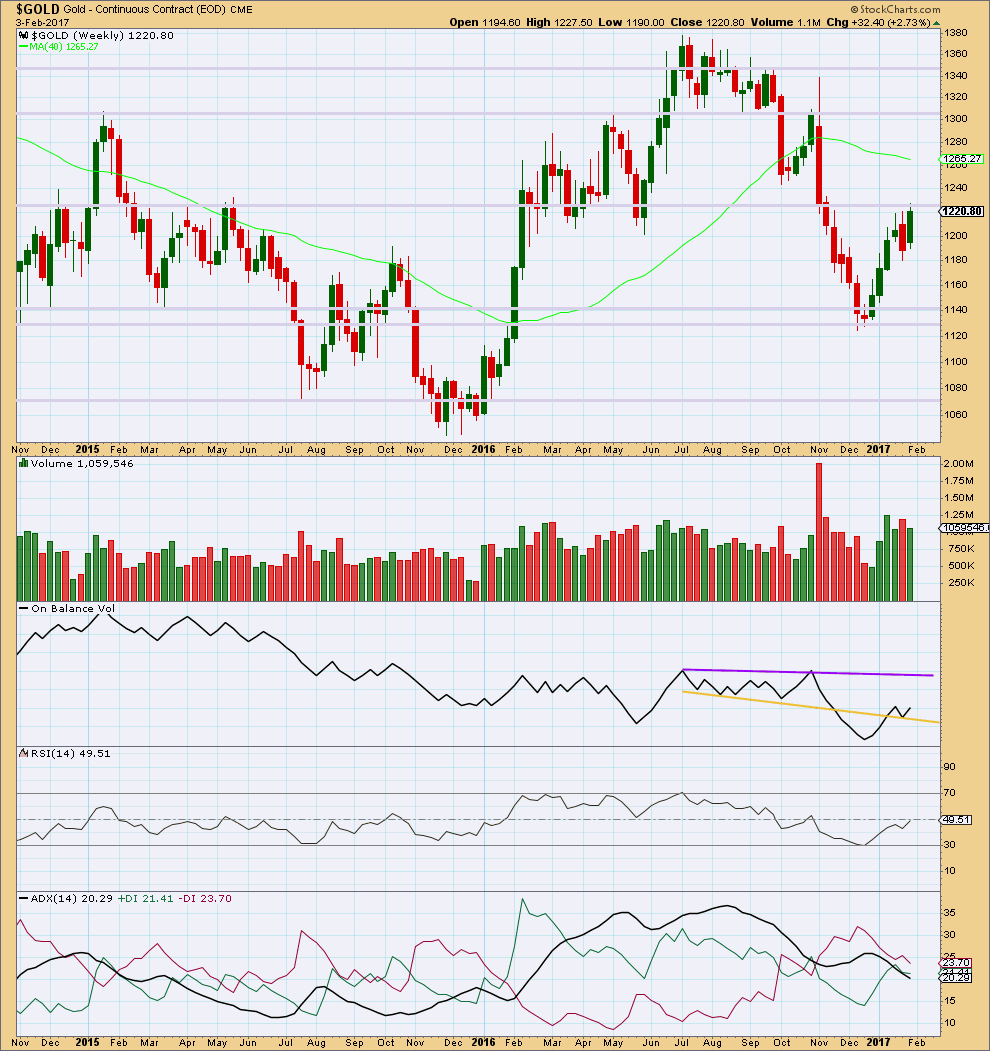
The bearish engulfing candlestick pattern of last week has failed. Price has made a new high.
Since four weeks ago, volume is overall declining. Price is still finding strong resistance about 1,225.
On Balance Volume has bounced up off the yellow support line. Next resistance is some distance away at the purple line. Another breach of the yellow line would be a weak bearish signal.
RSI is not extreme and exhibits no divergence with price. There is plenty of room for this market to continue higher, or lower.
ADX is strongly declining, indicating a consolidation. The -DX line remains above the +DX line, so at this stage a downwards trend would be indicated if ADX turns upwards.
DAILY CHART
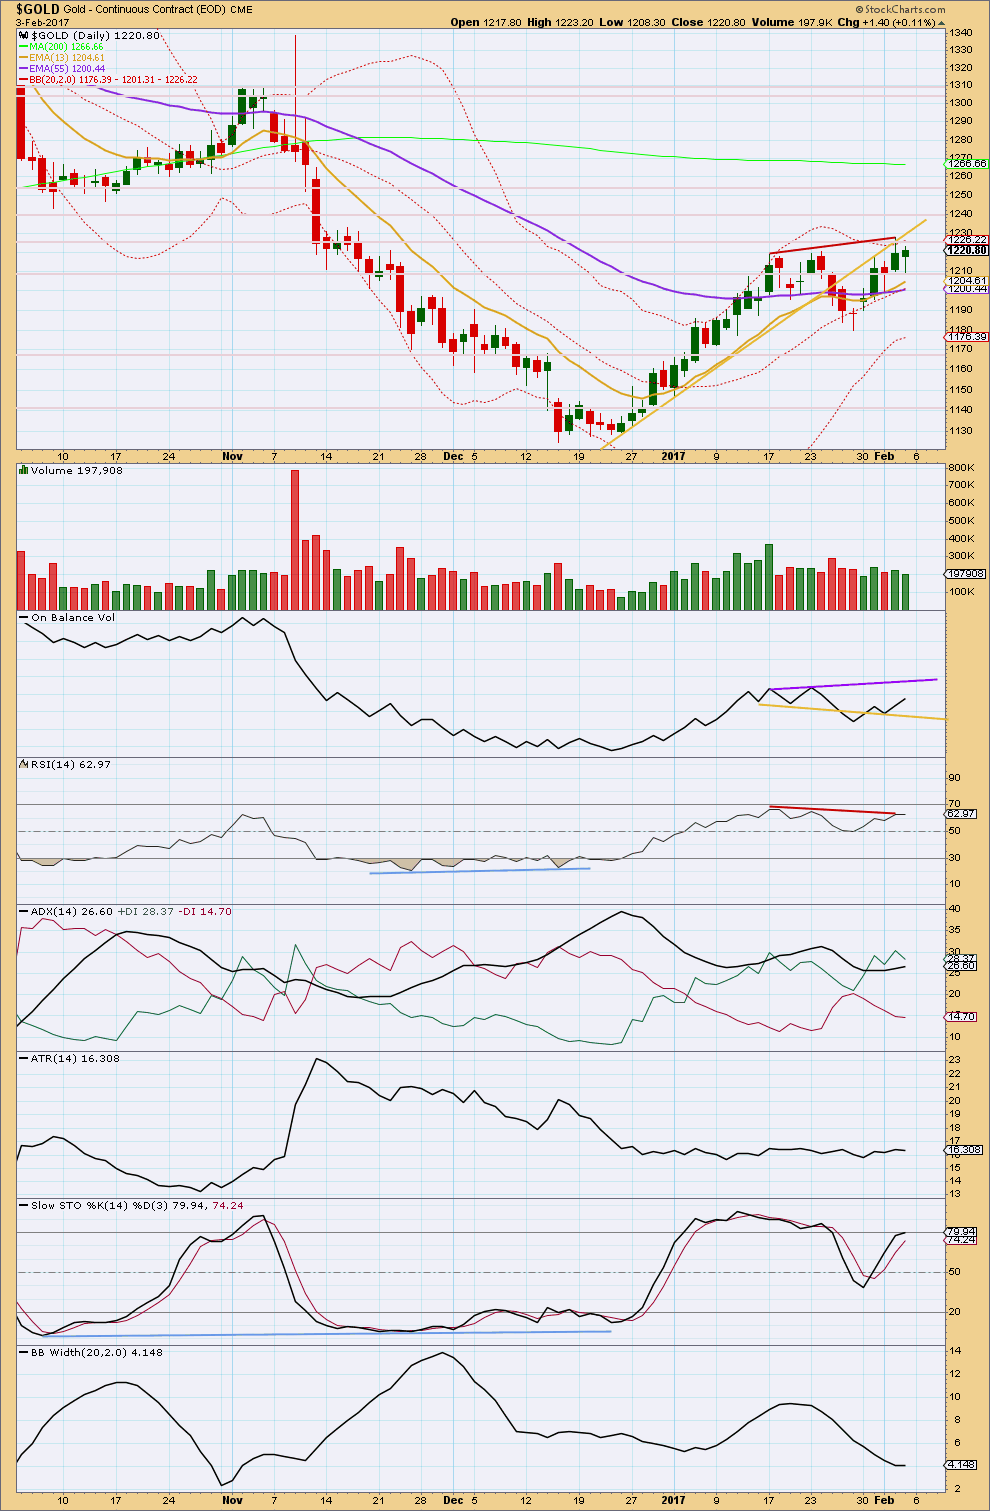
Click chart to enlarge. Chart courtesy of StockCharts.com.
Gold is range bound with resistance about 1,225 and support about 1,180. A breakout above 1,225 on a day with higher volume would be an upwards breakout. If that happens, then we may expect the upwards trend has resumed. A break below 1,180, preferably but not necessarily with stronger volume, would be a downwards breakout. If that happens, we may expect a deeper pullback or a downward trend is underway.
Next resistance is about 1,240. Next support is about 1,165.
On Balance Volume gave a small bullish signal with a bounce up from the yellow line. There is some divergence between the highs of 2nd of February and 24th of January: price made a higher high, but OBV made a lower high. This indicates some weakness.
The balance of volume for Friday’s session was upwards and volume was lighter. This supports the first hourly Elliott wave count.
The divergence noted with red lines on price and RSI supports the Elliott wave count. This is exactly what should be seen for B waves.
ATR remains flat indicating the market is trending. ADX is still slightly increasing, indicating an upwards trend that is not yet extreme. With price essentially moving sideways for the week, some suspicion may be had on ADX.
Stochastics exhibits divergence with price at the last high. This also supports the Elliott wave count.
Bollinger Bands are tightly contracted. If this is an upwards trend, as ADX suggests, then it looks tired. Bollinger Bands often contract towards the end of a trend as volatility declines.
The longer term 200 day moving average is still declining, indicating the longer term trend is still down.
The mid term moving average is now slightly increasing and this week the short term average crossed above it. This indicates a possible change to an upwards trend.
Bullish moving averages and ADX disagree with the Elliott wave count.
GDX DAILY CHART
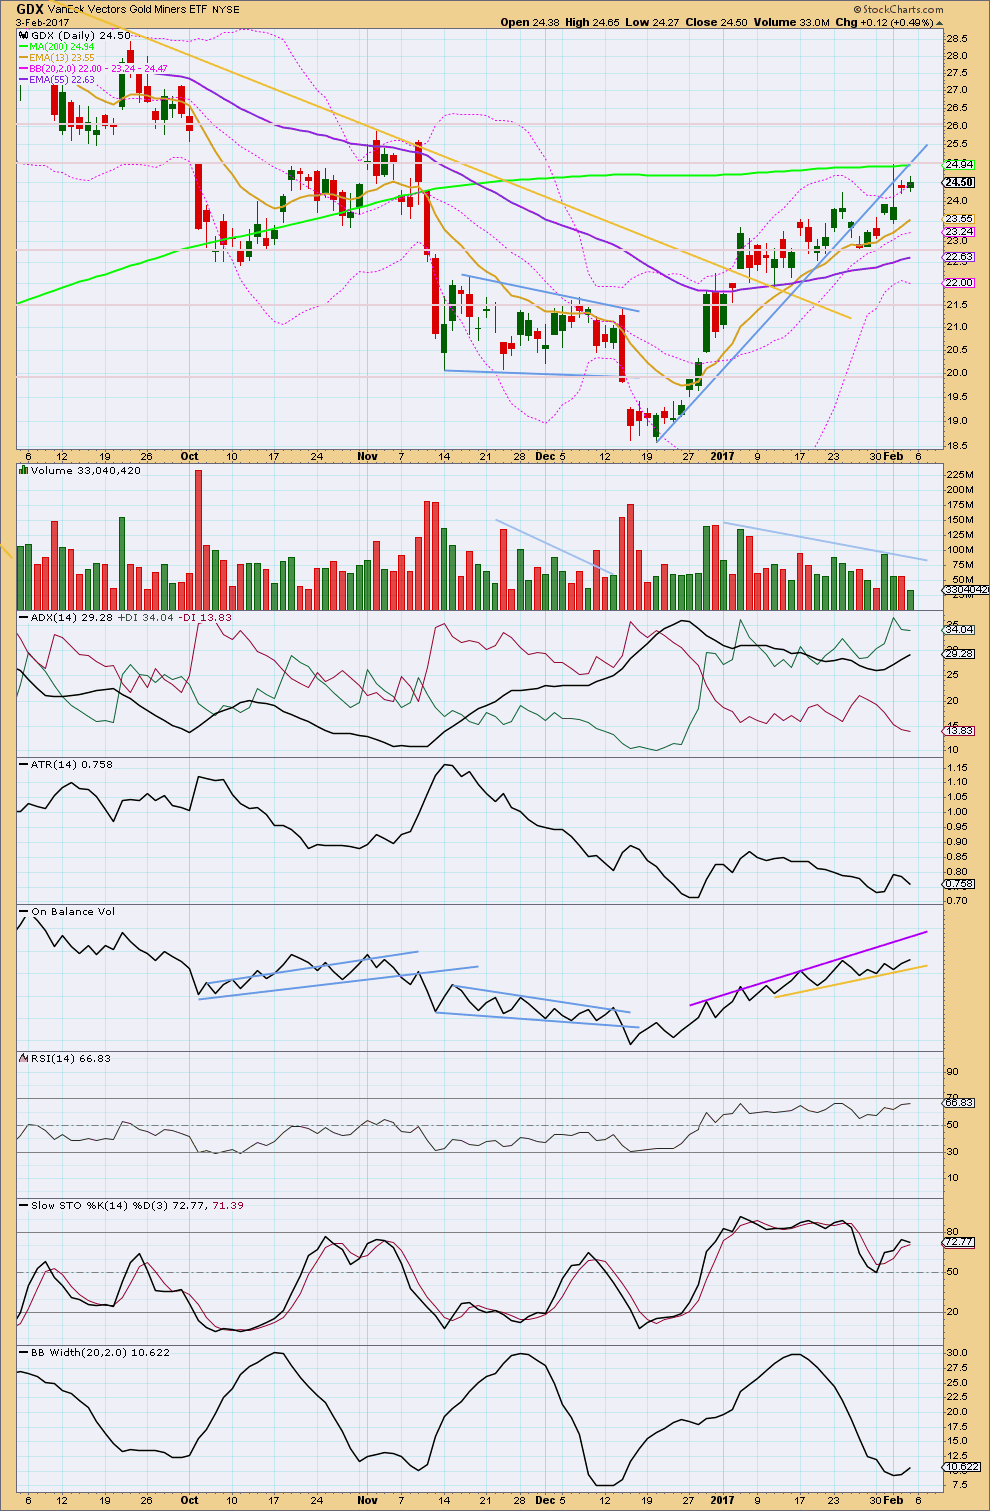
Click chart to enlarge. Chart courtesy of StockCharts.com.
GDX is finding resistance mostly at the blue sloping line, with one overshoot.
The very long upper wick on the 1st of February’s candlestick is bearish. Now followed by a very small doji this puts the expectation of a trend from up to neutral. Another small range day for Friday comes with overall upwards movement but very light volume. There is not support for upwards movement for price on Friday. This is bearish.
Volume is declining as price is rising overall. This is not normal for a healthy and sustainable trend.
ADX still indicates an upwards trend is in place, which is not yet extreme.
ATR is overall flat.
On Balance Volume continues to find support at the yellow line. It has not yet given any signal.
Divergence noted yesterday between price and RSI has now disappeared. RSI is not yet extreme. There is room for price to rise further.
Stochastics exhibits strong divergence. This is bearish.
Bollinger Bands have been contracting since the 17th of January. This is normal for the end of a trend. At the end of this week, Bollinger Bands may be beginning to expand.
There is some concern here if expecting GDX is still in an upwards trend. The apparent breakout was quickly reversed. GDX continues to find resistance about 25.00 and support about 22.75. A breakout above or below this range is required for any confidence in the next direction for GDX.
This analysis is published @ 07:10 p.m. EST.
Lara, have you completely ruled out an expanded flat in this position? Sure seems like we are in a 3rd wave up now and not a B wave. This gives Intermediate wave 2 more proportion than just a 3 day pullback, doesn’t it?
1. Technically it would be a regular flat; B would be just 1.03 X A, an expanded flat needs B to be 1.05 X A minimum
2. Intermediate (2) would have lasted 8 days to intermediate (1) 21 days. That’s probably reasonably acceptable.
3. Intermediate (2) would be a 0.388 correction of intermediate (1); still shallow.
So looking at it a bit further, no, I should not rule this out. This looks better than seeing my minor A as a quick shallow zigzag. And thinking about that further, the wave down I have labelled minor A did fit better as a five than a three…
Makes sense. Thanks.
This does not look like getting below 1232 with 1225+ holding…..Oh well.
Anyone considering the possibility that intermediate 1 is not finished yet? That maybe we’re in a middle of a minor 5 forming a blow off top?
Volume for today is lighter. Three days in a row, price is rising on declining volume. That doesn’t look like a blowoff top.
The three day pullback I’m labelling minor A fully breaches a channel no matter how it’s drawn about prior upwards movement. That doesn’t look like a fourth wave, it looks like a separate wave to intermediate (1).
I’ve charted the idea here. It doesn’t look too horrible. But at the end of the day it has no divergence in expected direction with the main wave count so publishing this idea as well wouldn’t offer anything useful to the analysis.
GDX and GDXJ both powered past their 200 dma today. There was absolutely no resistance to upward movement at this pivot. I am now thinking we will see some additional movement above the 200 dma and it will then act as support at the next pull back. I am glad I kept my short positions light. It is a fair bet that both NUGT and NJUG will make a very serious assault on their own respective 200 dmas. I think PM bears need to be very cautious these days. Price tells all.
JNUG Daily over the past year and one month
Thanks Alan for your great call on 1270s on Gold when it was trading at some 1130-40. Sold JNUG which i got at 4.12. Dont want to wait for 1270 🙂
Here’s some food for thought while we are all figuring this out. I am by no means any expert in any way, but I was puzzled about the b extending above a so much…so while looking at bonds, I noticed US02 gapped down below the lower BB in a massive fashion on Jan 25 daily chart, and that it’s now going toward the middle. The current price is still below the US02 a segment. So, in theory, b is still well below a, and c is imminent?? How’s that for continuing to get dizzy on the charts. Not sure it means anything, but it was an interesting find.
Record JDST volume today!
Capitulation. We should see the same thing on NUGT and JNUG tomorrow with little upside progress to signal distribution. If that happens I will add to my short positions, or else will be unceremoniously stopped out….once again! 🙂
As I have observed previously, persistent price extremes appears to be the norm in markets these days. I am opening these small trades several weeks out just to prove that point to my own satisfaction. I would not be at all surprised to see prices stay pinned close to the upper BB for several more days as counter-intuitive as that would seem, especially since it would be quite a departure from recent past price action. Yikes!
My Spot Gold chart just hit 1235.01…Silver 17.74
Does anyone get the feeling we are getting pretty bullish Gold and Silver here?
Don’t be faked. Defi an ending diagonal forming in gold. This thing will fall off a cliff and surprise everyone….just don’t know when. This move up just isn’t right for a bill market. Technicals and volume aren’t solid!
Probably a good time to buy dust near its low with a tight stop below.
Upon a cursory look at Gold and Silver charts, despite the upper BB penetrations, other indicators suggesting we could go even higher short term. I would want to see multiple classic reversal signals prior to going all in on the short side, such overbought RSI, negative MACD divergence, distributive volume, and a nice bearish engulfing candle…at the moment there is no doubt that sentiment is uber bullish!
Speaking about technicals, here is another thing that bothers me a bit. We have seen over the years how persistently bearish indicators were not at all accurate in predicting market direction, the persistent low volume being a classic example.
I have therefore wondered whether the absence of bearish signals, and even more critically, the presence of normally bullish indicators can be relied on to be any more accurate than the bearish ones have been. I think we are in totally uncharted territory with this unfolding GSC topping process.
I will be looking for distribution tomorrow with high volume and a red candle to tell me it’s done.
Agree. Miners are closing strong, but volume is below average.
Sometimes that happens when so called “smart money” is buying ahead of the crowd and a firmly established trend…things are looking quite bullish…
Hi Joe:
Are you talking about just the Y wave?
I don’t see only zig zags for the entire move…
Price does indeed trump all John. With that no one can disagree! 🙂
Except at the end of a trend. When price is at a high and the trend is over price is not indicative of what’s going to happen next.
It is the last four sessions John that I’ve been expecting wave B to end. Not weeks. If you’re going to have a go at me then at least be accurate. Exaggeration of what I get wrong is not appreciated.
He does get a bit edgy doesn’t he? 🙂
Adding GLD Feb 17 117.00 puts for 0.83 per contract.
Alan, haven’t heard from you in awhile… what’s your current thoughts on this madness?
JDST printing a new 52 week low today. I am glad I minded my stop on that trade.
JNUG nowhere near its 52 week high. A great example of why these ultra leveraged instruments are generally not great for a buy and hold approach.
Yeah, because it’s so hard to get it right. Holding JNUG since December low = 200% gain in less than 2 months!
Yep! Getting the trend right is absolutely critical. If the uptrend has indeed resumed and everything is pointing in that direction, DUST and JDST have a reverse split in their near term future I suspect.
Powerful move up today in miners with GDXJ outperforming GDX by a wide margin. GDX broke through 200 MA. Silver above neckline and outperforming gold.
All excellent buy signals, but I just can’t do it. The RSI for Gold on the 1 hour and 4 hour is at very high levels which may indicate a pullback is coming soon.
Looks like Gold just reached 1233 and is continuing up! Or has it just topped?
I have been watching SLV for any signs of a reversal and so far nada.
Silver usually gives a heads up on these trend changes but so far it is pointing straight up. I am starting to think we are going to see another after hours brutal reversal so typical of the metals. Holding a very small contingent of GDXJ 40 strike puts. This uptrend should be just about done if the main count is correct. If price keeps going up and looks as if we are going to close above 40 I will probably bail. Either you are right about a trade or you are wrong. The trick is figuring out as quickly as possible if it is the latter… 🙂
Yeow! That is one monster green candle extending above the upper BB. This is nuts!
Who is buying this stuff at better than 3 standard deviations away from price norm???!!!
I like today’s price action in TLT. I have to say the banksters got the best of me last Friday with that pre market close spike down. It is now looking like they were “shaking the trees” ahead of the C wave up. Adding to my long position with Feb 17 120.50 calls at 0.88 per contract. Opened limit sell to close at 1.50 which should execute around 121.25
All stop remains at any close below 119.00
TLT should exceed its Jan 12 123.14 wave a high before wave c up is done. At that point TLT’s mirror image TBT, should present a good prospect for rolling TLT put credit spreads.
Hourly II updated:
I agree with Dreamer’s labelling of minute y.
The 0.382 Fibonacci ratio is used to calculate the target because it results in a target which is within the normal range.
While this is the normal range, it is not necessarily where B must end. Sometimes B waves are longer than the normal range.
When B is = 2 X A at 1,256.81 then the idea of an expanded flat should be discarded based upon a very low probability.
I can see still divergence at the hourly chart level. If there is further divergence at the daily level with this new high then that would support the EW court. Lets see how this session ends.
At some pont we may have to consider the possibility of a third wave up underway.
Okay, I’ll publish something. It will look wrong though, because then we’d be seeing an intermediate degree second wave lasting only 3 days, not looking like a three, and being only close to the 0.382 Fibonacci ratio of the first wave.
It is possible, but the probability of that is very low.
I agree wholeheartedly with that analysis . Every reversion to the mean trade I have made the last few weeks has sadly been unceremoniously hammered so I am a little skittish. I have to laugh out loud at my musing about what the banksters would do to derail short positions at the end of intermediate 1. Seems to me it is now just a bit overdone doncha think? 🙂
I am going to venture back into that arena with a small initial position in GDXJ. Buying the March 17 40 strike puts for 2.2 apiece. A move back to 38 should see am trading for about 3.5. Just a tiny position.
How long can these high flyers trade with this kind of standard deviation extreme??!!!
An expanded flat with a B wave that is longer than normal would throw most off.
If price goes up much higher then most traders are going to become convinced it will keep going up. Right before the C wave falls.
I have to go with the most common scenario, that way we’re more likely to get the next direction right. Expanded flats are so common, and intermediate (2) should’t be that brief and shallow.
I remain conflicted about market direction. Opening an option straddle on the Diamonds in the form of March 17 expiration 200 strike puts and calls for 5.60 per straddle.
In a complete departure from previous price action behavior, the miner ETFs continue to trade above their BBs for a third straight day. Look at charts for the last several years and you will not see any other examples of this happening. Either we are in a bull run of unprecedented vigor, or the algo programmers have added the miners to their list of targets for distorting trade signals. This market is becoming increasingly strange…
No one can ultimately abrogate a reversion to the mean principle- not banksters, and certainly not algos. The longer reversion is delayed the more violent it is when it happens…
For those following Natural Gas, Lara had published analysis on January 16th. The main wave count with the higher probability has been invalidated so the Alternate is now in play.
“Within intermediate wave (3), no second wave correction may move beyond the start of its first wave below 3.099. If this main wave count is invalidated, then the alternate below would be used.”
Yep. I expect now that NGAS is now in a cycle degree downwards wave. That should last about a year.
If anyone is holding NGAS long you may like to reconsider that. If not exiting now, then ask yourself two questions:
1. What is it that I think price cannot do? If you think it can’t fall below a specific point, then exit if it does that.
2. At what point would the downwards wave be so deep it would prove my analysis wrong? Exit at that point.
TLT March 17 115/117 bull put spread for 0.45 crèdit per
contract. Ten contracts risk outlay of 2000.00 If TLT trading below 115 At expiration for reward of 450.00 If not. Will èxit spread on any CLOSE below 119.00
At 8:20AM , may be Wave B completion as per 2nd hrly.?
Assuming that Lara’s hourly 2 count is in play, looks like Gold could go up toward 1,240 before completing Minor wave B.
–or–
a much more bullish count is needed
This may be the path for gold if wave 2 is not complete yet.
Thanks Dreamer.
I think you’re right. In the area of 1240 waiting for a trend reversal. I would be surprised if the upward movement will continue. 1248 the next target if the uptrend will continue.
Hourly wave count invalidated. Gold at 1226 +.
Another HnS in 2 hour break out above 1217 NL.
Silver needs to confirm the break out.
Gold to silver ratio and XAU to gold ratio both pointing direction of metals UP.
4 hour chart of silver has been forming HnS within HnS with break outs since last few weeks.
Is it possible wave 2 completed???
It appears first hourly is still in play. Came close but 1225.11 was not taken out? Or was it?
Anyways the move up is not impulsive from Friday’s low?
For weekend Fun!!!
Lara may appreciate this??
https://www.youtube.com/watch?v=YNLuZfA4eO8
I like the pics, not so much the music.
This is more my cup of tea.
https://www.youtube.com/watch?v=XL4270xbaiw
Cool! I love the sea!
Powerful HnS pattern where silver broke out is now backtesting the BO line. This HnS is also seen in all time period.
If it is the case than wave 2 must be over.
Lara:”To label intermediate wave (2) complete as a very quick shallow zigzag at the low of minor wave A would be possible, but the probability is extremely low. It is much more likely that an expanded flat is unfolding.”
Quiet a few analysts Making ver bullish cases for the metals, psrticularly silver. It is a challenge to see Gold in a big C wave correction with Silver in the middle of a third wave. So many strange things going on with prices I suppose anything is possible. The bullish case also means miners etfs stay at the top of BBS uncharacteristcally. If this happens It means sentiment extremes continue to spread. Amazing!
Papudi,
I know that you have been strongly promoting this and it does look like it could be a breakout and strong backtest. I do think that another couple of days are needed to see if price can stay above the neckline though. The divergence looks bearish, but as we know, divergence is not a sure thing either.
If Silver is in a 3rd wave up, then it should stay above the neckline and start moving decisively up. If the expanded flat is in play, then it should dip back below the neckline pretty quick. Hopefully we get some strong clarity in the next couple of days.
PS sorry for the sloppy iPad markup.
Dreamer/Verne
divergence is not complete until the it crosses.
Next in any bull market surprises are in the direction of major trend.
So failure of a solid bullish chart pattern in a major uptrend has a low probability.
Wait and see. Like Lara always writes price will tell us what is next.
I have learn lot from Lara.
It certainly is true that Silver has been leading the trend and Gold following of late. I agree with Dreamer that we do need a day or two more before we can be certain of what’s going on. The expanded flat count should confirm or negate its authenticity on Monday. I am going to wait for a break of the up- trend channel before opening and bearish trades. You don’t ever want to be on the wrong side of a PM bull run! I suspect we will see confirmatory movement of the trend in after hours price action Sunday evening.
Two trades planned for next week, both anticipating C waves.
If TLT continues to trade above 119 I will reopen March 17 112/115 bullish put spreads for a límit crèdit of .40 per contract. Everyone is short bonds.
GDXJ had a second close above its BBS. A close below on Monday means I grab March 17 39.00 puts límit of 2.25. A close above 40 says I am wrong.
Speaking of annoying instances of getting stopped out, and keeping in mind that I generally use mental stops and never place them in the market (that is inviting MM ambushes), guess where TLT closed on Friday? You guessed it, exactly at 119.00! I swear it sometimesappears that these algos can read minds!! 😀
Of course the fact is one can make a fairly good guess as to where most traders are going to place their stops and programmers can easily take advantage…when price behaves the way TLT did on Friday and retraces before the close (as the MMs cover) you know it was a short term ambush trade against the trend! I knew it but was too much of a chicken to stick with my trading paln and bailed. “Sigh!”
If this main wave count turns out to be correct, it will strongly re-inforce an idea I have been trying incorporate into my trading decisions, and that is paying attention to Lara’s targets for price movement. One of the most effective tools that banksters have for disrupting the trader’s rhythm is the expanded flat, and they use it often. It is designed to absolutely decimate a trader’s stops, keep them befuddled about what the main trend is, and getting dislodged out of what would ultimately be a profitable trade. I think with a bit of practice, the expanded flat can be used to a trader’s advantage but it takes nerves of steel, and a sound EW count. I have noticed that Lara’s targets tend to be quite accurate; the timing and wave analysis may not always be exactly what unfolds, but the target is usually right on the money. I am going to try a little experiment in the way I trade suspected expanded flats by using the stated target to anchor the trade, stopping our of HALF my position on the b wave correction, then lowering my cost basis as the anticipated end of the b waves approaches. This was the same idea behind the bullish short puts added to my SLV puts once the b wave got going but the position was a bit large for an experiment so I closed out the trade. Obviously this has to be tried with a small position a number of times to see what the success rate of such an approach would be. I still think Lara’s original count is correct and that this move up is corrective. In the meantime, the banksters stop us out and walk away with more of our capital. Next week’s price action should be most informative. Comments most welcome! 🙂