
A small range inside day fits both Elliott wave counts, but the situation is no clearer.
Summary: If we expect the most common scenario to unfold, then we should be right more often than wrong. We will still be wrong sometimes, alternates are still possible, but this is an exercise in probability.
A new low below 1,225.11 would invalidate the alternate and provide some confidence that a high may be in place. It is very important though to also wait for the trend channel on the hourly charts to show a breach of the lower edge. If that happens, then enter short. The target is now at 1,137.
If price breaks above the upper edge of the trend channel, then the target for either a third or C wave up to end is about 1,273 – 1,277 in the first instance. Upwards momentum should increase and corrections should be brief and shallow.
Always use a stop for every trade. Do not invest more than 1-5% of equity on any one trade.
New updates to this analysis are in bold.
Last monthly and weekly charts are here. Last historic analysis video is here.
Grand SuperCycle analysis is here.
MAIN ELLIOTT WAVE COUNT
DAILY CHART
Click chart to enlarge.
This main wave count has a better fit for prior movement. To see the difference between this main wave count and the alternate below please refer to last historic analysis linked to above.
This main wave count expects Gold has had a primary degree trend change in December 2016. The new upwards wave is either a primary degree third wave, or a primary degree zigzag to complete a double zigzag.
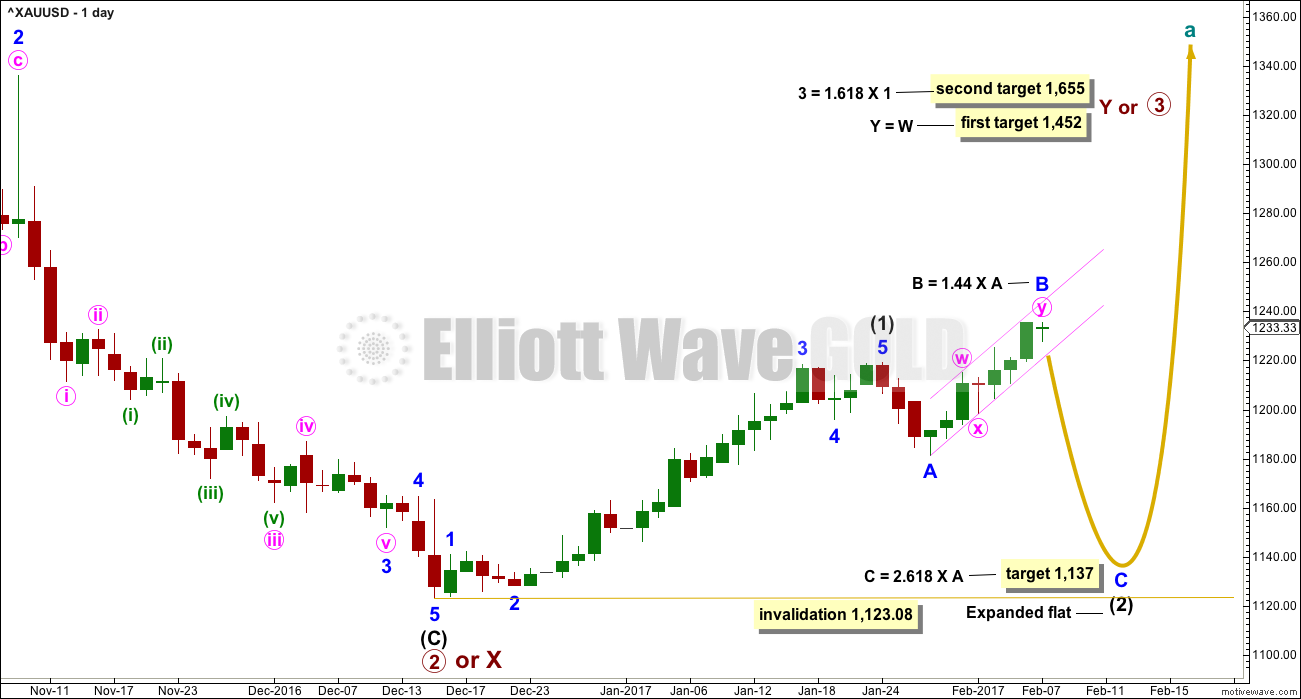
At this stage, the degree of labelling within intermediate wave (2) is moved up one degree. Minor wave A is complete and now minor wave B may be complete. If this is correct, then minor wave C down should be relatively time consuming. Intermediate wave (2) at its end should be somewhat in proportion to intermediate wave (1), which lasted 30 days. Intermediate wave (2) is expected to last a Fibonacci 21 or 34 days. So far it has lasted ten.
Intermediate wave (2) is labelled as an incomplete expanded flat correction. These are very common structures. Within them their B waves make a new price extreme beyond the start of the A wave. B waves of expanded flats should exhibit clear and strong weakness.
The first in a series of second wave corrections for Gold’s new impulses is usually very deep. Intermediate wave (2) is expected to be at least 0.618 the depth of intermediate wave (1), and may be deeper. It may not move beyond the start of intermediate wave (1) below 1,123.08.
The pink channel about minor wave B needs to be breached, at least at the hourly chart level, for any reasonable confidence that minor wave B is over and minor wave C has begun. It is entirely possible that minor wave B may continue higher while price remains within the pink channel.
It is possible that intermediate wave (2) is over as a regular flat correction (this labelling can be seen on the alternate daily chart). There, the flat is labelled intermediate wave (B) and the labelling works in exactly the same way for intermediate wave (2).
If intermediate wave (3) is underway, then a reasonable target for it would be 1.618 the length of intermediate wave (1) at 1,336.
HOURLY CHART
Click chart to enlarge.
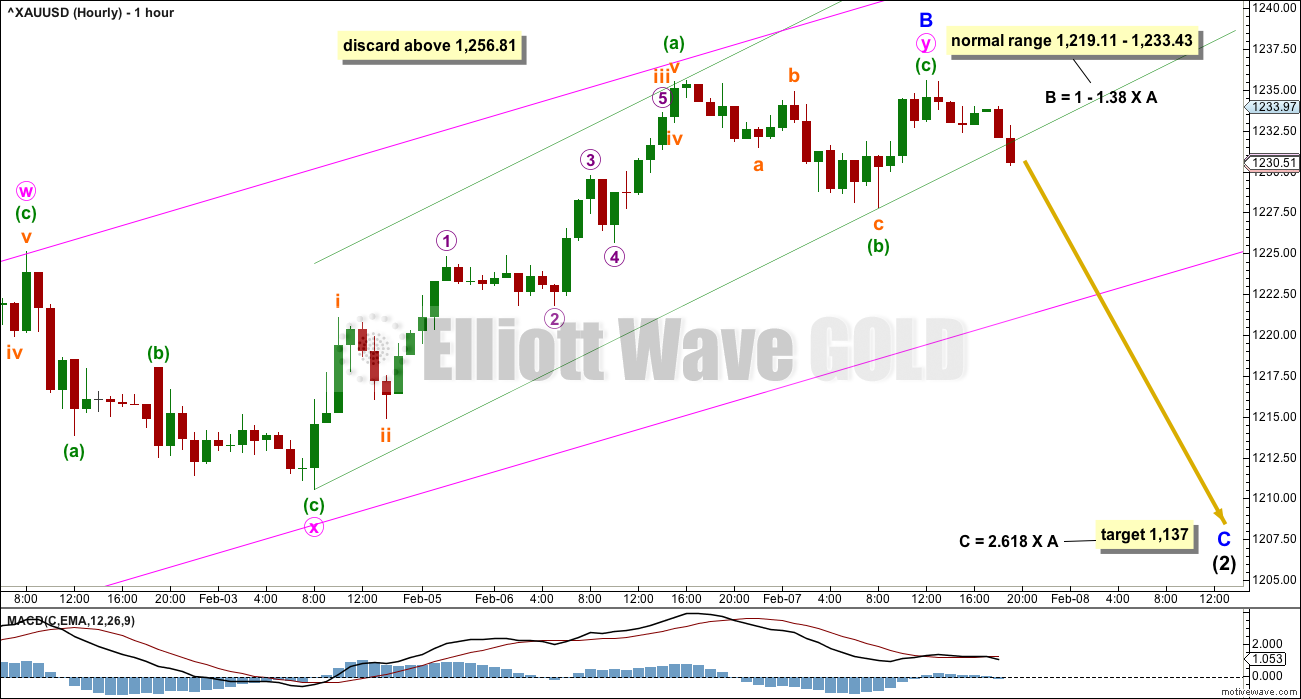
Minor wave B is now at 1.44 the length of minor wave A. There is unfortunately no rule stating a limit for B waves within flat corrections. There is a convention within Elliott wave that states the idea of a flat should be discarded when the B wave reaches twice the length of the A wave. That price point for this wave count would be at 1,256.81.
Most commonly B waves within flats are from 1 to 1.38 the length of their A waves. This is a common range, not a maximum. B waves may be longer than the common range.
When B waves are longer than the common range, then the appropriate target for wave C is 2.618 the length of wave A.
Price reacts downwards each time it touches the upper edge of the Elliott channel. Price bounces upwards each time it touches the lower edge. So far this channel is neatly showing where price is finding support and resistance. A downwards reaction may be expected either right here or very soon; price may come up for a slight new high first to more perfectly touch the upper trend line.
What happens on the next downwards reaction may indicate which wave count is correct.
A shorter term channel is drawn about the zigzag of minute wave y. This channel is almost breached. The pink channel still needs to be breached for reasonable confidence in a trend change. A breach is defined as at least one full candlestick below and not touching the lower edge of the channel.
If members are bullish and choose to ignore the possibility of an expanded flat here, then entering long, if price again touches the lower edge of the channel, would give a good entry point. Always use a stop and do not invest more than 1-5% of equity on any one trade.
ALTERNATE ELLIOTT WAVE COUNT
DAILY CHART
Click chart to enlarge.
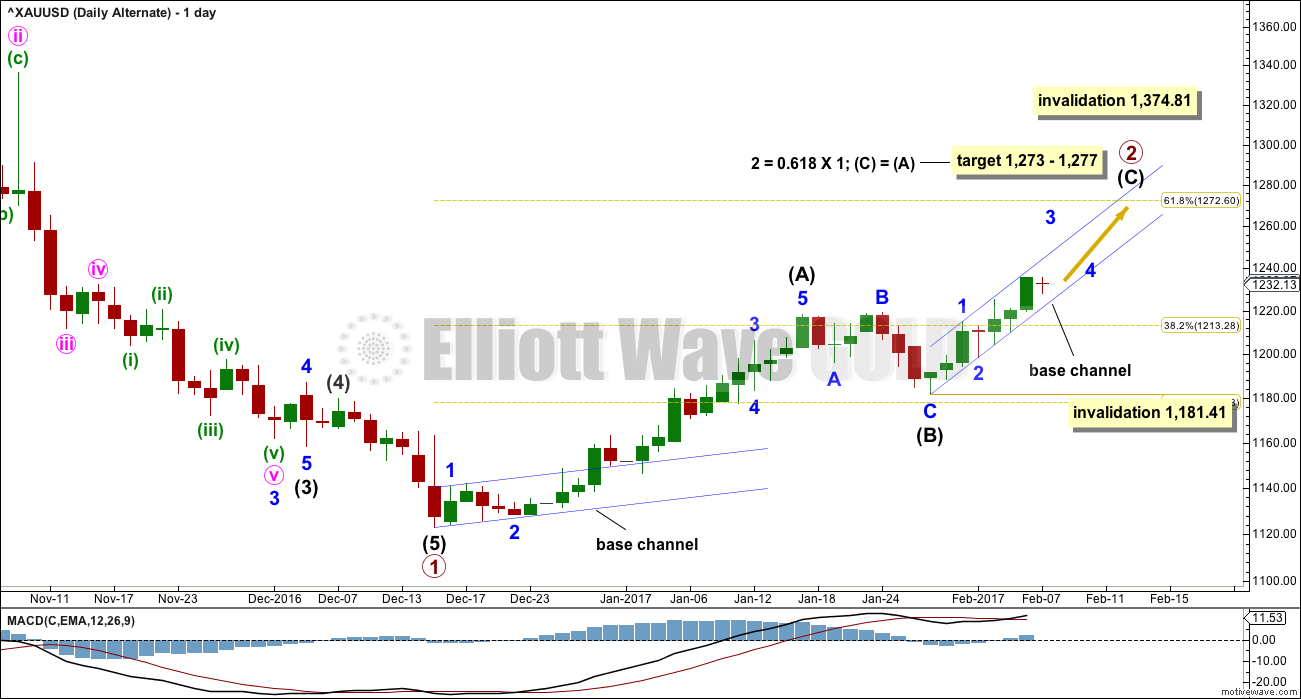
This alternate wave count expects that Gold is still within a bear market. Targets for new lows can be seen on weekly and monthly charts.
Within the bear market, a primary degree correction is underway.
Primary wave 2 is most likely to subdivide as a zigzag. Intermediate wave (A) is complete.
Today’s alternate idea (which fits for both wave counts) will be charted on this chart. If the correction for intermediate wave (B) is over (and for the main wave count this would be labelled intermediate wave (2) ), then this is what it would look like.
Intermediate wave (A) would have lasted 23 sessions. Intermediate wave (B) would have lasted only eight sessions and been a shallow 0.393 correction of intermediate wave (A). This is possible, but it would be unusually brief and shallow (particularly for a second wave).
The target expects the most common ratio for intermediate wave (C) and the most common depth for primary wave 2.
Within intermediate wave (B), no second wave may move beyond its start below 1,181.41.
A base channel is added to the start of intermediate waves (A) and (C).
Second wave corrections are usually very deep and third waves should have the power to break above the upper edge of a base channel. This is how minor wave 3 within intermediate wave (A) behaved, and this looks typical. So far, if another impulse upwards is underway, minor wave 3 has not yet had the power to break above the new base channel. This is not typical. This is unusual. If, for the main wave count, this idea sees a third wave within a third wave up beginning, the lack of power with price remaining within the base channel is concerning.
If price does break above the base channel, then expect corrections thereafter to be very brief and shallow, and upwards momentum to increase strongly. At that stage, long positions may be entered with a stop just back inside the base channel.
Primary wave 2 may not move beyond the start of primary wave 1 above 1,374.81.
HOURLY CHART
Click chart to enlarge.
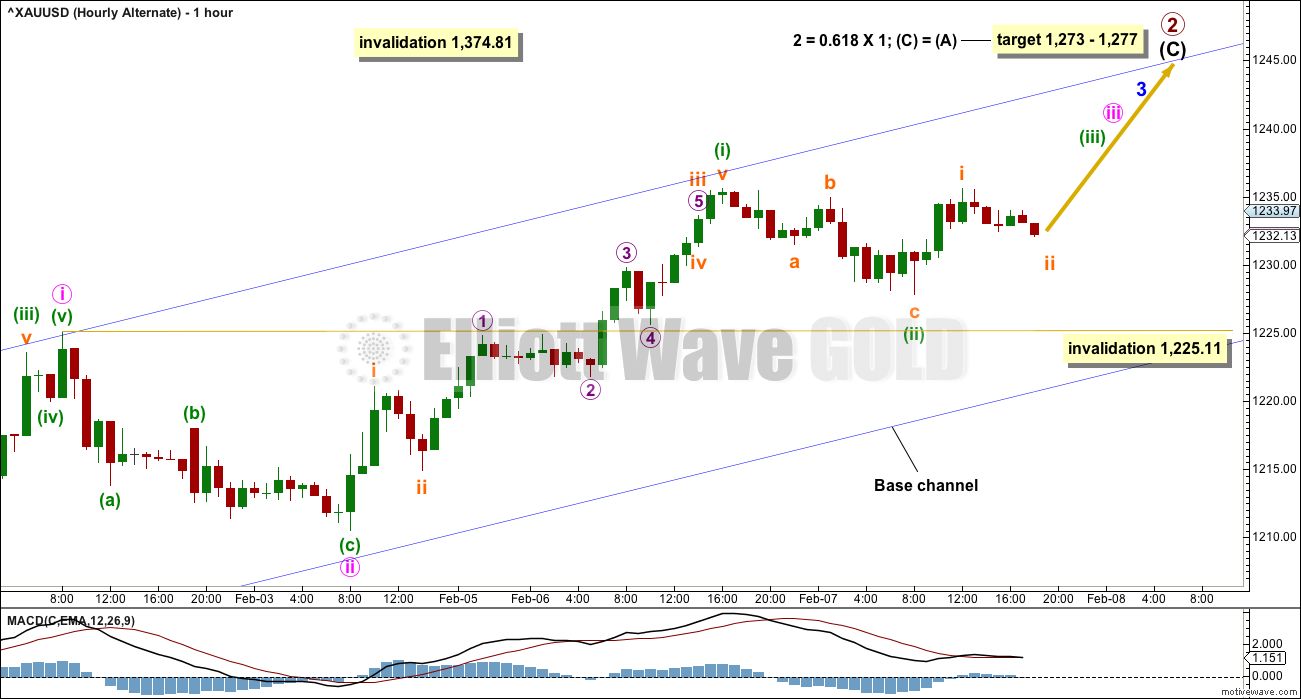
If Gold is within an impulse up (and this would be labelled intermediate wave (3) for the main wave count), then the third wave labelled minor wave 3 is unlikely to be over.
It would have begun with two overlapping first and second waves. Minute wave iii would be incomplete. When it is done, then minute wave iv may not move into minute wave i price territory below 1,225.11.
The base channel is the same as the channel on the main hourly chart. For this wave count, the power of minor wave 3 should break above the upper edge of the base channel and afterwards that trend line should offer support.
If price does break above the upper edge of this channel, that would substantially increase the probability of this wave count.
TECHNICAL ANALYSIS
WEEKLY CHART
Click chart to enlarge. Chart courtesy of StockCharts.com.
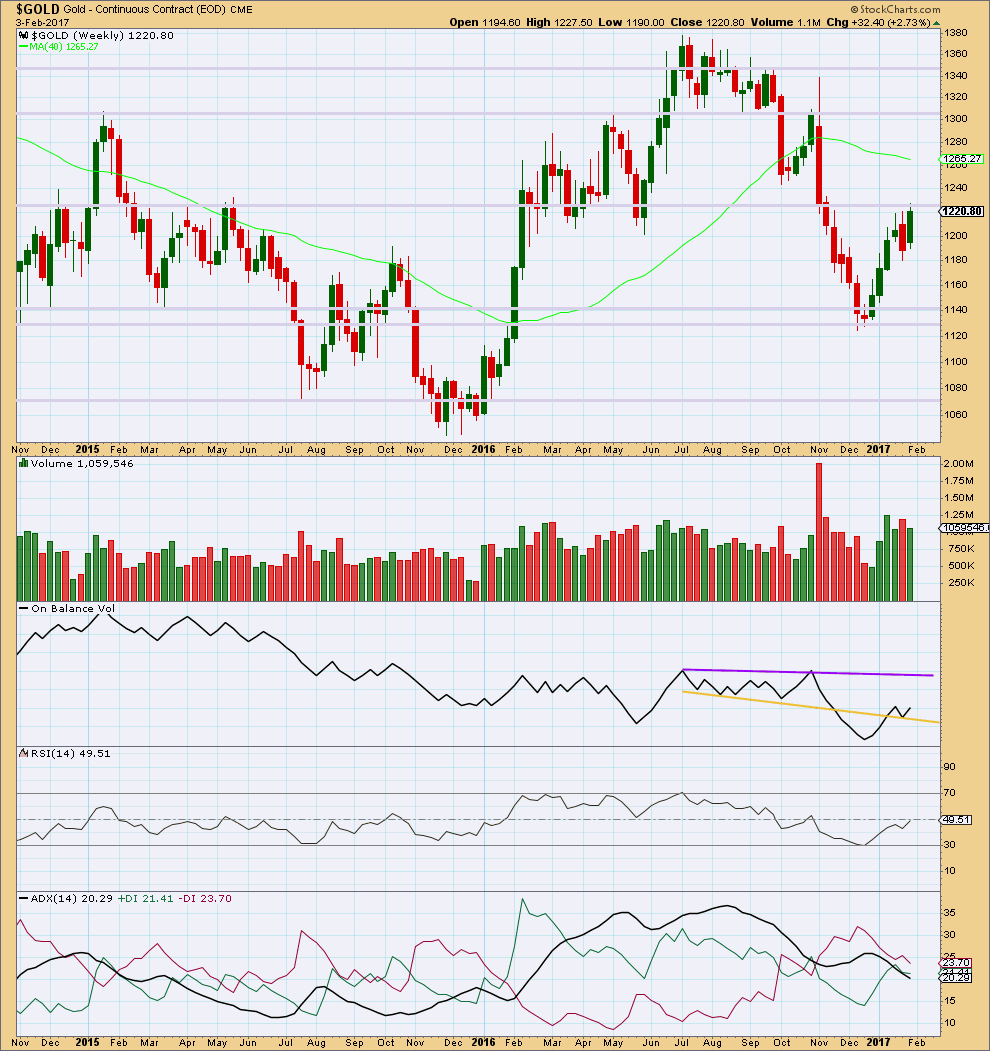
The bearish engulfing candlestick pattern of last week has failed. Price has made a new high.
Since four weeks ago, volume is overall declining. Price is still finding strong resistance about 1,225.
On Balance Volume has bounced up off the yellow support line. Next resistance is some distance away at the purple line. Another breach of the yellow line would be a weak bearish signal.
RSI is not extreme and exhibits no divergence with price. There is plenty of room for this market to continue higher, or lower.
ADX is strongly declining, indicating a consolidation. The -DX line remains above the +DX line, so at this stage a downwards trend would be indicated if ADX turns upwards.
DAILY CHART
Click chart to enlarge. Chart courtesy of StockCharts.com.
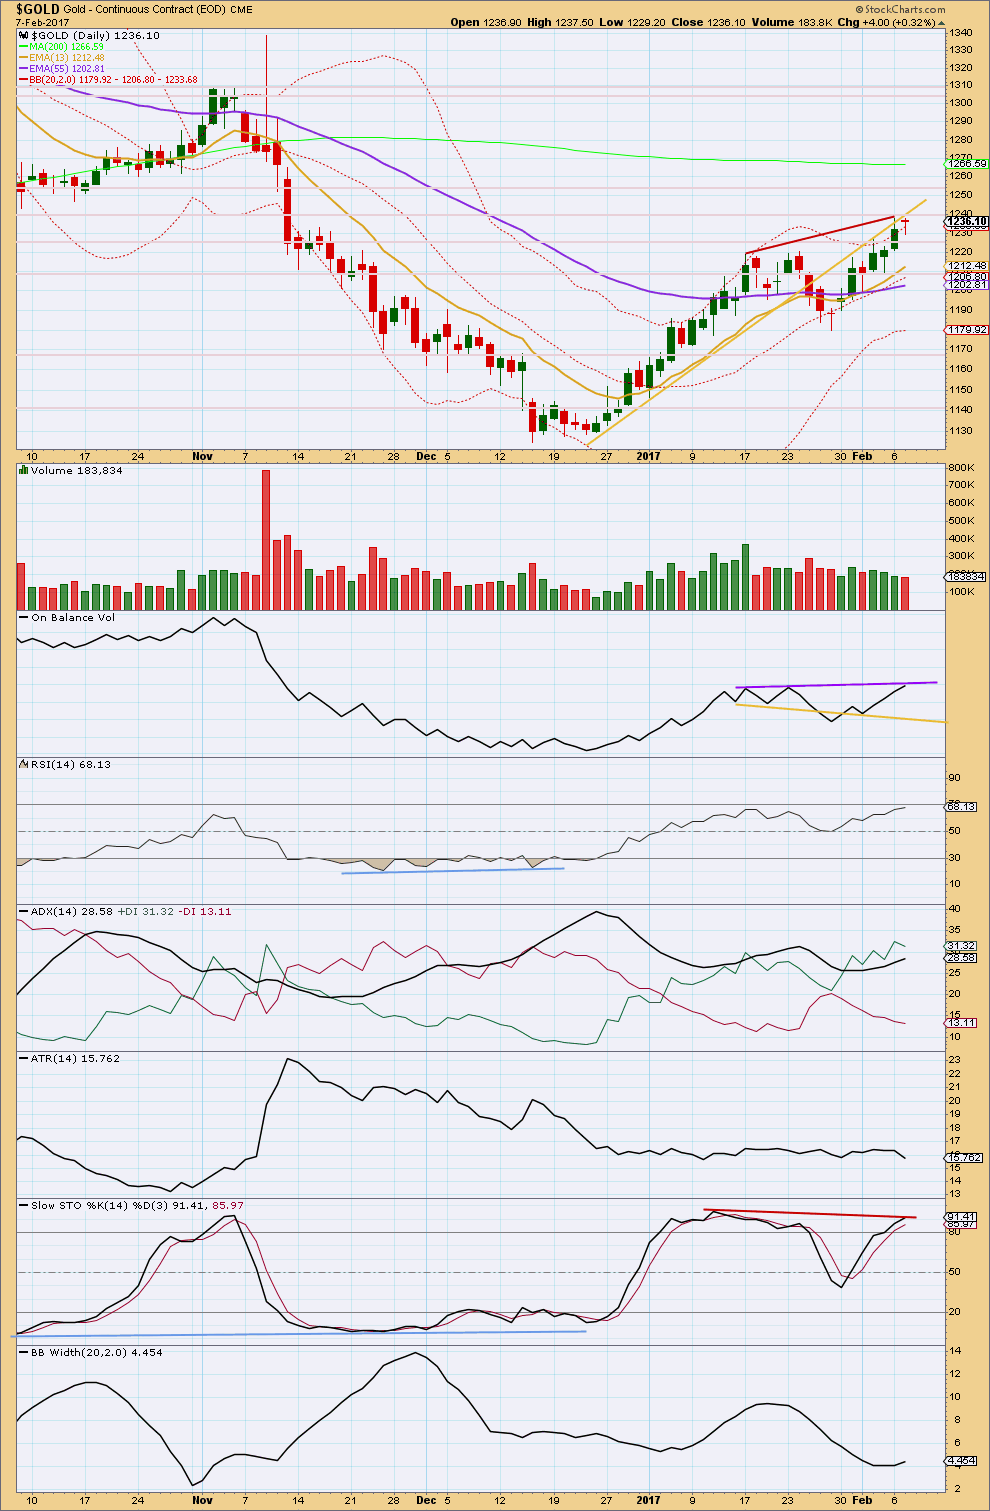
Price is now finding strong resistance about 1,240. For Stockcharts data, the high for this session at 1,237.50 is exactly the same as the high for the prior session forming a double top. Price continues to find resistance about the yellow trend line.
Today completed an inside day and the balance of volume for the session was upwards. Volume is lighter than the prior day; upwards movement during the session did not have support from volume. This is now the case three days in a row. This supports the main Elliott wave count.
On Balance Volume has now come up to touch resistance. This line is only tested twice before, so it does not have strong technical significance but may offer some resistance. If OBV reacts lower tomorrow, the significance of the line would be increased and a bearish signal would be offered. Resistance by OBV supports the main Elliott wave count.
RSI is not yet overbought. There is room for upwards movement to continue. There is no longer divergence between price and RSI at highs to indicate any weakness. This supports the alternate Elliott wave count.
ADX still indicates an upwards trend in place, which is not yet extreme. There is room for this trend to continue. This supports the alternate Elliott wave count.
There is still divergence between price and Stochastics, and Stochastics is overbought. This supports the main Elliott wave count.
Bollinger Bands may be beginning to widen, but they are still fairly tightly contracted. This also supports the main Elliott wave count.
Price has closed above the upper edge of Bollinger Bands for the last two sessions. A reversion to the mean expectation would support the main Elliott wave count.
Overall, there is more support from this classic analysis for the main Elliott wave count than the alternate.
This analysis is published @ 08:00 p.m. EST.
Like this?
Just be aware dear John, the banksters are also probably watching that trendine carefully…! 🙂
Alternate hourly chart updated:
If the channel is breached (it’s drawn in the same way on both counts) then exit any longs and open shorts. Be prepared to switch quickly from bull to bear.
Always always use a stop. Do not invest more than 1-5% of equity on any one trade. I know I keep repeating this over and over, that’s because we have new members all the time and this is so important. Manage risk carefully please.
As noted on the hourly chart for the main count, there is some weakness in this potential third wave. It hasn’t managed to break above the base channel and there’s bearish divergence.
Now, that could be resolved. It doesn’t mean that count is wrong. But what it does mean is we must consider the expanded flat still, albeit now as an alternate.
Alternate daily chart updated:
I agree the absence of a channel breach does strongly suggest a smaller degree third within a B wave. The C wave down to conclude intermediate two should give good time proportion with intermediate one, AND possibly co-incide with your new possible ED final wave in SPX. That would be putting a beauty of a ribbon on the entire affair would it not? Shiver me timbers matey! 🙂
Now wouldn’t that be a fabulous gift to us from Mr Market?
Hourly chart updated. I’m going to try and put more info on the charts, less text outside.
If I swap the counts over then the main count sees Gold in a third wave up. The target assumes the most common (!) Fibonacci ratio to the first wave.
Daily chart updated:
Ai Yi! Yi! If that is right this party is JUST getting started and we will most certainly see that upper channel busted like Nate Diaz did to Connor in the first fight… 🙂
Well, as I’ve noted in a response to Alan below I may consider swapping over the wave counts today.
The correct way to approach Elliott wave is to expect more common patterns to unfold than uncommon patterns and behaviours.
It is most common for second wave corrections to be deep. Expanded flats are very common structures. Second waves more often are about even in duration, and reasonably commonly longer in duration than the first waves they correct.
All that said that an expectation of intermediate (2) to continue as an expanded flat was the most likely scenario, it followed most common patterns.
The most unfortunate thing about this approach is that when uncommon situations occur (and they will) they will never be what you expected to see. They will always be an alternate 🙁
It is looking increasingly likely that is what has happened this last week or so for Gold.
If intermediate (2) is continuing as an expanded flat then minor B today is a 1.67 length to minor A, this is now getting reasonably longer than the maximum common length (dammit! that word common again!) of 1.38.
The higher the potential B wave goes, the lower the probability this move is a B wave and the higher the probability that it is a third or C wave up.
And so this is how I think we should approach this market at this time:
Look for an entry to go long, use the channel. Currently price is sitting in the upper half so add a mid line. Watch how price behaves when it comes down to the mid line, if it moves below then it may go back down to the lower edge. If it does enter long. If it bounces up off the mid line then enter long. Stops just below the lower edge, or use EW invalidation points.
If this is a third or C wave it still has a fair way to go. We may have missed the beginning, but we’ll still get a fair chunk of the trend.
This is the risk that members absolutely must accept if taking this advice:
The idea of an expanded flat with a big strong C wave down is still entirely valid, and still has a reasonable probability. So accept the possibility of a loss. Ask yourself, how big a loss can I handle on this trade? Do not invest more than 1-5% of equity on it. Less experienced members should reduce that to 1-3%. I’m only going to risk about 3% (maybe a little less). Set your stop allowing the market room to move, then adjust your position size to meet the 1-5% rule.
Anyone trading without a stop is very foolish. Don’t do that. It exposes the entire equity in your account to risk, that’s how traders wipe out.
If it turns out the expanded flat is actually unfolding then exit long positions when the channel is breached and open a short. Be prepared to switch quickly from bull to bear.
That is the best advice I can give right now. If any experienced members have any other ideas on how to approach Gold right now then have at it.
Now of course swapping the counts over today risks the possibility that I shouldn’t do that…
The expanded flat is still entirely possible. I’m risking swapping them over right as a C wave down could explode on us 🙁
It’s a risk I have to take.
Often when a trade “feels” bad it’s the right one. Traders are all too familiar with how those cocky, confident trades turn out. And you are so right about being nimble. You absolutely have to be able to pivot on a dime in some instances. Selling GDXJ puts “felt” odd but I think was a right move based on what price has been doing and continues to do…so far! Now watch the banksters unleash the mother of all reversals overnight and send me scrambling to buy back those puts! 🙂
I picked an interesting time to start my new passion. Dollar drops, gold goes up…dollar strengthens, gold goes up…markets drop, gold goes up…markets strengthen, gold goes up….is this my new life?! Got burnt going short last week, but stopped out, thank goodness. Having said the above, I’m having fun learning and getting key info, and I’m convinced one day I’ll see us all agree on a trend (but maybe not, let’s see). Keep up all the comments, good luck, and let’s make money.
Euro drops, gold goes up…Euro gains, gold goes up…help…haha
Good on you Joseph and good luck with your trades! Doesn’t look like to me that Gold price will presently get much below 1239 at this stage with 1233-35+ holding for a drive through 1244-45; upper band and daily RSI at 70+ is a concern though but given the bullish undertones, wont consider Gold price overbought until RSI starts to cross above 80… Oh well, just got to try and stay with the drift lol….
Agree, Syed. RSI still showing bullish in my perspective as well.
We can use this trend channel to find an entry point. It’s currently trading in the upper half of the channel so add the mid line. It’s just coming down to touch that now.
Yeah Joseph I think Gold price just left its signature for 1236-35 to hold and looks like it will be off back up on its merry way to test a break above 1244; stop at 1232-31 should work lol…. GL & have a nice day. Bye.
Paradigm shift perhaps?
Yep.
I think this is a wave 1 up but not sure what degree?
There are few analysts that are looking at the possibility of just intermediate one up completing as well Nick. It would be quite a long first wave and portend a deeper correction, but boy that third wave up would be a heck of a doozy!!
Gold and silver have built a huge base since Nov 8 2015 top after falling. Recently it broke out of NL at 1220. Now it has formed mid way upward consolidation triangle. If it breaks above gold could test the high of Nov 8 2016.
Oh by the way all this is visible in 4 hour period from N0v 6 to YTD chart.
Yes I am reading Lara’ excellent EW for GDX. Thanks Lara for your hard work.
You’re very welcome Papudi.
FullGoldCrown’s idea for HUI matches the pullback that I see for GDX.
This going to be beacoup interesting. Every trader with a pulse is going to be swarming all over any pullback in the miners…like white on rice! Another shallow pullback?!
Hi friends. Good to be back again after a long holiday, refreshed.
I just did some quick analysis and these are my conclusions.
For the main count, Minor B has not ended. Instead, the point 1235.58, which has been labelled as Minor B, is only subminuette 1 of minuette c of Minute Y. My target for this “crazy” rise in price is
(a) 1242.41, where Minor B = 1.618 Minor A.
(b) 1244.78, where Minute Y = 1.382 Minute W
(c) Worst case, 1250.74 where minuette c = 0.618 minuette a.
For the alternate count, Lara’s target is spot on. I had considered a target of 1270+ once, those of you who have long term memory may recall.
Let’s see how it plays out.
I may swap them over today Alan 🙁
I expected the most likely scenario, that intermediate (2) for the main count would be a very common expanded flat, would be deep (at least the 0.618 Fibonacci ratio) and would be longer in duration so it had better proportion to intermediate (1).
But today it is looking that it may have been over earlier. A regular flat lasting just 8 days to intermediate (1)’s 23 days, and shallow at only 0.388 of intermediate wave (1). That is less common, so that was not the scenario that I expected.
I’ll be looking for an entry to go long. The risk is that it could still be an expanded flat and we could still see C move strongly lower.
If intermediate (2) is continuing today then minor B is now 1.67 X minor A, that’s now getting reasonably longer than the 1.38 common range 🙁
I for sure appreciate the GDX count, and I very much appreciate your perspective as well Dreamer.
Thanks James. Good to hear that you appreciate my GDX charts!
Dreamer, count me in too. Your tireless and meticulous work is greatly appreciated.
Thanks Alan. Good to have you back!
Lara/All,
Here’s my update on Lara’s Silver count. An expanded flat for Minute 2 would allow for a correction without going too far below the neckline. This aligns with my GDX count and would offer an excellent buying opportunity.
What do you think?
I think it looks good Dreamer. That’s what I come up with too.
All Members,
Did you notice that Lara has not published the GDX technical analysis the last 2 days?
She asked in comments yesterday if anyone missed it… no replies except for mine.
Please speak up and tell Lara that you value her GDX analysis!
She does this as a bonus for us and we need to thank her for it and tell her how useful it is for us if you want her to continue adding the GDX technical analysis daily.
Please let her know. Many thanks!
I’ll be the first one here:
Lara, please continue with your daily GDX technical analysis and monthly GDX EW updates. I know there’s many members that trade the miners. Thank you. Your work is appreciated!!!
I saw that and thought it was some kind of inside joke so although I wanted to speak up and say “I did!” I did not want to appear silly- particularly as there had been no responses at the time I say her query. I certainly am VERY interested in that analysis! (As if ya’ll could not tell by my voluminous, “not nearly as useful as Lara’s”, commentary regarding same…) 🙂
Yes, I’m interested too Lara. Please continue GDX analysis.
Thanks
Thomas
No worries guys. I was just testing to see if anyone was actually reading and following it.
It’ll be back tomorrow.
😀😃😄😍🤑 Thanks Lara!!!
A new possibility for the expanding diagonal for GDX. Could it be a LEADING expanding diagonal instead of an ending one?
Dreamer my friend, that wave count is a Bollinger Band Busting Behemoth…I like it!! 😀
Well said Verne!
Verne & Thomas, while I don’t usually keep up with all your live comments and market musings during the trading day, I do enjoy reading them. Keep up the added value!
Hello Dreamer,
Thank you for your explicit charts as they are so valuable.
Lara’s analysis is priceless.
My day is not fulfilled if I cannot see your GDX chart.
Are you ok?
It has been an extreme rain season in California.
Thanks Pete. Glad you find value in my GDX charts.
Yes, it’s been very wet in CA, but we really needed the rain, so all is good!
I like the diagonal. It meets all EW rules and fits neatly with it’s trend lines.
While it could be either ending or leading, ending has a higher probability.
A look at GDXJ
A look at the USD
Dreamer,
Enjoy all the charts and notes…thanks so much.