
Another upwards day sees the main and alternate Elliott wave counts switched over.
What is now the alternate Elliott wave count still remains viable. It illustrates the risk today to trading based upon the main Elliott wave count.
Summary: Probability has shifted today to an upwards trend continuing. The target is at 1,336. If price breaks above the base channel, this probability would substantially increase. If that happens, then corrections may become increasingly brief and shallow and look out for a blowoff top.
Alternatively, a new low below 1,227.82 would shift probability back to a downwards trend and a downwards wave to the target at 1,149. If price breaks below the channel, then exit long positions and consider opening a short position.
Follow my two Golden Rules of risk management:
1. Always use a stop.
2. Invest no more than 1-5% of equity on any one trade.
New updates to this analysis are in bold.
Last monthly and weekly charts are here. Last historic analysis video is here.
Grand SuperCycle analysis is here.
MAIN ELLIOTT WAVE COUNT
DAILY CHART
Click chart to enlarge.
This main wave count has a better fit for prior movement. To see the difference between this main wave count and the alternate below please refer to last historic analysis linked to above.
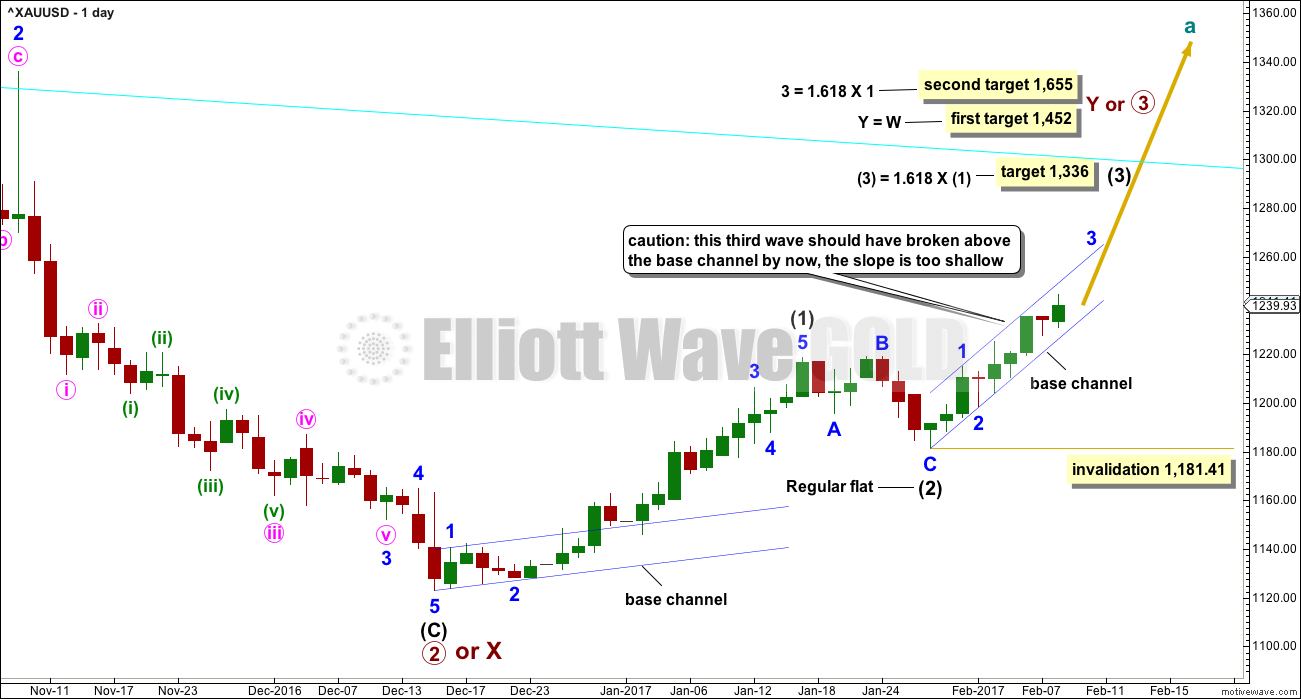
This main wave count expects Gold has had a primary degree trend change in December 2016. The new upwards wave is either a primary degree third wave, or a primary degree zigzag to complete a double zigzag.
At this stage, the degree of labelling within intermediate wave (2) is moved up one degree. With continuing upwards movement now reducing the probability that intermediate wave (2) is continuing, this wave count now sees intermediate wave (2) complete as a regular flat correction lasting 8 days (intermediate wave (1) lasted 23 days) and shallow at only 0.388 the depth of intermediate wave (1). This is slightly unusual but entirely possible. It is my judgement today that this wave count is about 55% likely.
If intermediate wave (3) is underway, then a reasonable target for it would be 1.618 the length of intermediate wave (1) at 1,336.
Base channels are drawn about both the starts of intermediate waves (1) and (3). Within intermediate wave (1), minor wave 3 was able to break above the upper edge of the base channel that then provided support. This is typically how price behaves around base channels. However, so far within intermediate wave (3), minor wave 3 has not been able to break above the base channel and this is atypical.
The alternate idea published below, which sees an expanded flat still unfolding, works in exactly the same way for this main wave count with the only difference that it would be labelled intermediate wave (2) rather than intermediate wave (B).
HOURLY CHART
Click chart to enlarge.
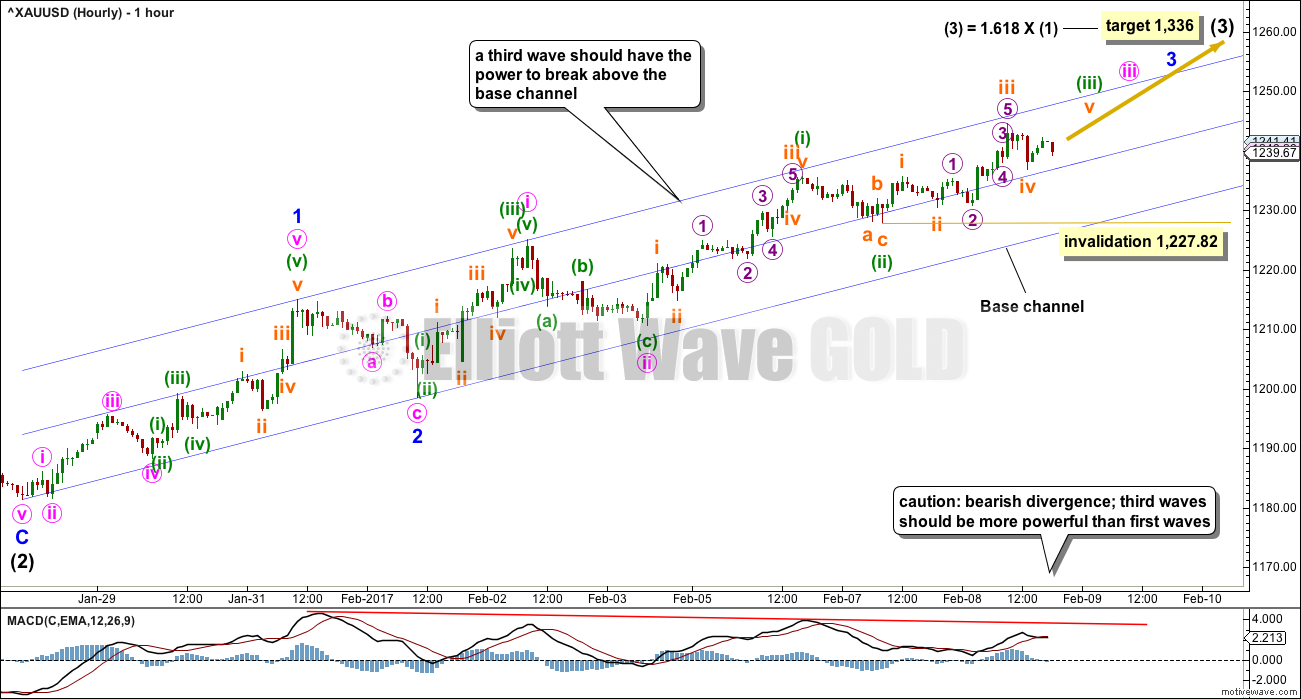
Price continues to fit within the base channel. If this wave count is correct, then price should be able to break above the upper edge. If that happens, then the alternate wave count will be discarded and the probability of this main wave count would substantially increase.
If price breaks above the upper edge of the base channel, then that upper trend line should then offer support. If price turns down to test support, it would offer a very good opportunity to join an upwards trend with confidence.
Along the way up towards the target for intermediate wave (3), if this wave count is correct, corrections should now begin to be more brief and shallow. Gold often ends its third waves with very strong fifth waves and a blow off top is expected at the end of minor wave 3 and possibly also intermediate wave (3).
Within minuette wave (iii), no second wave correction may move beyond the start of its first wave below 1,227.82.
ALTERNATE ELLIOTT WAVE COUNT
DAILY CHART
Click chart to enlarge.
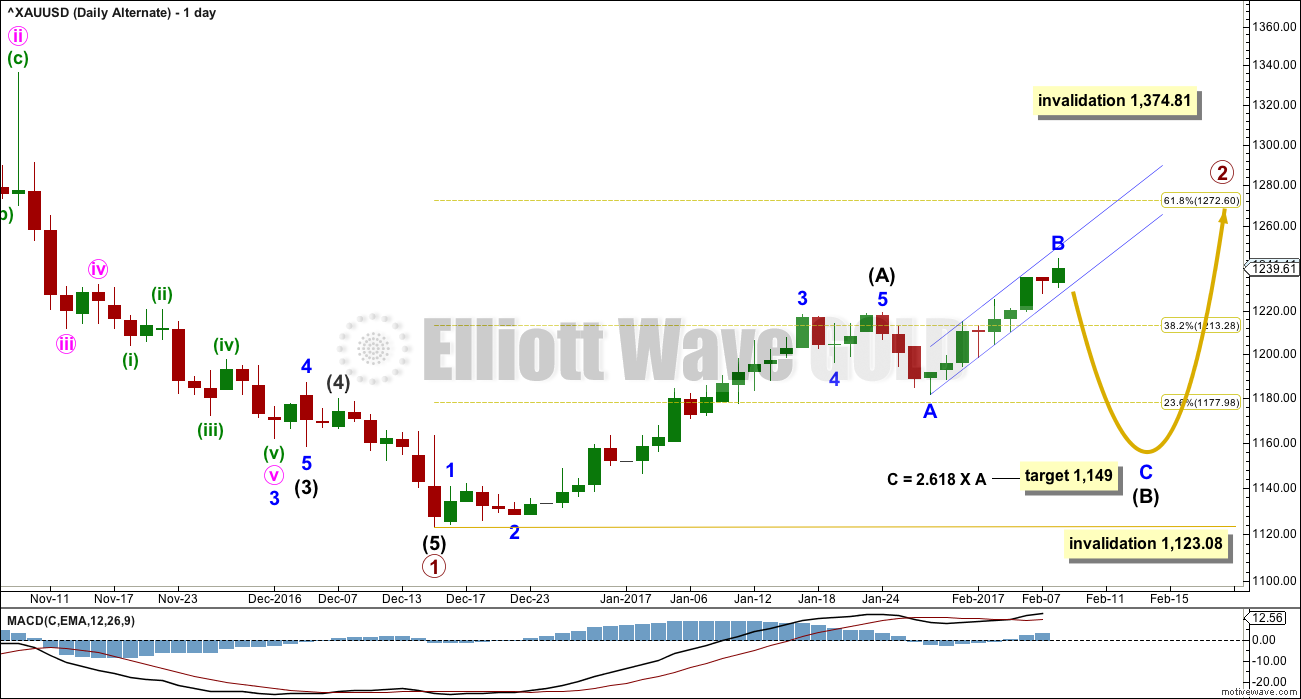
This alternate wave count expects that Gold is still within a bear market. Targets for new lows can be seen on weekly and monthly charts.
Within the bear market, a primary degree correction is underway.
Primary wave 2 is most likely to subdivide as a zigzag. Intermediate wave (A) is complete.
The alternate idea today is that the correction here labelled intermediate wave (B) (which for the main wave count would be labelled intermediate wave (2) ) is an incomplete expanded flat correction.
At its end, if intermediate wave (B) continues, it would have better proportion to intermediate wave (A). It would be a deeper correction.
Expanded flats are very common structures. The normal range for their B waves is from 1 to 1.38 the length of their A waves. In this instance, minor wave B is now 1.73 the length of minor wave A. This is longer than normal but within acceptable range of up to two times the length of minor wave A.
Minor wave B still exhibits some weakness. It remains tightly contained within a channel and still exhibits some divergence with Stochastics. Volume is still relatively light. Because this wave count still has some support from classic technical analysis today it is my judgement that it is about 45% likely. This wave count illustrates the risk to entering a long position based upon the main wave count, and why it is absolutely essential that members use stops and manage position size to no more than 1-5% of equity.
Intermediate wave (B) may not move beyond the start of intermediate wave (A) below 1,123.08.
Primary wave 2 may not move beyond the start of primary wave 1 above 1,374.81.
HOURLY CHART
Click chart to enlarge.
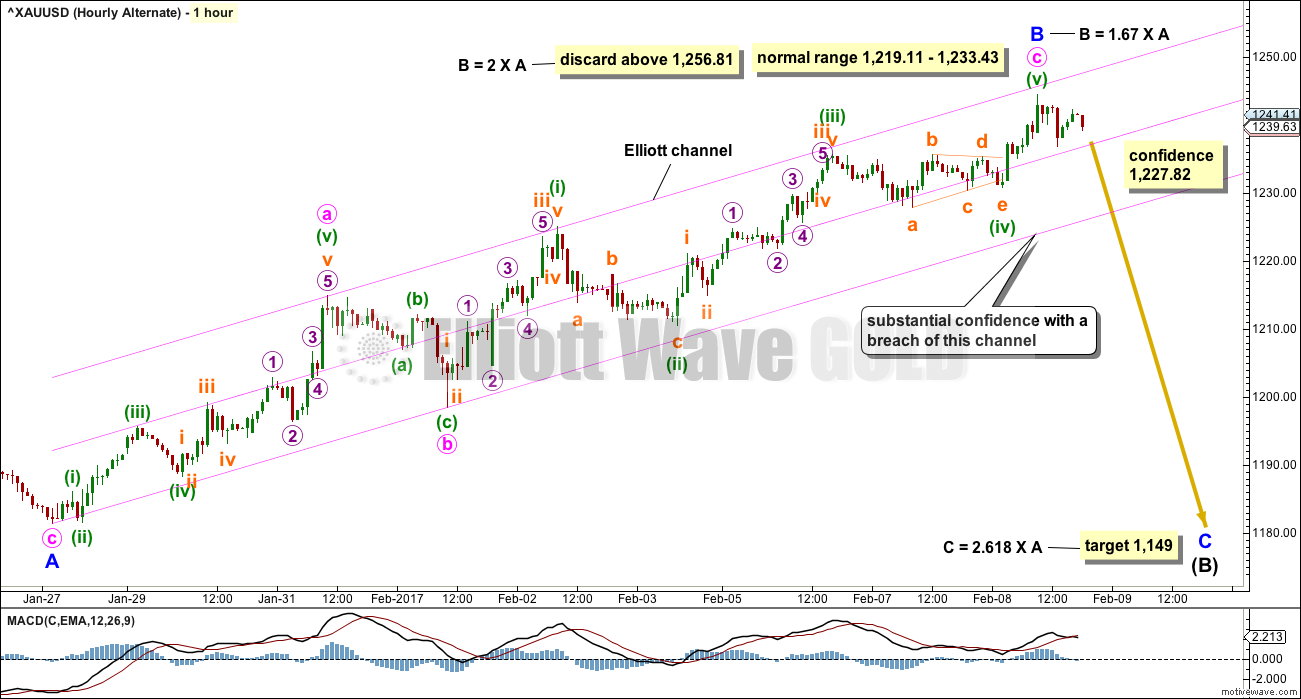
A zigzag may now be complete for minor wave B. There is no Fibonacci ratio between minute waves a and c.
This wave count would substantially increase in probability if price breaks below the lower edge of the Elliott channel. This channel is drawn in exactly the same way on both hourly charts.
If price breaks below the channel, then long positions should be exited. A short position may be entered there, or on a throwback to resistance at the lower edge of the channel.
If minor wave B continues, then when it reaches twice the length of minor wave A at 1,256.81 this idea will be discarded based upon an exceptionally low probability.
If price breaks above the upper edge of the channel, then this idea would be discarded based upon price behaviour.
TECHNICAL ANALYSIS
WEEKLY CHART
Click chart to enlarge. Chart courtesy of StockCharts.com.
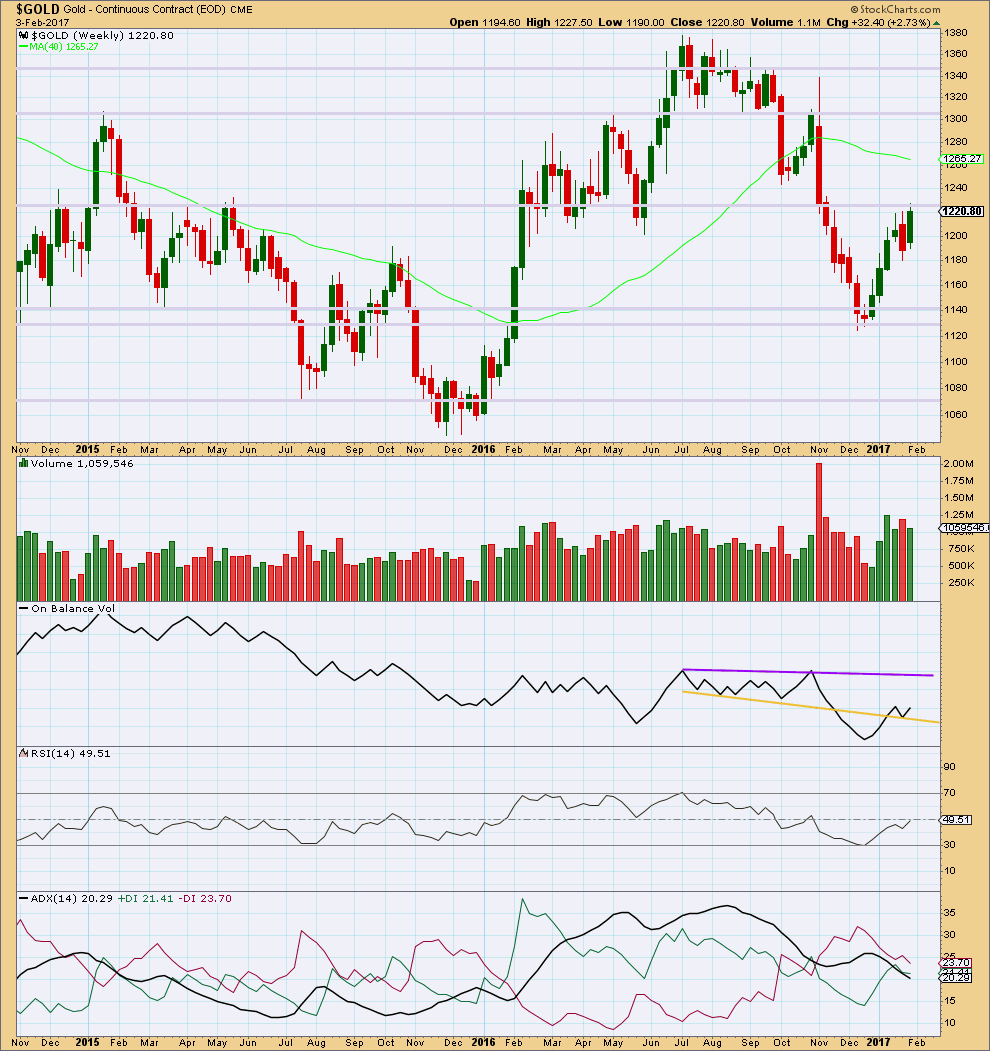
The bearish engulfing candlestick pattern of last week has failed. Price has made a new high.
Since four weeks ago, volume is overall declining. Price is still finding strong resistance about 1,225.
On Balance Volume has bounced up off the yellow support line. Next resistance is some distance away at the purple line. Another breach of the yellow line would be a weak bearish signal.
RSI is not extreme and exhibits no divergence with price. There is plenty of room for this market to continue higher, or lower.
ADX is strongly declining, indicating a consolidation. The -DX line remains above the +DX line, so at this stage a downwards trend would be indicated if ADX turns upwards.
DAILY CHART
Click chart to enlarge. Chart courtesy of StockCharts.com.
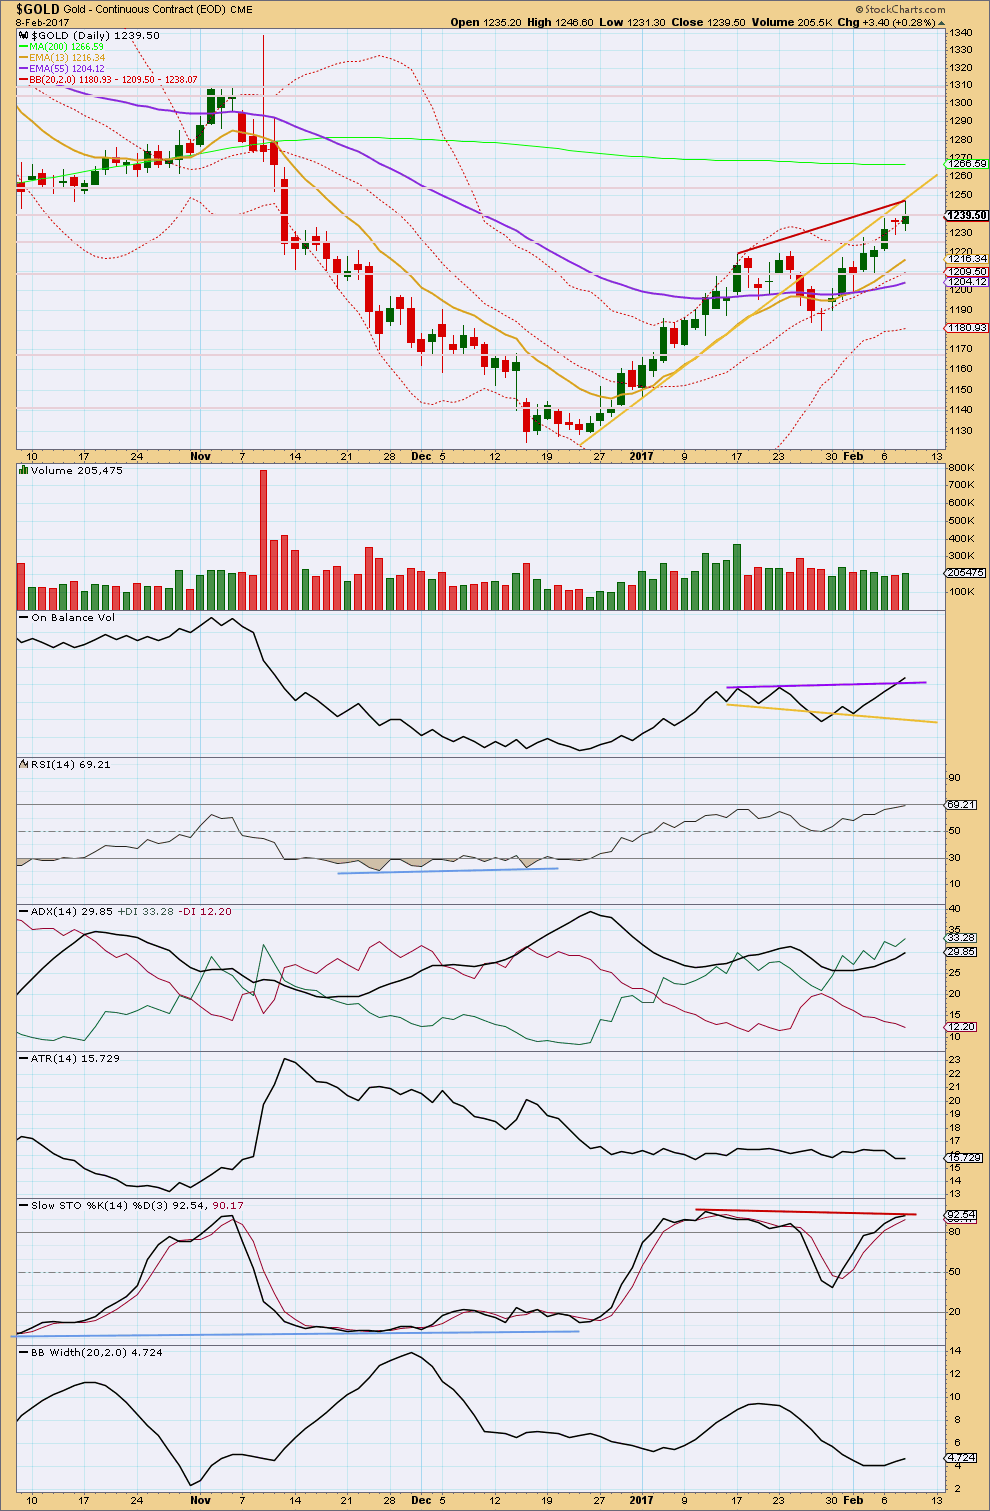
Price overshot resistance at 1,240 but could not close above this point. Volume is still light relative to the last wave up, but it does show a small increase today. This is slightly bullish.
On Balance Volume gives a weak bullish signal today with a break above the purple resistance line. This is a weak signal because although the line has an almost horizontal slope it is not very long held and only tested twice before.
RSI is not yet overbought and exhibits no divergence with price to indicate weakness.
ADX still indicates an upwards trend in place, which is not yet extreme. There is room for the trend to continue.
ATR is still overall flat, but this is not normal for a third wave. This supports the alternate Elliott wave count, but third waves can sometimes start off slowly. So this is not definitive.
Stochastics still exhibits divergence with price at the last high, but it is slight. Divergence is only single. This is a very weak bearish signal. This divergence between price and Stochastics can persist for extended periods of time during Gold’s trends and normally develops into multiple divergence before price turns. Sometimes it just disappears as it did today for GDX.
Bollinger Bands may be just beginning to widen, so volatility may be returning to this market. This would be normal for a third or C wave, so this supports the main Elliott wave count slightly.
Price is still close to upper edge of Bollinger Bands. This can persist for several days when Gold trends strongly. This does not mean price must pull back here. However, it is a warning that price may very well pullback here or very soon. If a pullback does unfold (and as long as price remains within the channel on the Elliott wave charts) then it should be used as an opportunity to join the trend.
Price still is finding resistance at the gold trend line, which previously provided support. Next horizontal resistance is about 1,255.
Overall, there is now more bullish indication in this chart than bearishness.
GDX
DAILY CHART

Click chart to enlarge. Chart courtesy of StockCharts.com.
Most commentary is on the chart.
GDX today shows strong notes of caution regarding this upwards trend, and this caution also applies to Gold.
A bullish change today is the disappearance of divergence between price and Stochastics at today’s new high.
Note declining volume on rising price for the last two sessions. This is bearish.
This analysis is published @ 08:20 p.m. EST.
Sneaky little (massive) channel breach 5min before close there. Naughty banker!
I saw that! 🙂
Reloading TLT 120 calls on pullback today. Holding 112/115 bullish put spread spread.
Adding JNUG Feb 17 11.50 puts to balance GDXJ 41/45 bullish put spread.
Will exit GDXJ 45 short puts of spread if Gold price closes below 1230.00
Hi Lara,
Thank you for all of your input [and for GDX charts!].
Based on price action today and the 2 charts you just published, can you take a ‘stab’ at this point as to which outcome is more likely?
OR, is it best to wait for a cross of Lower channel or a cross back Up of Mid channel for Any confidence?
Thank you….
P.S. Members may want to listen to Tim Wood @
http://www.howestreet.com/2017/02/02/gold-drop-before-a-surge/
The alternate is confirmed. The channel is breached.
If this is a third wave up not only does it now have a lot of weakness, it’s breached a channel on the wrong side.
Methinks ze long awaited correction is here…how deep? (is your love)
https://www.youtube.com/watch?v=XpqqjU7u5Yc
I know… I know…a bit tacky but catchy, you must admit…memories… 🙂
If this wave count is correct then Gold should be ready to move up very strongly. A third wave now at five degrees should be about to move upwards.
If my labelling for the downwards movement for today here is correct then minuette (iv) may not move into minuette wave (i) price territory above 1,236.74.
If price moves above 1,236.74 then it may be another second wave correction. That may not move beyond its start above 1,243.68.
If price moves above 1,243.68 then expect new highs, the main count would be correct.
If price moves lower and breaks below the channel look for an entry to go short. It may turn up and retest resistance, if it does that’s a perfect opportunity. But it may just keep going lower.
Lara, The channel clearly broke at 4:54 Pm, its heading much lower. Can you confirm, thx.
Yes, and the confidence point is breached. Looking for an entry to go short now.
Lara,
Thanks, could it be that Minute wave [i] was over near the lows at 4:54 PM about a $19+ points drop(April futures had a $20.50 drop)? If so we may see a retrace up of $11-$12 for a nice short? Is that how you see it/ Thx.
Lara,
One more question, what if the peak of Minor B you have is the peak of Intermediate (A) from the lows of 1124? And we are starting a fresh Intermediate wave (B) down for another Minor A , B and C down as a normal deep Zig Zag for an Intermediate (B) or (2)? Thanks
This gives us 11 days for Minor 1 and 9 days for Minor 5 good proportions for a Minor 3 of an Intermediate(A)or(1) up.
Dammit. Right when I swap the wave counts over, Gold goes down.
It’s bouncing up off the lower edge of the trend channel now. If what is now the alternate is correct then I would have preferred to see it slice right through. It may do that on the second attempt though, it didn’t have to be the first.
Looking at the candlesticks on the hourly and 15 minute charts, it is looking bearish. The current small upwards bounce off the trend line looks corrective; mix of red and green candlesticks, looks like a three wave movement so far.
I’d be suspicious of trying to go long here. Normally that’d be my advice, but there’s enough bearishness about to hold off. I’m closing my buy and waiting for now. SOH.
If the market melts up then gold will probably move down, right now qqq, Spx and Dia are new highs, some short covering could be in order. Iwm may break out soon as well. With the markets so high I’m a little tentative on going long but bulls usually end with large moves up over short periods of time.
That’s another reason why I’ve taken my loss and exited Gold here today.
Double top at H4 told that the resistance is too strong 🙂
Thanks to EVERYONE for their posts! I really enjoy all of the input and reading the comments… trying to learn.
Lara – The trading room idea is tremendous. As someone said, many of us aren’t going to become EW experts and we’re here because we trust you. You make the calls; we follow, and all of us can benefit.
Also, adding in the GDX analysis with your Gold updates is a wonderful bonus. Thanks for continuing to do this.
Alan – Nice call with the gold high of 1244.
As far as gold goes, I see it making lower highs and lower lows on the hourly with no long lower wicks. Previously, we saw it bounce but this time it looks different. Also, the USD/JPY is climbing along with the US dollar.
GDX is near the 10 day moving average of 25 but if it should close below this figure, it would signal more bearishness. Also, it’s already signaling bearishness on the weekly with a longer upper wick forming with another session to go tomorrow.
On the hourly, gold is outside the lower bollinger band and looks to be consolidating before it begins to take another leg lower.
The thought of gold falling so we can get a better entry to go long is refreshing.
Long way down before long again though, no? At this point, looking for a bearish entry once the hourly makes its higher RSI run…Let’s see if that strategy works
Cheers Stephen K
Another Traders Room update coming today…
Yippie!! 🙂
It would appear the bottom of the trendline held for now.
Looks like long overdue correction in GDX is here. Target 22.72.
In TA analysis and EW wave counts historical similarity matters??? May be.
Current charts of gold and silver in 4 hour period have been showing HnS in various hourly time periods.
If one look at the 4 hr chart from Nov 8 it looks similar to gold chart from 1980 drop to bottom in 1999 and then the rise till 2005. Where gold broke above 500 critical level. Rest is the history.
Silver target may be 18.50 and gold is 1320+.
Which matches Lara’s target.
I have been wondering for a while if we are not in an extended wave 5 of (1), wave 4 having ended where wave (2) is labelled on the main daily chart. Is that possible?
I have seen that count elsewhere…that would be a huge first wave….