
Price has moved lower which was allowed for but not what was expected. Price remains above the invalidation point on the hourly chart.
Summary: A little confidence may be had in a trend change, but hesitancy in price at the start of a possible new trend is concerning. It is possible we may see another low and the second hourly chart illustrates this risk. Long positions absolutely must have a stop. Realistically, it should be just below the last low at 1,194.50. The target in the first instance is 1,452.
Members may still like to consider a short position to hedge long positions, at least partially. Short hedges should have stops just above 1,211.06 and a target may be at 1,168.
New updates to this analysis are in bold.
Last weekly charts are here and the last video on weekly wave counts is here.
Grand SuperCycle analysis is here.
MAIN ELLIOTT WAVE COUNT
DAILY CHART
Click chart to enlarge.
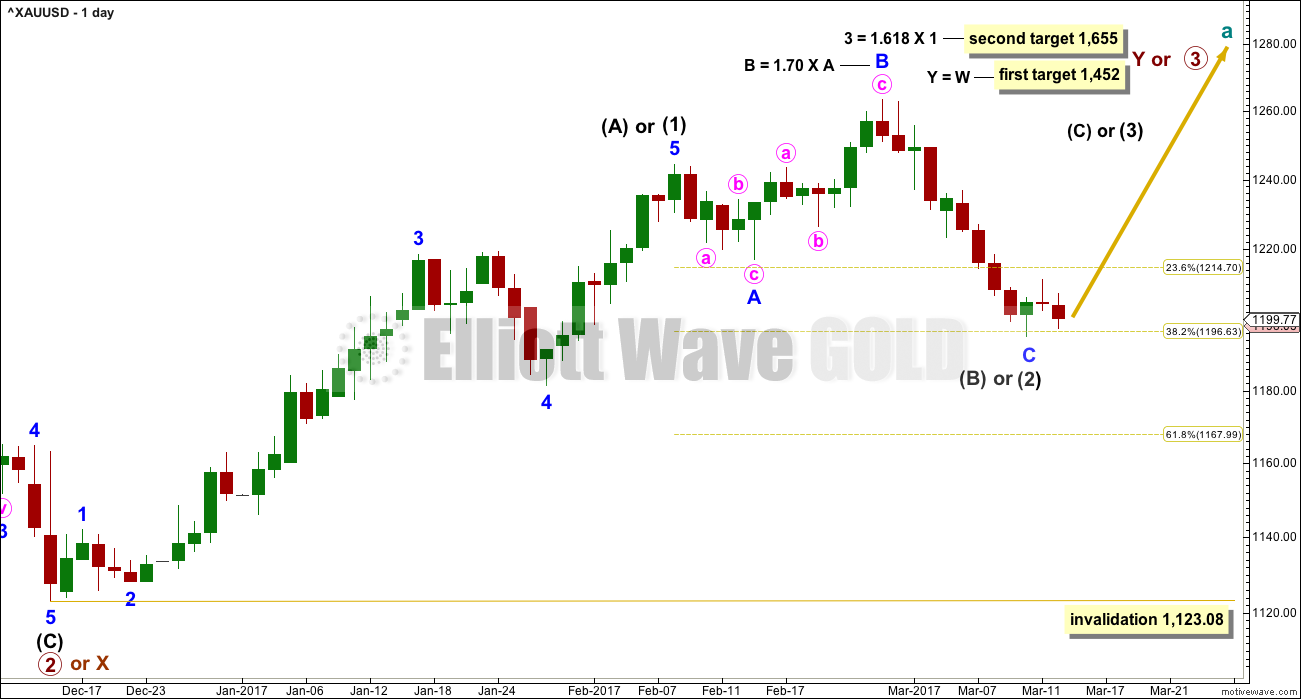
This daily chart will suffice for both weekly charts.
Upwards movement is either a third wave (first weekly chart) to unfold as an impulse, or a Y wave (second weekly chart) to unfold as a zigzag. If upwards movement is a zigzag for primary wave Y, then it would be labelled intermediate waves (A) – (B) and now (C) to unfold.
Intermediate wave (1) or (A) is a complete five wave impulse lasting 39 days. Intermediate wave (2) or (B) so far looks like an expanded flat, which is a very common structure.
Minor wave C must subdivide as a five wave structure. The structure may now be complete (first hourly chart below) or it may require a final low (second hourly chart below).
If intermediate wave (2) is over at Friday’s low, then it would have lasted 22 sessions; this may be considered close enough to a Fibonacci 21 to exhibit a Fibonacci duration.
Intermediate wave (2) may not move beyond the start of intermediate wave (1) below 1,123.08.
If this wave count is correct, then at its end minor wave C will provide a very good opportunity to join the longer term upwards trend.
FIRST HOURLY CHART
Click chart to enlarge.
To see the entire structure of minor wave C downwards, from the high on the 27th of February, see hourly charts published here.
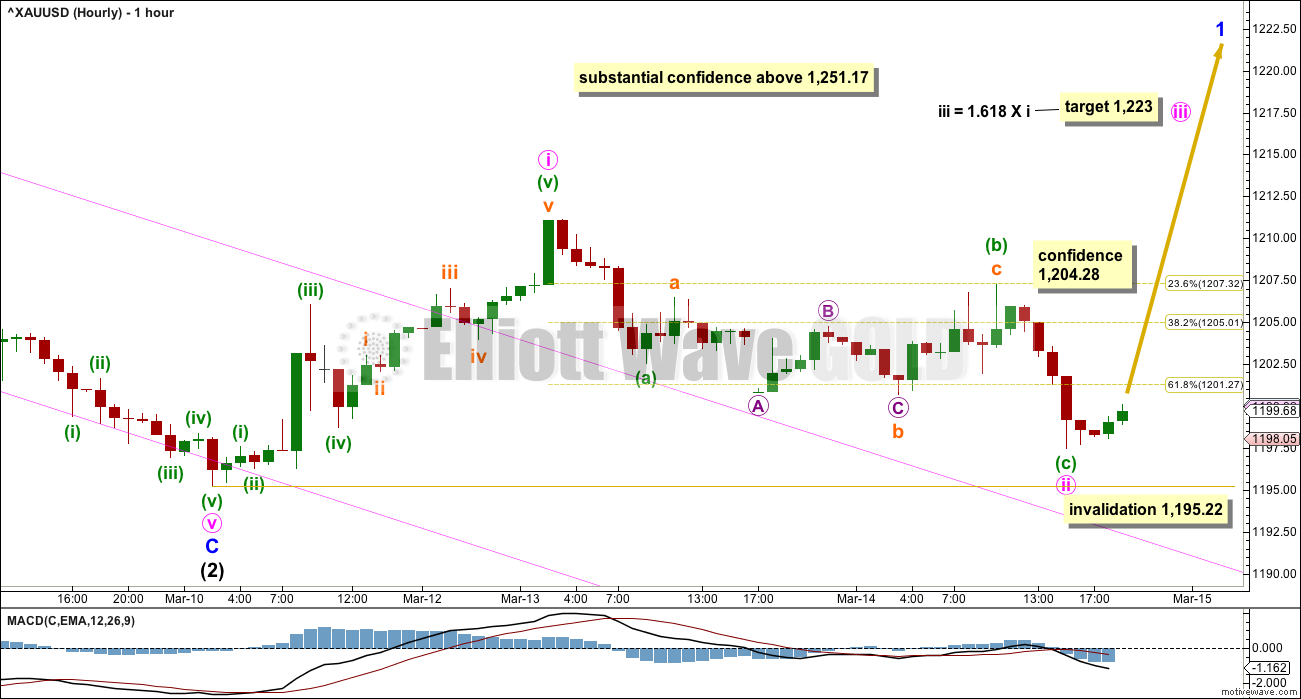
Price has broken out strongly above the Elliott channel and this offers some confidence that a low may be in place.
Upwards movement will fit well as a five wave structure. So far downwards movement still looks strongly like a three wave structure. If this portion of the analysis is correct, then Gold has completed a five up and a three down and this adds a little more confidence to the idea of a trend change.
Minute wave ii may have ended deeper than the 0.618 Fibonacci ratio of minute wave i. Second wave corrections can be very deep; this is not unusual. There is no longer a Fibonacci ratio between minuette waves (a) and (c).
It looks like minute wave ii has curved down to test support at the upper edge of the channel. This looks like typical price behaviour.
If it continues any lower, minute wave ii may not move beyond the start of minute wave i below 1,195.22.
A new high short term above 1,204.28 would invalidate the second hourly chart below and provide a little confidence in this first hourly chart.
SECOND HOURLY CHART
Click chart to enlarge.
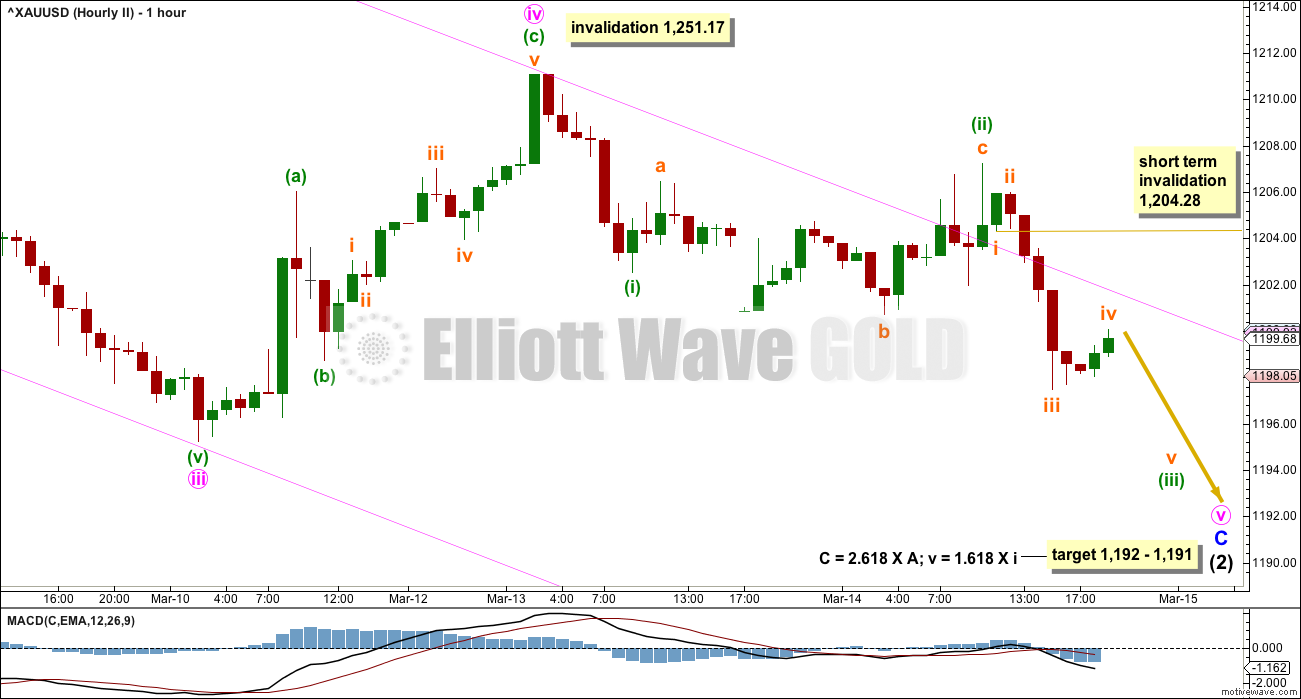
Minute wave iv may have completed as a shallow zigzag. Fourth waves are not always contained neatly within channels, and that is why Elliott developed a second technique to redraw the channel when the fourth wave breaches it. This channel is redrawn with the first trend line from the ends of minute waves ii to iv, then a parallel copy on the end of minute wave iii. Minute wave v may end midway within the channel if the target is met.
It is also possible that the target is too high. The next reasonable target may be the 0.618 Fibonacci ratio of intermediate wave (1) at 1,168.
With minute wave iv moving higher, the target for minute wave v is recalculated for this second hourly chart.
If minute wave iv continues as a double zigzag, then it may not move into minute wave i price territory above 1,251.17.
This wave count remains possible. This illustrates the risk now to long positions.
If minute wave v is continuing lower, then it looks like it may be unfolding as an impulse. Within minute wave v, minuette wave (iii) would be incomplete.
Minuette wave (iii) may only subdivide as an impulse. Within minuette wave (iii), subminuette wave iv may not move into subminuette wave i price territory above 1,204.28. In the short term, invalidation of the first invalidation point would reduce this wave count’s probability. If that happens, then it may be possible that minute wave iv is continuing sideways as a triangle or combination.
TECHNICAL ANALYSIS
WEEKLY CHART
Click chart to enlarge. Chart courtesy of StockCharts.com.
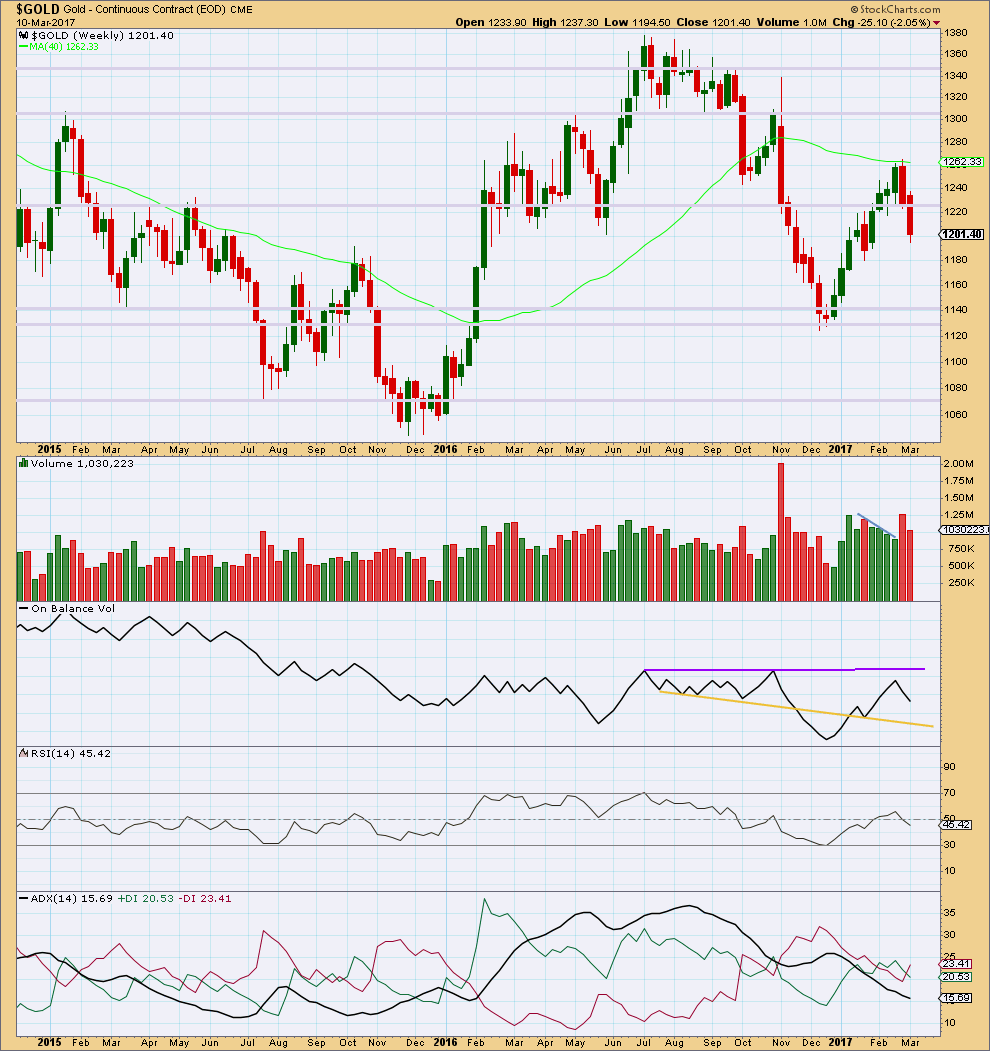
Last week completes a red candlestick that closed with lighter volume than the week prior. This offers small support for the Elliott wave count that sees downwards movement over here or very soon. However, price can continue to fall for a few more weeks of its own weight.
On Balance Volume has some distance to go to find support or resistance. It is not very useful at this time on the weekly time frame.
ADX indicates no clear trend.
DAILY CHART
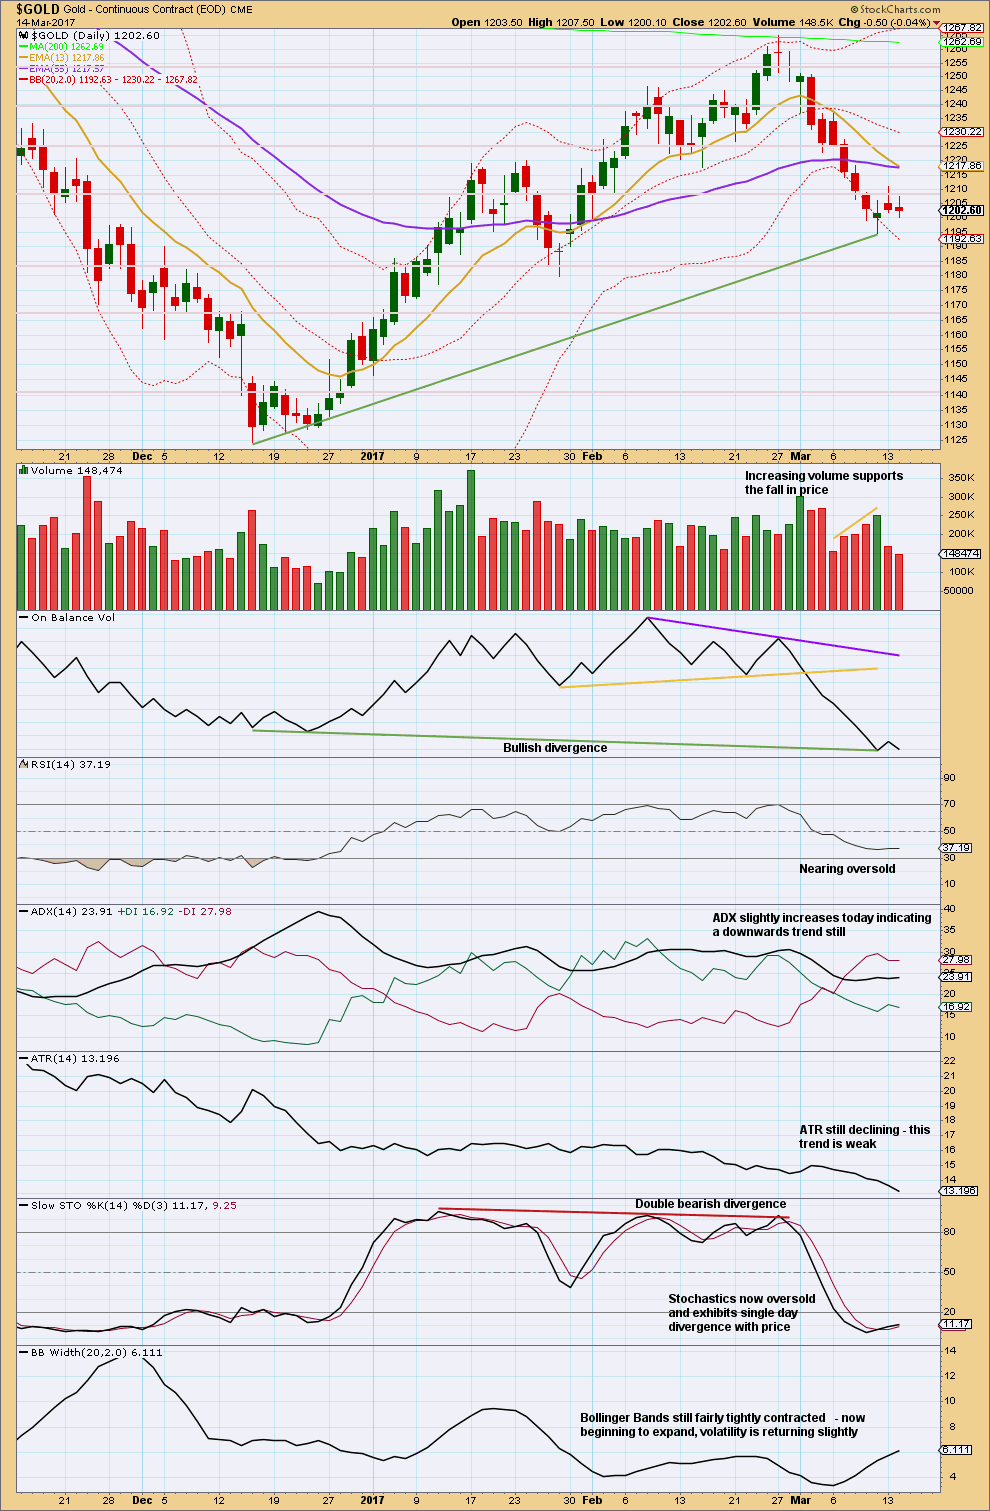
Click chart to enlarge. Chart courtesy of StockCharts.com.
The last two daily candlesticks look corrective with small real bodies and very light volume. The downwards movement today was not supported by volume. Overall, they both together fit the second hourly chart better than the first. If a small consolidation is completing, then it may be followed by another low for Gold.
The downwards trend may yet continue further: RSI is not oversold, ADX now indicates a downwards trend, and although Stochastics is oversold it may remain extreme for longer and may develop multiple divergence before a low is found.
Declining ATR and strong bullish divergence with On Balance Volume indicates the downwards trend may be over sooner rather than later.
Overall, this chart is neutral.
GDX
DAILY CHART
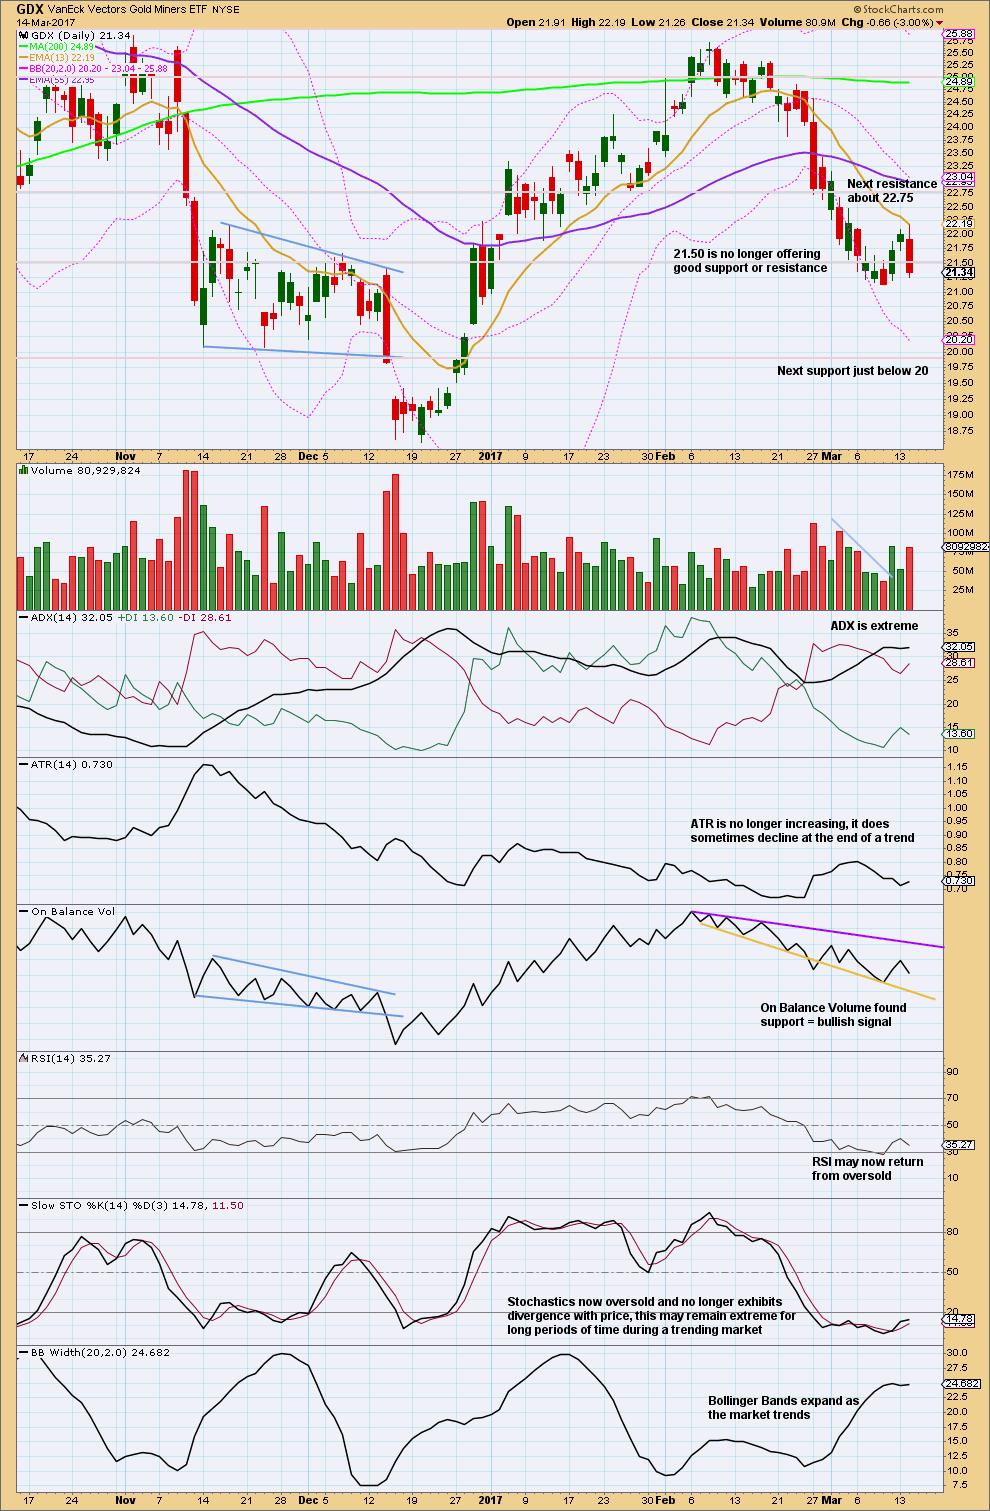
Click chart to enlarge. Chart courtesy of StockCharts.com.
A strong downwards day closes back below prior support on a day with strong volume. The upper wick of today’s candlestick is bearish. Volume today is only a little lighter than the strong upwards day two days ago.
This chart is still mostly bullish: ADX is extreme, RSI reached oversold, and Stochastics reached oversold. It still looks reasonable to expect a more time consuming consolidation or a trend change here or soon to resolve these extreme conditions.
This analysis is published @ 08:34 p.m. EST.
Well, this is very strange. Stock charts data should now be finalised for the session. They have a green candlestick with a very long upper wick for Gold, a high at 1,213.80 and a close at 1,200.70.
My broker shows Gold price currently at 1,219 with no whipsaw down during the session nor at the end to 1,200. Just a straight line up.
What’s up Stockcharts?
Sorry everybody. Regular TA for Gold today just isn’t going to be possible 🙁 Will do my best with BarChart data.
That is quite strange indeed! Every chart I have looked at is just at about the day’s high around 1219.00 as well. (1219.30)
I just had another delicious thought…what if the banksters STILL have not covered???!!
🙂 🙂 🙂
I am absolutely tickled pink that for both SLV and GLD, we are getting a turn with NO 13/50 cross of the daily SMAs. I was kinda expecting the 13 to bounce there with a final spike down bit I think it a’int happening- not this time! Very bullish indeed…very bullish! 🙂
Great work, Lara. I got long the miners and a gold futures contract. Feels good to be on the right side of such a big move.
Awesome 🙂
Now for the rest of the lot in Trading Room to darn well turn around and make us some more money.
USD index may have turned, found support right at it’s trend line. Copper… not sure. It could still go higher to 2.688 (0.618 ratio). NGas didn’t really move up too much, it’s at strong resistance. And as for USDJPY… it’s the bane of my trading ATM. I’m starting to rather dislike that pair.
Lara, I think minuette 1 is at about 1211 not , 1195?
Oh my… yes, you’re right Nick. I was reading the wrong candlestick. How did that happen? Only one coffee…
Thank you for pointing it out.
Minuette (i) is 1,205.18. Triple checked.
At this point in time we’re left with just one wave count for Gold at the daily and hourly chart levels. I’ll take a look and see if I can see an alternate.
The invalidation point and stops may be moved up to just below 1,195.22. Remember, don’t place stops right at these points. Allow for widening broker spreads in times of high volatility (like now!) and set stops 3X normal spread beyond the price point given.
Minuette (iv) may not move into minuette (i) price territory below 1,195.22.
Yes your royal Golden-ness. I was thinking Goldilocks but don’t think you are blonde… 🙂
I am temporarily blonde 🙂
😀
Well, this is excellent!
Looks like the minute (iii) target at 1223 will be very close!
After some opportunistic trading, there could be a great buying opportunity after Minor 1 completes and Minor 2 shows it’s hand. Also, gold likes nested 1-2s near bottoms…could see minute (iii) extending if there is a quick drop below minute (i) high. I’d buy 1207-1210 area A L L D A Y.
Corey
Thank you John. Yes, Gold is going well for us today 🙂
Very nice pop on those JNUG June 10.00 calls.
I am going to do something I rarely do in options trading. I will be rolling call positions BACKWARDS to nearer expiration dates. This is an approach used of course only in cases of very high confidence in a trend.
Unless we are seeing the Mother of all head-fakes, I think it is safe to say the banksters are capitulating. It has been a while since I saw a trend change in the metals without the customary “shake-the-trees” spike down ahead of the turn. Ted Butler has been writing about a co-hort of traders who have taken long positions especially in Silver(400 million ounces) and have not been budging one millimetre.
If this wave count is correct, option trades should really explode if you can get in early. Of course the market makers are going to start widening the spreads to deter traders and this is where trading nearer dated expiration contracts gives a great advantage as you don’t have to worry so much about inflated premiums.
Go NUGT! Go NUGT! 🙂
Little brother JNUG having a stellar day! 🚀 💫 🌝
Very fond of the little brother…very fond indeed!
Looking good. Silver finally waking up and is up more than gold. GDXJ up more than GDX. Now we just need some healthy volume today.
Congrats to Lara for the awesome count and to all that kept it long gold and miners!
😀
USD/Yen taking a big hit, helping Gold and GDX on Fed rate hike decision.
I know 🙁 And that was one of the markets I decided to put a larger position on 🙁
Still holding on in that one. Not happy about it.
Still, i also have a good position on Gold so that somewhat mitigates the loss on USDJPY today.
I decided to open a short to hedge my USDJPY long position. A bit happier about that now.
Oh yeah! Be sure to always hedge! 🙂 🙂
Jeffrey Gundlach, the Bond King, and one of the smartest men in the room, was just on CNBC and he said he is a little nervous the Fed will take the all clear signal from the markets a little too far and come out hawkish.
This would be bullish dollar, bearish gold, Euro and bonds.
The miners have built a nice cushion so that even immediately after the FOMC announcement they can take a good brief dive and not take out the last swing lows as Dreamer mentioned below 🙂
GDX low of 21.14
GDXJ low of 32.66
Also GDXJ filled its gap open today, but GDX was not able to fill its gap. So there’s a good chance that GDX will at least fill its gap before a big reversal upwards.
Of course if FOMC hikes by 0.5 instead of 0.25, we’re going to see a much bigger pull back…
Haha so much for that theory 🙂
It looks like GDX completed a 5 up from the low @ 21.14 and now a deep .89 retracement may be complete for Minor wave 2.
If this count is correct, GDX should not make a new low below 21.14. Tomorrow is a key day. Fireworks begin at 2pm EST. Grab your seats!
https://www.tradingview.com/x/ECZOgLWF/
Lock &Load! 🙂
( I have a sneaking suspicion that fireworks may commence before 2.00 p.m.)
Yeah, sometimes the market knows what it wants to do in advance or there are news leaks…
Moved the high for Minor wave 1 left to the previous high. Minor wave 2 looks like an expanded flat
https://www.tradingview.com/x/O4YuMjBk/
That wave count looks good Dreamer. The first second wave in a new move is often really deep…. it’s hard to know if it’s a deep second wave or if the prior trend continues. The thing that differentiates the two scenarios is often a trend channel, and in the case of GDX the prior downwards channel has been very clearly breached.
We should know in the next few hours which scenario is unfolding….