A strong breach of the base channel on the main hourly Elliott wave count shifted probability from bullish to bearish. The alternate Elliott wave count was then preferred because it expected more downwards movement.
Summary: The new main wave count expects a deep pullback to a target at 1,197 – 1,192. This may be met in 5 or 18 sessions if intermediate wave (2) exhibits a Fibonacci duration of 21 or 34 days.
New updates to this analysis are in bold.
Last monthly and weekly charts are here. Last historic analysis video is here.
Grand SuperCycle analysis is here.
MAIN ELLIOTT WAVE COUNT
DAILY CHART
Intermediate wave (1) is a complete five wave impulse lasting 39 days. Intermediate wave (2) so far looks like an expanded flat, which are very common structures. The most likely point for it to end would be close to the 0.618 Fibonacci ratio of intermediate wave (1) at 1,197. This is also close to where minor wave C would reach the most common Fibonacci ratio to minor wave A at 1,192, so this target zone has a good probability.
Minor wave C must subdivide as a five wave structure. It would be extremely likely to make at least a slight new low below the end of minor wave A at 1,217.05 to avoid a truncation and a very rare running flat.
So far intermediate wave (2) has lasted 16 sessions. If it exhibits a Fibonacci duration, it may total 21 or 34 sessions and that would see it continue now for a further 5 or 18 sessions.
Intermediate wave (2) may not move beyond the start of intermediate wave (1) below 1,123.08.
HOURLY CHART
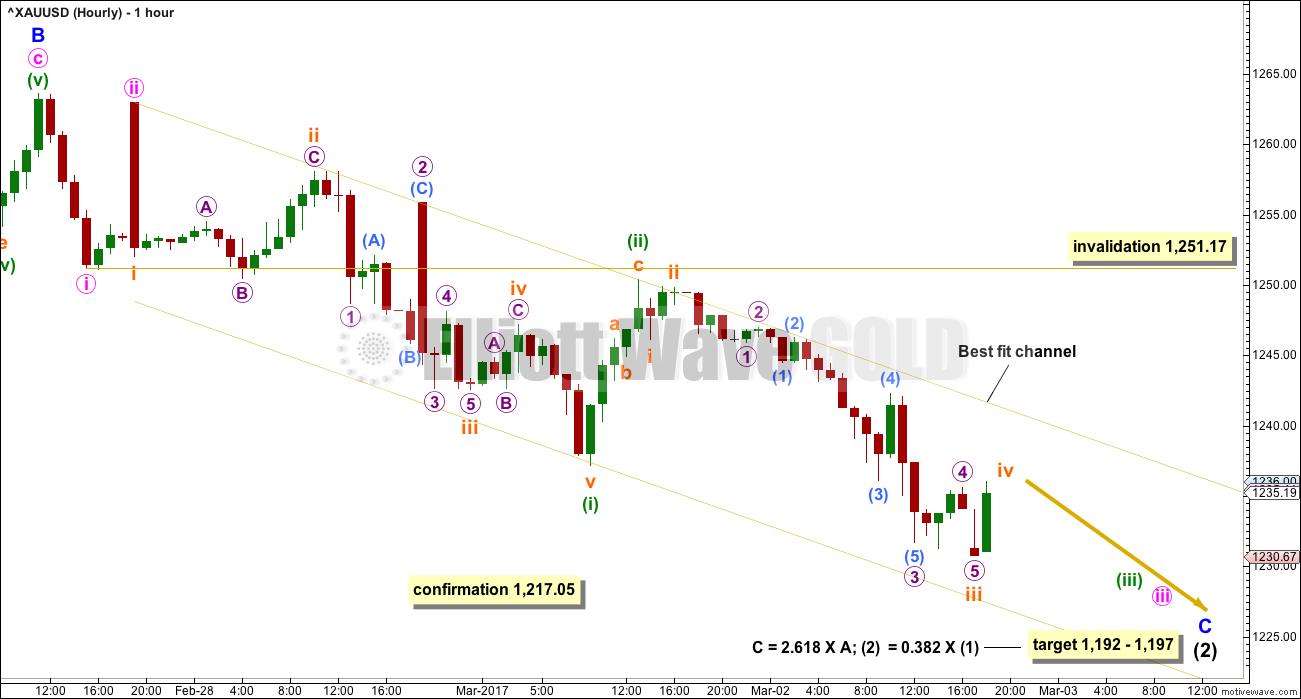
Within minor wave C, minute waves i and ii may be complete. Minute wave iii may be incomplete.
The best fit channel contains all downwards movement so far. If price comes up again to touch the upper edge, that may offer an entry point to join the downwards trend. If price breaks below the lower edge, then that may provide resistance.
Confirmation of this wave count would now come with a new low below 1,217.05. That would invalidate the new alternate wave count below.
When minute wave iii is complete, then minute wave iv may not move into minute wave i price territory above 1,251.17.
The final fifth wave of minute wave v may exhibit a selling climax (opposite of a blow off top). This is common for commodities. Minute wave v may be a swift and very strong extension.
ALTERNATE ELLIOTT WAVE COUNT
DAILY CHART
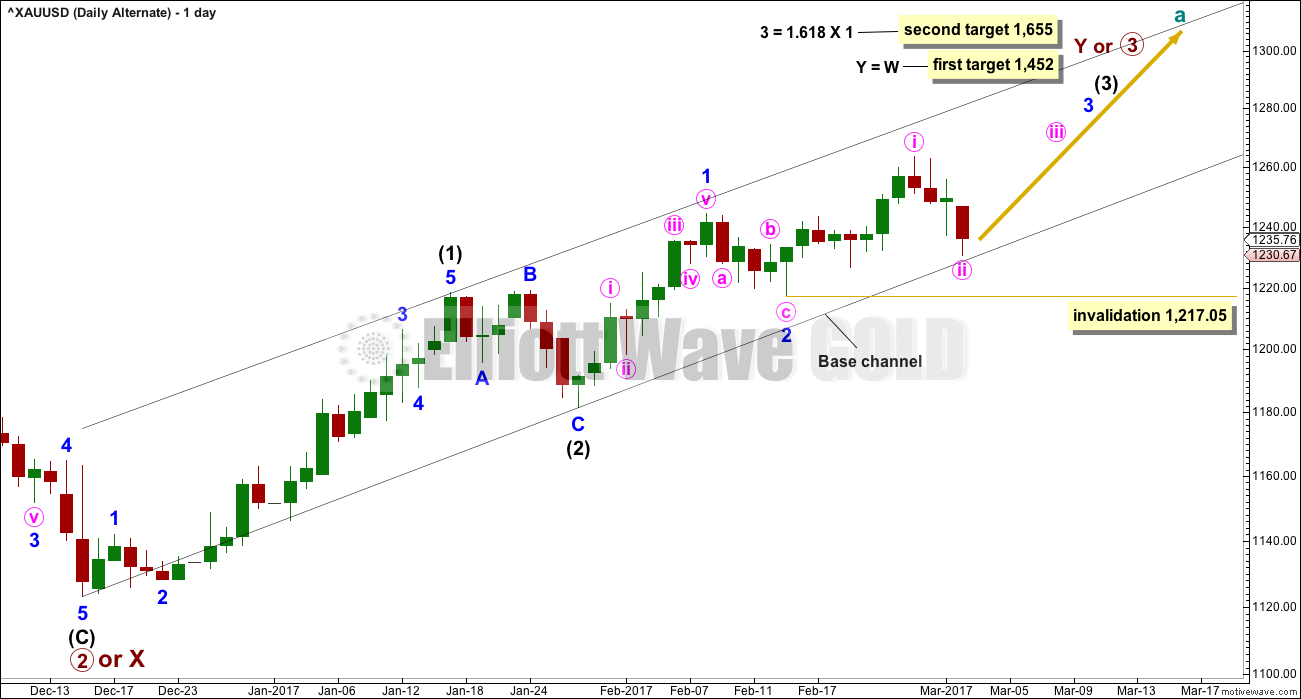
This is a variation on yesterday’s main wave count. Downwards movement strongly breached the base channel drawn on yesterday’s main wave count and that idea now looks wrong. The end of minute wave i is moved higher and on the hourly chart this upwards wave will fit as a five although it does look like a three at the daily chart level.
Minute wave ii may not move beyond the start of minute wave i below 1,217.05.
The black base channel about intermediate waves (1) and (2) should provide support to lower degree second wave corrections along the way up. Minute wave ii should be over here.
If the lower edge of this base channel is breached, then this alternate wave count may be discarded prior to invalidation with a new low below 1,217.05.
HOURLY CHART
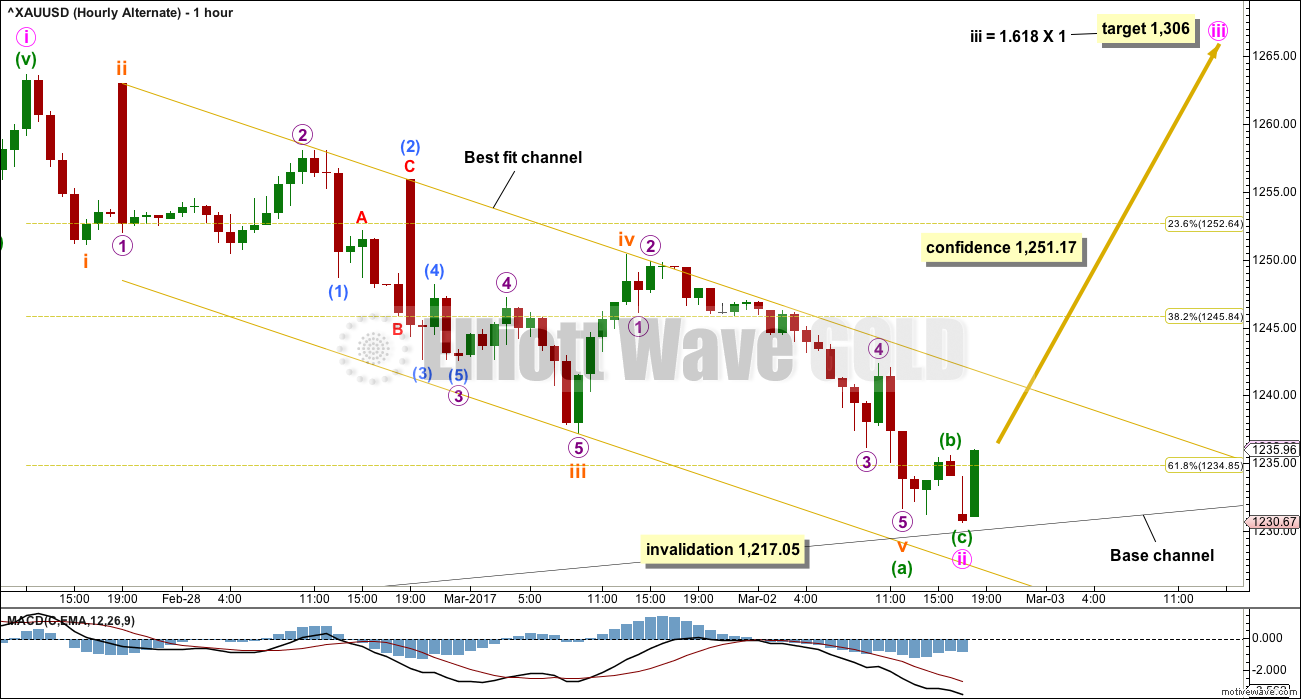
The best fit channel is drawn the same way on both hourly charts because this best contains all downwards movement.
For this alternate, if that channel is fully breached by at least one hourly candlestick (preferably two) of upwards movement (not sideways) above and not touching the upper edge, that shall provide a very strong indication that this alternate wave count may be correct.
If that happens, then probability would switch back from bear to bull.
A new high above 1,251.17 would add reasonable confidence at that stage to this alternate wave count.
TECHNICAL ANALYSIS
WEEKLY CHART
Click chart to enlarge. Chart courtesy of StockCharts.com.
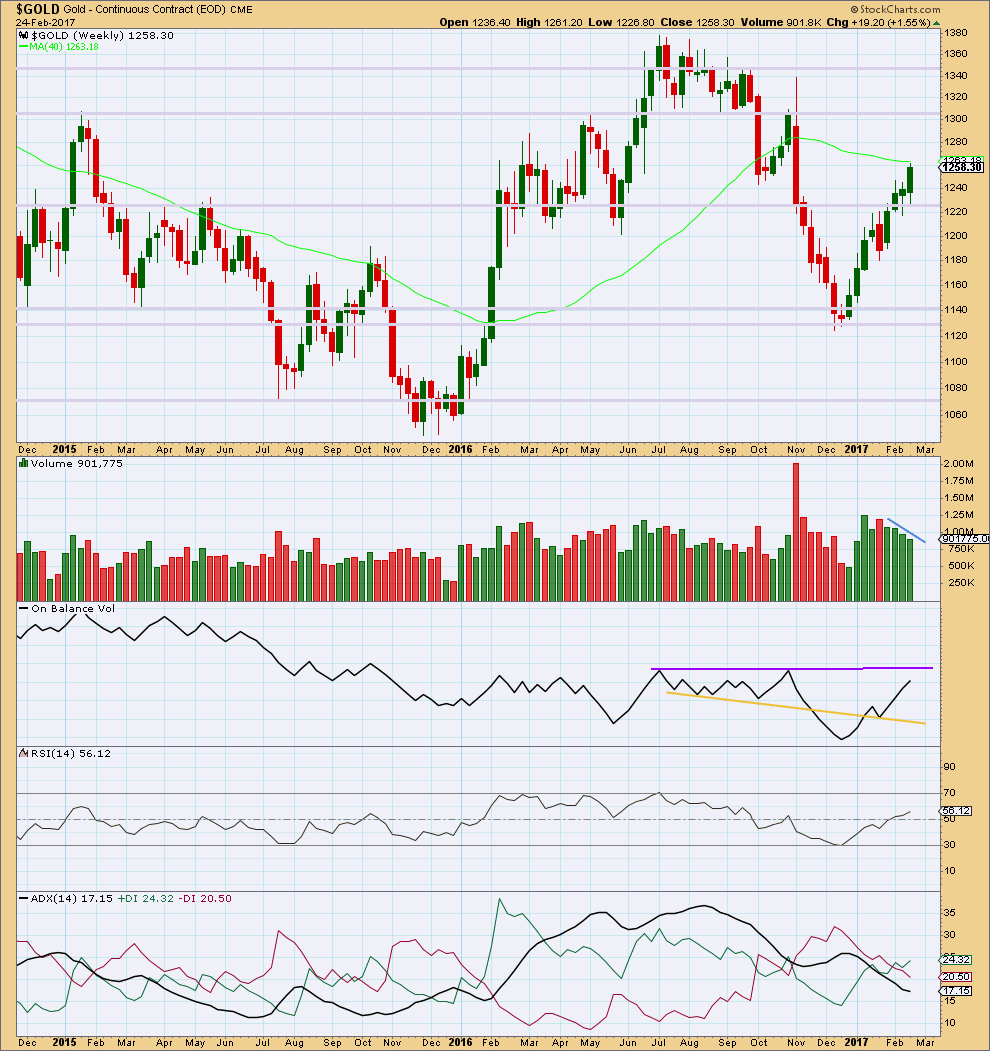
The last four weekly candlesticks are all green and all show a constant decline in volume. At the weekly chart level, this supports the alternate wave count but is very concerning for the main wave count. A third wave up at multiple degrees should have good support from volume.
On Balance Volume is nearing resistance, but it is not there yet.
RSI is not overbought. There is room for price to rise further.
ADX indicates a possible trend change from down to up, but does not yet indicate there is an upwards trend.
DAILY CHART
Click chart to enlarge. Chart courtesy of StockCharts.com.
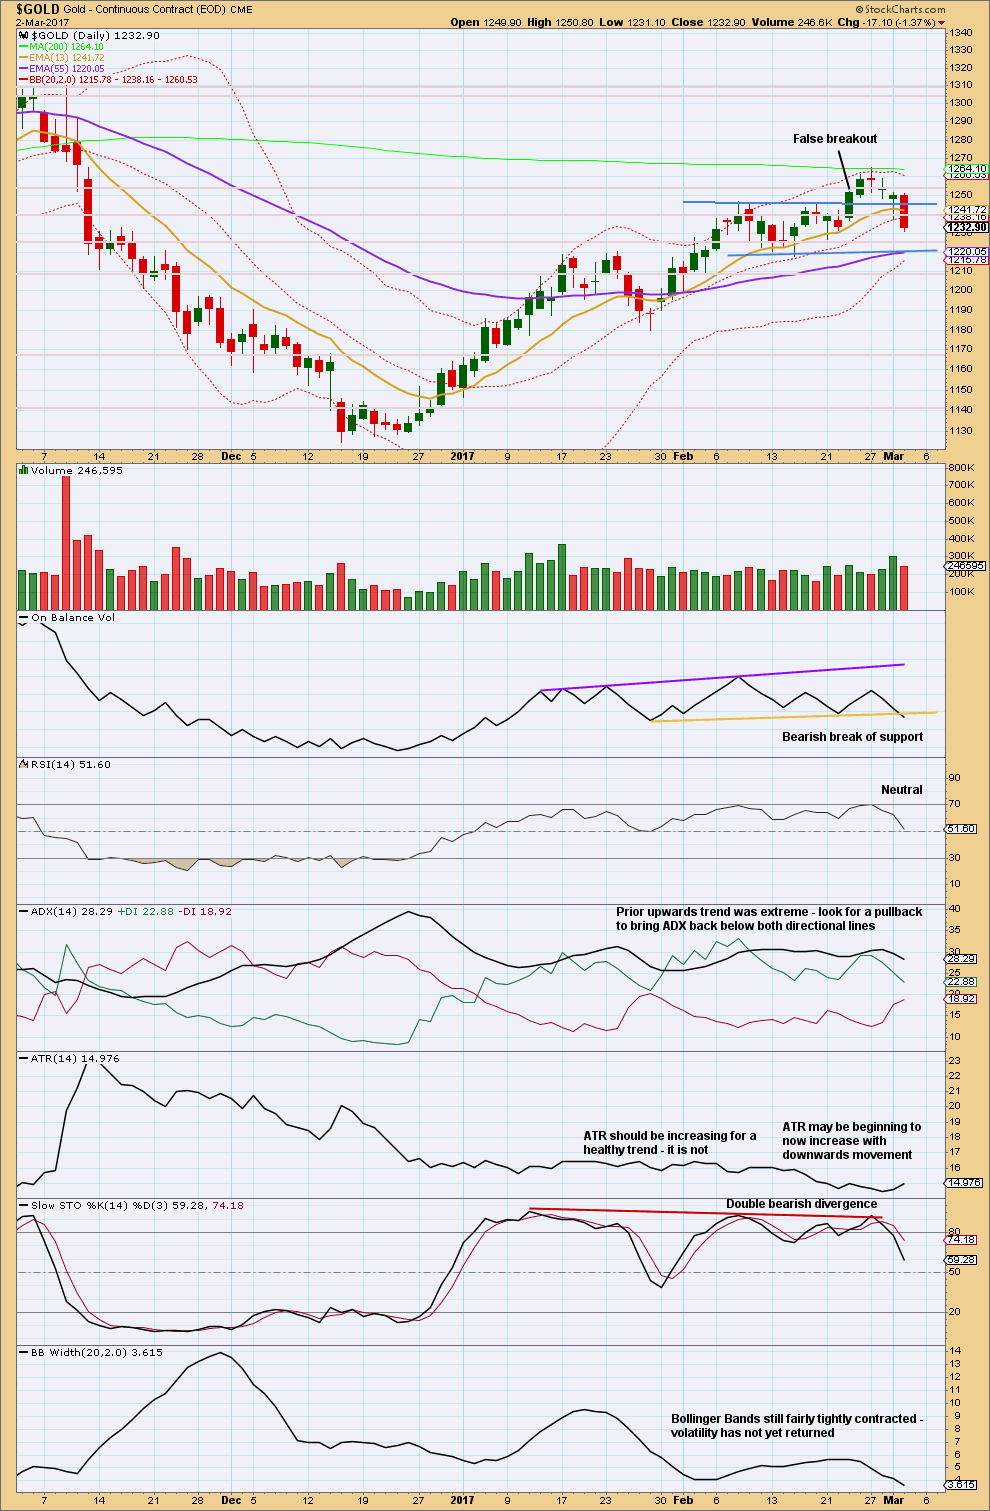
With a strong red daily candlestick closing well back within a prior consolidation zone, the prior upwards breakout now looks false. Sometimes this happens.
Yesterday had an increase in volume for a downwards day and today price moved strongly lower with a decline in volume. The market fell of its own weight today. The fall in price was not supported today by volume.
There is some strong support about 1,225. A bounce may be seen there.
On Balance Volume gives a reasonable bearish signal today.
On Balance Volume is bearish, ADX is bearish, Stochastics is bearish, ATR today is bearish, and today’s candlestick is bearish.
RSI is neutral. Bollinger Bands are neutral.
Overall, the picture today looks more clearly bearish than yesterday.
This does not mean price must print only red candlesticks from here. Trends do not move in straight lines; they have counter trend movements within them and those present an opportunity to join a trend.
At this stage, this downwards movement should be classified as a pullback within an upwards trend, but it looks like it is in the early stages. It needs to move lower to bring ADX down from extreme and Stochastics down to oversold.
If members are trying to trade this counter trend movement, then please be advised it may be choppy and overlapping. Reduce exposure to only 1-3% of equity for any one trade. Always use a stop.
GDX
DAILY CHART
Click chart to enlarge. Chart courtesy of StockCharts.com.
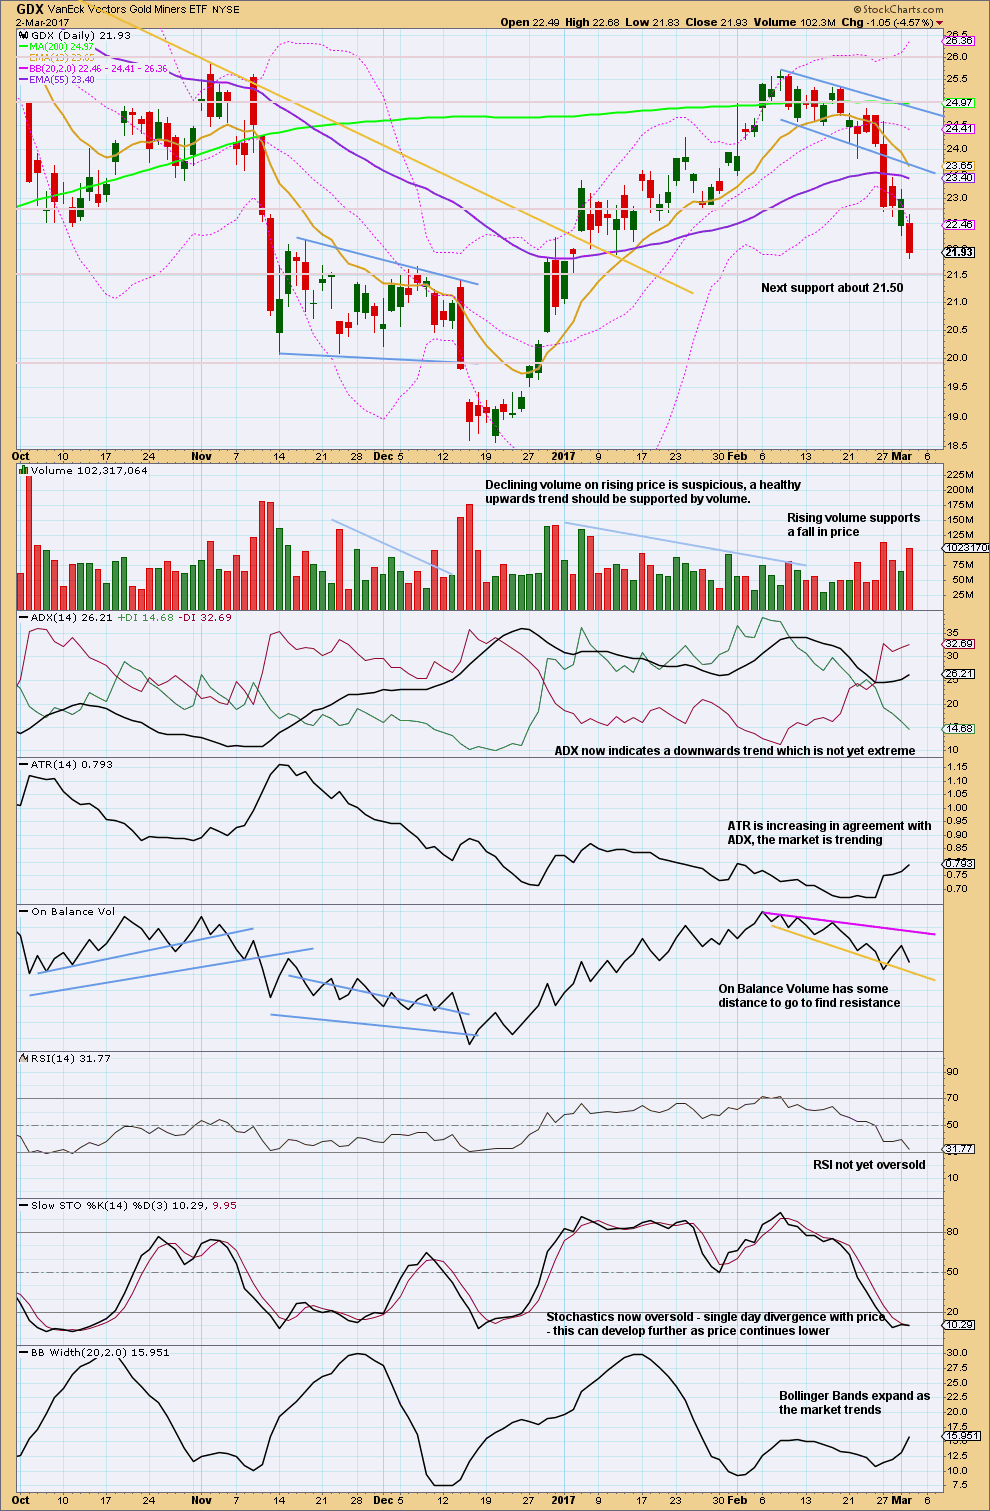
Volume is supporting the fall in price.
ADX is bearish, ATR is bearish, and Bollinger Bands are bearish in that they are widening as the market trends lower. Price can sit at the lower edge of Bollinger Bands for a few days during a trend, as it has been for four days now. Expect a small consolidation to move price sideways here or soon. Thereafter, then the downwards trend may resume.
This analysis is published @ 07:51 p.m. EST.

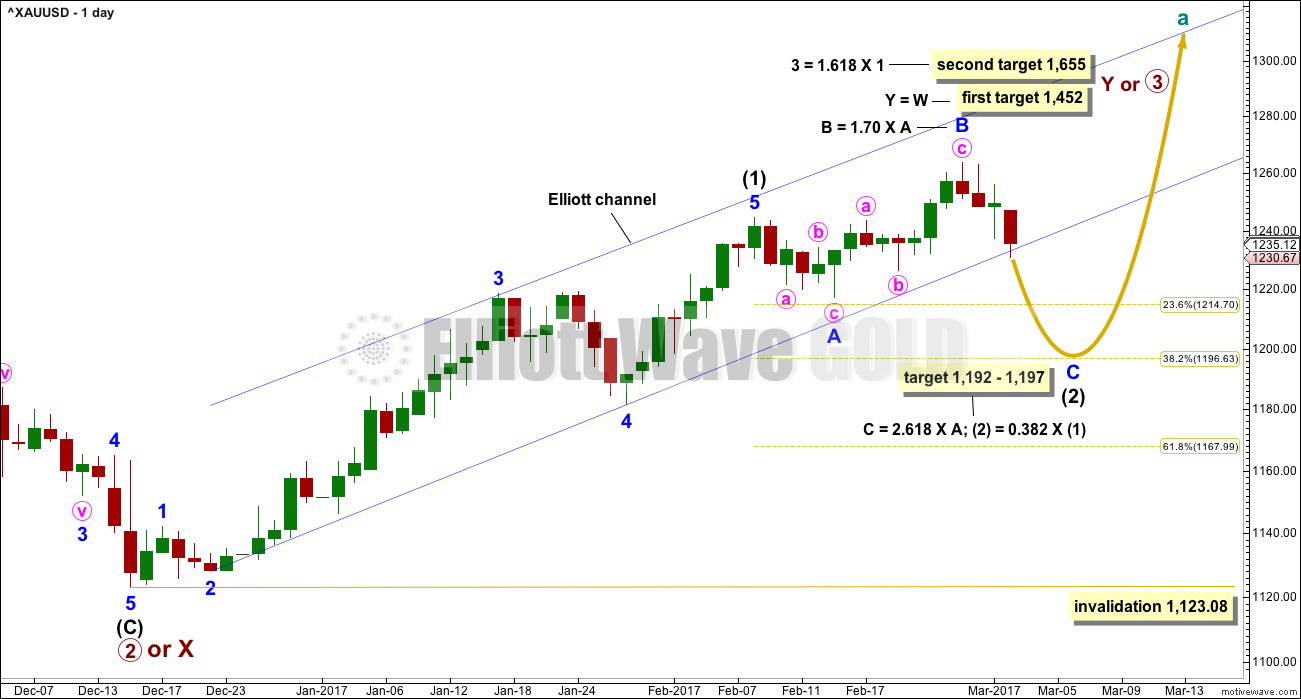
My labelling here of minuette wave (iii) may be premature. If the invalidation point at 1,237.18 is taken out then the degree of labelling within minuette wave (iii) will have to be moved down one, it may be only subminuette wave i within the impulse of minuette wave (iii).
I’ll chart that idea as an alternate.
For now, if this is minuette (iv) it can’t move into minuette (i) price territory.
If minuette (iii) is over then it has a ratio close to equality with minuette (i). Importantly it is longer (just) so there is no limit to minuette (v).
This wave count expects minuette (v) to be a very long and strong extension, maybe ending with a selling climax.
Look for minuette (iv) to find resistance at the upper edge of the Elliott channel. It may not move much higher now, maybe mostly sideways, as it unfolds as a flat, combination or triangle. The 0.382 Fibonacci ratio would be the most likely depth for it.
This presents another opportunity to join a short term downwards trend for those who want to take a punt here. Ideally stops should allow the market room to move, this could be submineutte ii and it’s invalidation point would properly be at 1,250.36.
Always use a stop. Do not invest more than 1-5% of equity in any one trade.
Sure, I’ll take a punt 🙂
…but only after an absolutely exhaustive cost:risk analysis, indicator gazing and consultation with my soothsayer of course. Ahem.
“Look for minuette (iv) to find resistance at the upper edge of the Elliott channel. It may not move much higher now, maybe mostly sideways, as it unfolds as a flat, combination or triangle.”
Looks like that’s exactly what it did before it closed for the weekend. I don’t like to hold positions over a weekend, hopefully I’ll have a chance Monday…
Thanks Lara.
Adding May 17 expiration DUST 33 strike puts for 1.50 per contract. Small position of ten contracts to roll on a double, hard stop at 0.75 ……
Ooops! Those are March 17 expiration not May…
Yikes! Talk about timing…just popped to ask of 1.85! Hard to believe ten contracts would move the market. There must be others starting to pile on…. 🙂
You can do me a favour and explain what you are doing…
It’s in the first comment there. Verne is buying put contracts on DUST. The strike price is 1.50. His stop is at 0.75. The contract he’s buying is the May 17th expiration.
That’s right Verne?
Exactly! 🙂
I am sorry. I don´t see any put contratcs via my broker. Can you send me some further info?
I think the appropriate person to contact is your broker Rafael. It probably has more to do with your broker and / or your trading platform than with what Verne’s doing.
Not all of us have access to all instruments.
Sorry about that. I just assumed readers are familiar with option trades.
The 33 strike put options on DUST expiring on March 17 expect the price of DUST to fall below 33 by the expiration date of March 17. Since I paid 1.50 for each contract, my break even price in DUST is 31.50
I make 100.00 per contract for each dollar DUST falls below 31.5
My hard stop means I sell the options if price falls to 0.75
Since those options are currently out of the money (price above 33.00) I am risking 0.75 for a possible gain of 1.50 if DUST falls to 30.00 in two weeks.
Who is your broker?
It may be worth it to give them a call and inquire. It would be very unusual for a trading account to not have a link for pricing option chains.
Depending on the information you provided when you opened the account (they usually ask how long you have been trading and whether you have previously traded options), you may need to get special permission to trade them. Try pulling up the chart of a stock and look for an “options” button that should take you directly to the chains for the stock or ETF if it has them available for trading.
If you have never traded options before, you may want to do a bit of reading to get familiar with that type of trade. In the meantime, buy only a contract or two to get the feel of things. Good Trading!
I forgot to mention (if you are new to options), each contract (call or put) controls 100 shares of the underlying stock or etf. You miltiply the option price by 100 for each contract you buy or sell. For example, an option price of 0.75 for a call will cost 75.00 for each contract you buy, and entitle you to take ownership of 100 shares of the underlying stock or ETF at the strike price, provided the stock or ETF is trading at or above the strike price on expiration. You can also choose to exercise most options at any time before expiration provided shares are trading above the strike price for calls (and below the strike price for puts in which case you sell the underlying shares at the strike price).
Oops! Thank you Verne. I didn’t see your reply to Rafael before I made my reply.
Bid on those puts now up to 1.95, ask is 2.25
Selling half (5 contracts for a limit price of 2.10 per contract, will open sell to close order on remaining five at limit of 3.10, good till cancelled (GTC)
Filled at 2.10…
DUST 33 puts now at 1.90/2.20 bid/ask This chain has the best spread and looks like an easy double over 14 days
DUST Mar 17 expiration 32.00 puts at 1.65/1.85 bid/ask…but not for long I wager…
Hi Verne. It’s great reading your posts. I have a question on how you came to pick DUST and these 2 particular strike prices?
Why not NUGT calls instead? Or GDX/GDXJ calls for that matter?
Just trying to learn from an experienced pro…
I try to find the chains with the tightest spreads, so you don’t get jacked when the options return a meagre or no profit even with big move. This can be a bit tricky as sometimes market makers will steer traders away from options they don’t want to sell with ridiculous bid/ask spreads. Fortunately I know what ETFs they tend to do this with and when the spreads get laughable that is usually a signal they expect some serious movement. Another thing to keep in mind in those cases is that they will go ahead and fill you at a much better price indicated by the spread if you are persistent with you own reasonable bid. Those other ETFs you mention also have good spreads if you are patient enough to find the right chain.
Thanks Verne.
Yeah I noticed that trying to trade options in SCO. Right before a big news the spreads become outrageous… and sometimes remain that way the rest of the day. So it’s hard to get in or out of a position.
Fourth day of lower BB penetration by miners’ ETFs. The longest recent such stretch has been five days. It sure is looking like a turn up just ahead folk. They may all print a green candle today….
Fed Rate Hike Tool
Since I posted this a couple of days ago, the chances of a March rate hike went up to 75.3% and now a bigger rate hike is expected. This is likely weighing on the metals and miners.
http://www.cmegroup.com/trading/interest-rates/countdown-to-fomc.html
GDX weekly look updated
https://www.tradingview.com/x/nzt9uBUk/
This weekly GDX analysis is a work of art Dreamer!
Thanks Ari! It is colorful for sure.
An excellent summary of the bigger picture there. Thank you very much Dreamer 🙂
Great observation of the Golden Cross on the weekly moving averages. It has not yet happened on the daily but the 50 dma is curling up and should confirm with its own cross the next week or so….
It looks like GDX could be close to a bottom, but it’s difficult to say since Gold and Silver likely have a ways to go before making a bottom.
Sometimes miners do bottom before Gold and that may be the case this time since the miners have been correcting longer than Gold and Silver and are almost at their .618 Fib retracement already. We also need to watch for an extended 5th wave in the Miners that goes below my target at 21.31. Tricky times.
https://www.tradingview.com/x/uvWLbOiX/
good analysis imo
Thanks Harald!
It must be! 1.00 JNUG calls have disappeared from the June expiration option chains. The market makers are onto me…rats!! 😬
Oh well. I’ll just scoop up some more 10.00 strikes at bargain basement prices…a buck!
? ??
Yes indeed. Not only do they frequently turn first at interim bottoms, they also turn last at tops. In fact this is one of those closely held trade secrets of Gold and Silver traders who use options – the miners are great at triggering reliable entry points…positions already in the green…. 🙂