
Downwards movement continued as expected for the main Elliott wave count.
Summary: If members have profitable short positions opened below 1,248, consider taking profits.
Watch how price behaves carefully when markets open on Monday. If the channel on the second hourly chart is breached, then expect a deep second wave correction is underway. For more aggressive traders, at its end this may present an opportunity to join the new short term downwards trend.
One approach to this market may be to set an order to open a short position if price gets up to 1,248, with a stop just above 1,263.64. Because this downwards movement this week is a counter trend pullback reduce risk to only 1-3% of equity, and always use a stop.
The new main wave count expects a deep pullback to a target at 1,197 – 1,192. This may be met in 5 or 18 sessions if intermediate wave (2) exhibits a Fibonacci duration of 21 or 34 days.
New updates to this analysis are in bold.
Last monthly and weekly charts are here. Last historic analysis video is here.
Grand SuperCycle analysis is here.
MAIN ELLIOTT WAVE COUNT
DAILY CHART
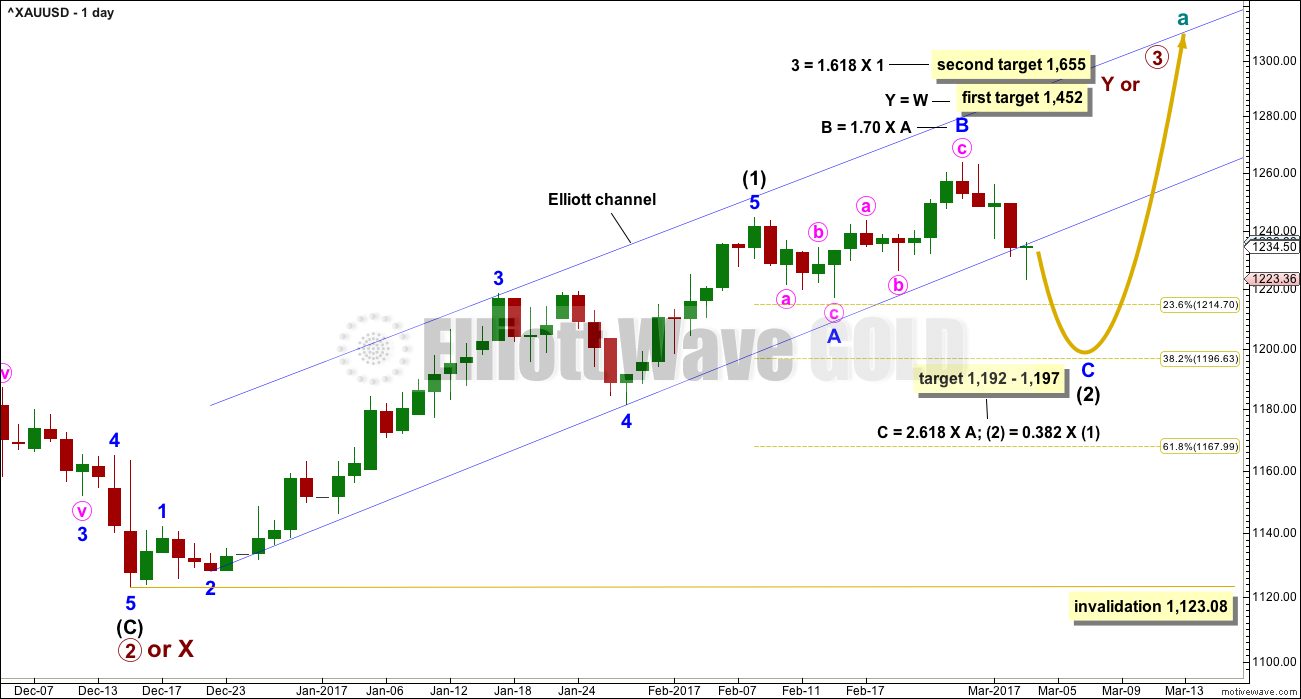
Click chart to enlarge.
Intermediate wave (1) is a complete five wave impulse lasting 39 days. Intermediate wave (2) so far looks like an expanded flat, which are very common structures. The most likely point for it to end would be close to the 0.618 Fibonacci ratio of intermediate wave (1) at 1,197. This is also close to where minor wave C would reach the most common Fibonacci ratio to minor wave A at 1,192, so this target zone has a good probability.
Minor wave C must subdivide as a five wave structure. It would be extremely likely to make at least a slight new low below the end of minor wave A at 1,217.05 to avoid a truncation and a very rare running flat.
So far intermediate wave (2) has lasted 17 sessions. If it exhibits a Fibonacci duration, it may total 21 or 34 sessions and that would see it continue now for a further 4 or 17 sessions.
Intermediate wave (2) may not move beyond the start of intermediate wave (1) below 1,123.08.
HOURLY CHART
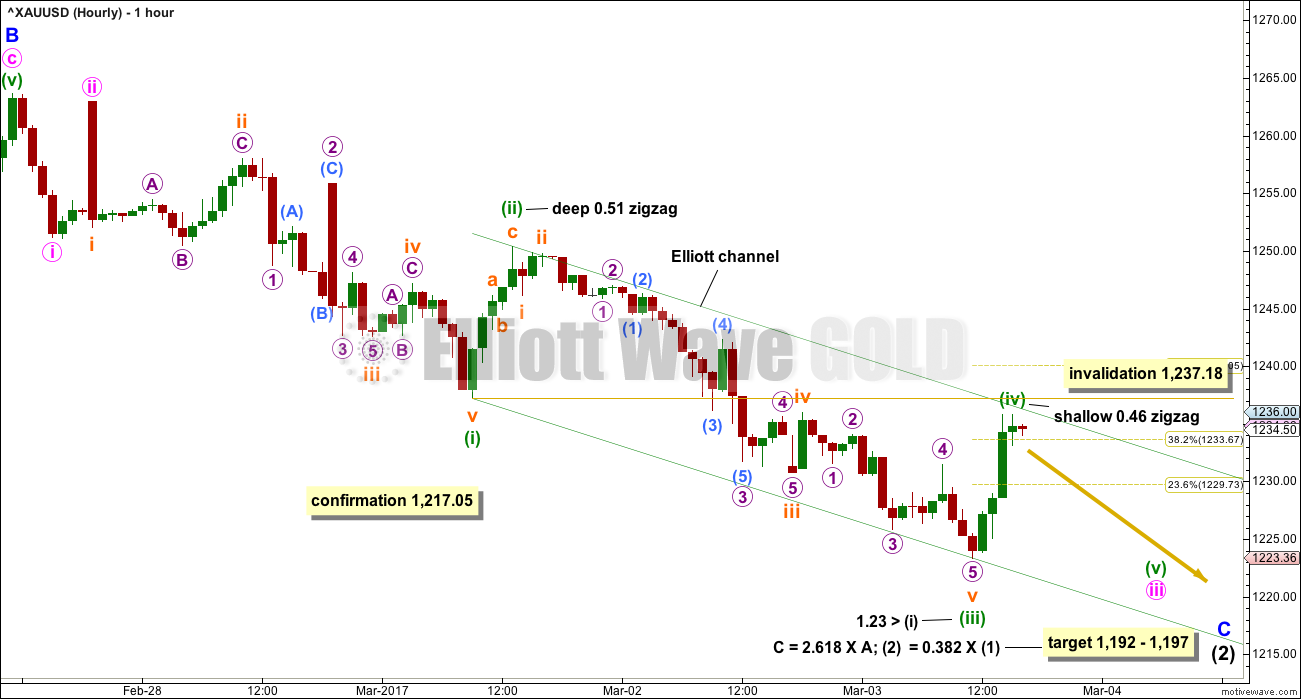
Click chart to enlarge.
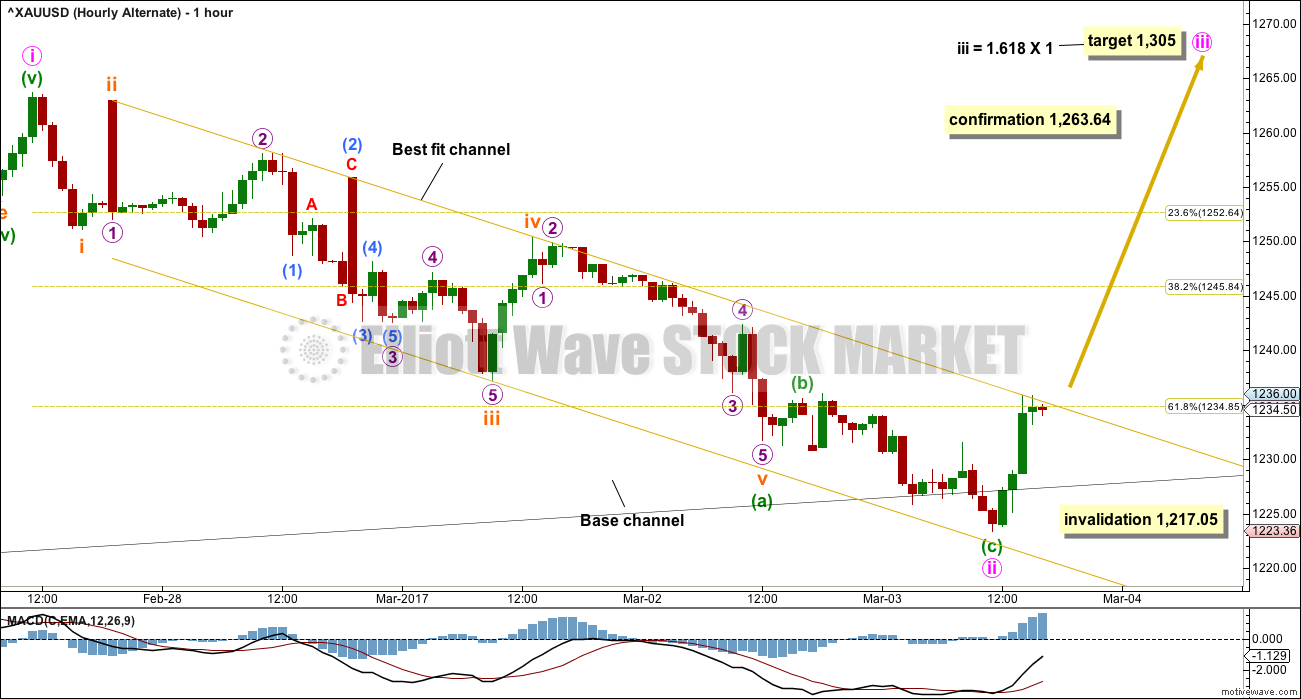
Minor wave C must subdivide as a five wave structure, either an impulse or an ending diagonal. It does look more likely that an impulse is developing at this stage, but it is not possible to rule out a diagonal.
Minute waves i and ii are seen still as complete. Minute wave iii is seen still as incomplete.
Minute wave iii may only subdivide as an impulse. It is common for Gold to exhibit very strong extended fifth waves within its third wave impulses. Look out for minuette wave (v) to be very strong, possibly ending with a selling climax.
If minuette wave (iii) is over as labelled on this chart, then it is reasonably close to equality in length with minuette wave (i), close enough to say they exhibit a Fibonacci ratio. Importantly, minuette wave (iii) is longer than minuette wave (i), so the core Elliott wave rule stating a third wave may not be the shortest is met. What this means is that minuette wave (v) is not limited in length now by minuette wave (iii). It may be extended.
Minuette wave (iv) should be over here as there is almost no room for it to move into. It may be finding strong resistance at the upper edge of the channel.
If this wave count is right, then each time the upper edge of the channel is touched represents an opportunity to join the short term downwards trend.
Minuette wave (iv) may not move into minuette wave (i) price territory above 1,237.18.
SECOND HOURLY CHART
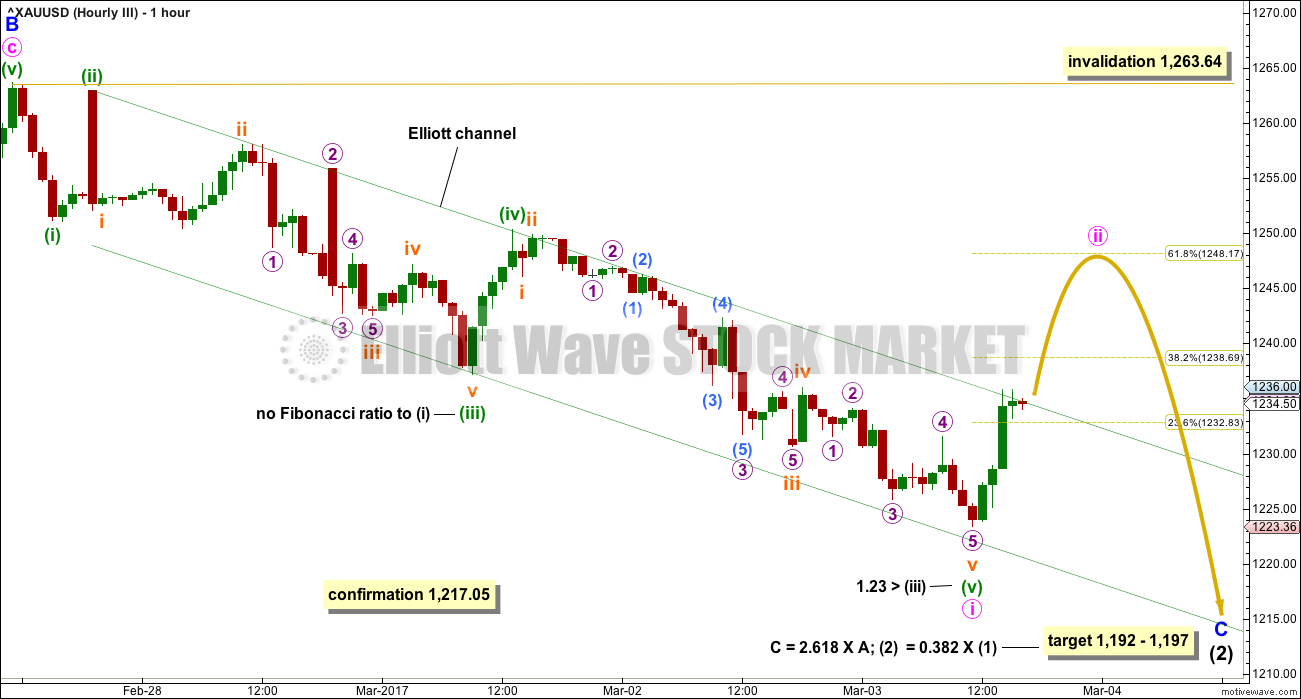
Click chart to enlarge.
It is possible that a five wave impulse downwards completed on Friday. This may be minute wave i within the impulse of minor wave C.
Minute wave ii may correct to about the 0.618 Fibonacci ratio at 1,248. Second waves are most commonly deep.
If price breaks above the upper edge of the channel on Monday morning, then this second wave count should be preferred. Look out for a bounce. That may present a good opportunity to join the new downwards trend.
ALTERNATE ELLIOTT WAVE COUNT
DAILY CHART
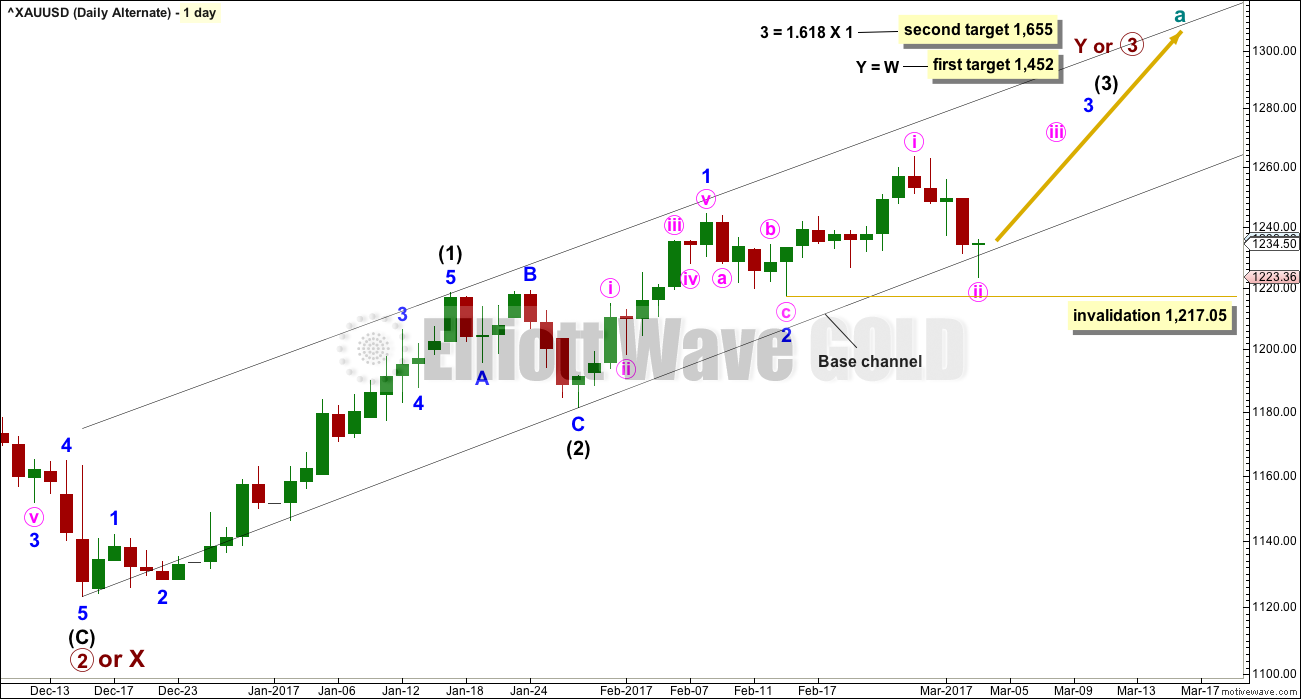
Click chart to enlarge.
Minute wave ii may not move beyond the start of minute wave i below 1,217.05.
The black base channel about intermediate waves (1) and (2) should provide support to lower degree second wave corrections along the way up. Minute wave ii should be over here.
If the lower edge of this base channel is breached, then this alternate wave count may be discarded prior to invalidation with a new low below 1,217.05.
At this stage, the lower edge of the base channel is overshot but not breached. A breach would constitute a full daily candlestick below and not touching the lower edge.
HOURLY CHART
Click chart to enlarge.
The best fit channel is showing exactly where upwards movement ended for Friday’s session.
For this alternate, if the best fit channel is fully breached by at least one hourly candlestick (preferably two) of upwards movement (not sideways) above and not touching the upper edge, that shall provide a very strong indication that this alternate wave count may be correct.
If that happens, then probability would switch back from bear to bull.
A new high above 1,250.36 would add reasonable confidence at that stage to this alternate wave count.
TECHNICAL ANALYSIS
WEEKLY CHART
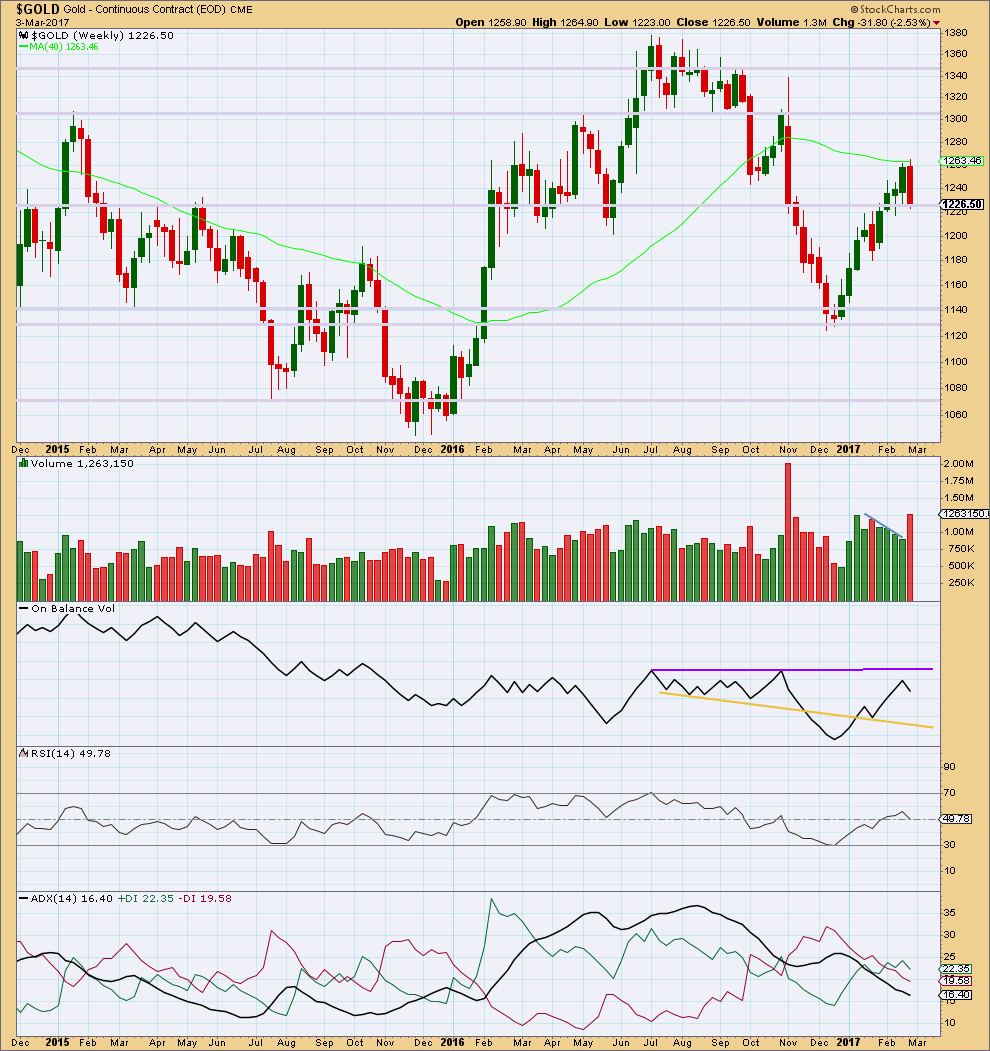
Click chart to enlarge. Chart courtesy of StockCharts.com.
The last four upwards weeks are all green and showed a decline in volume. Now this week is red and shows a strong increase in volume. This weekly candlestick completes a bearish engulfing candlestick pattern, the most reliable reversal pattern.
This indicates strongly that upwards movement is over for now. Either sideways or downwards movement from here is a reasonable expectation.
On Balance Volume has still not found resistance.
ADX still indicates the market is not yet trending at the weekly time frame.
DAILY CHART
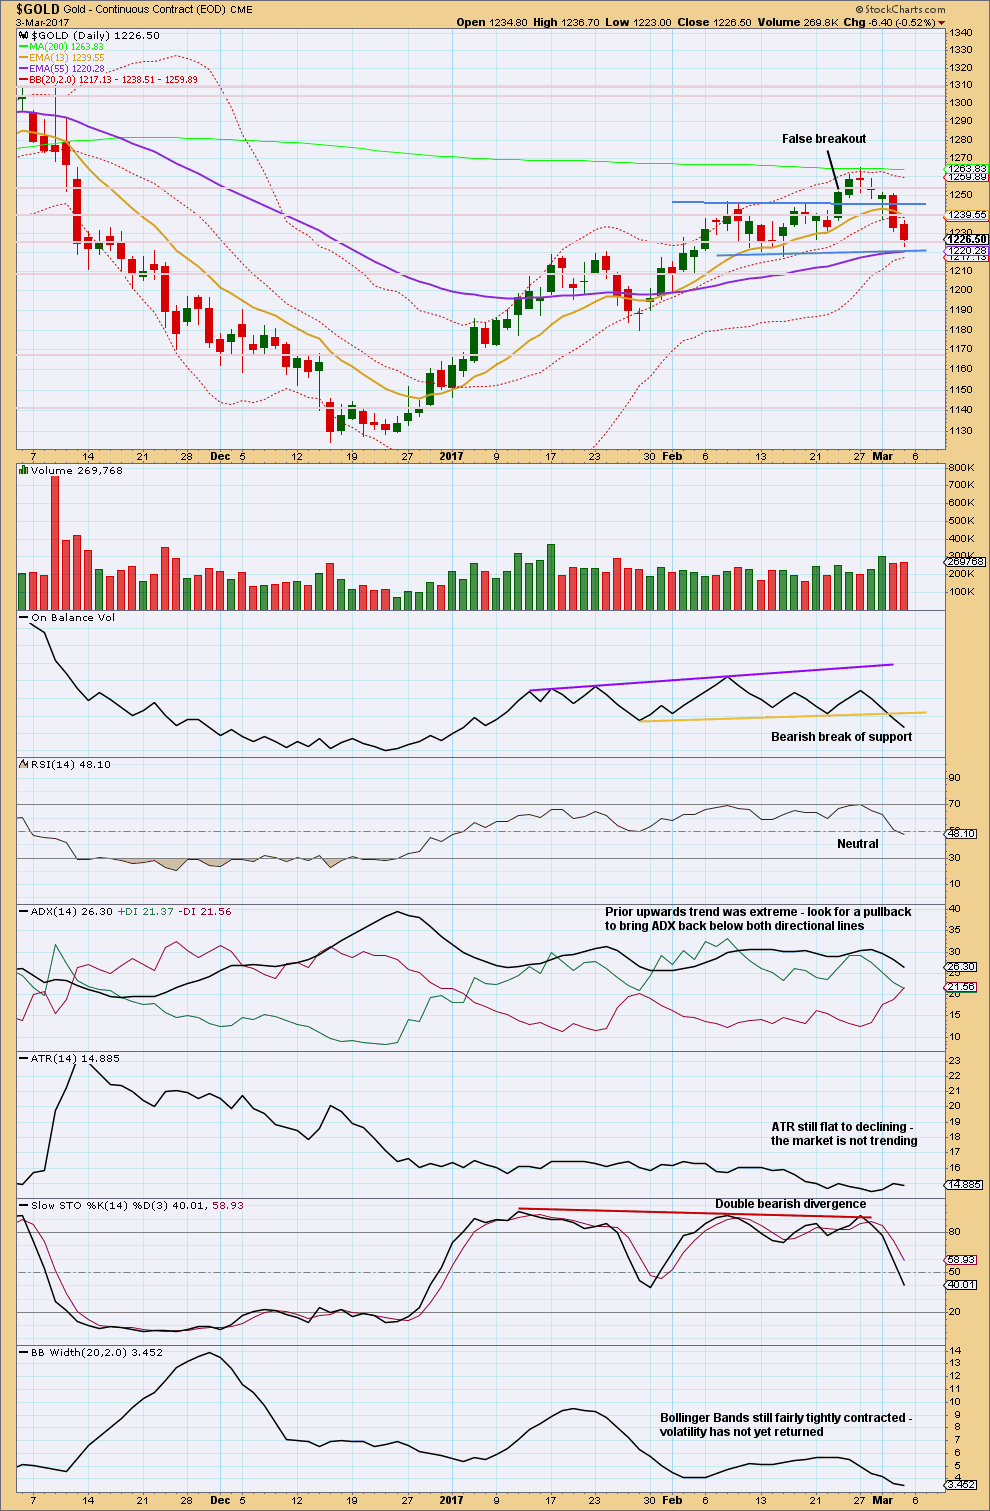
Click chart to enlarge. Chart courtesy of StockCharts.com.
There is strong support for price about 1,220, the lower edge of the prior consolidation.
Volume shows an increase for Friday. The downwards movement in price has support. This is bearish.
ADX is still not down below the directional lines. This pullback likely has further to go and this too is bearish.
Stochastics is not yet oversold and this too is bearish.
Bollinger Bands are contracting further. If this is a counter trend movement, then that makes sense. This is neither bullish nor bearish.
On Balance Volume now is giving a very clear bearish signal. This should be taken very seriously. This supports the main Elliott wave count strongly over the alternate.
GDX
DAILY CHART
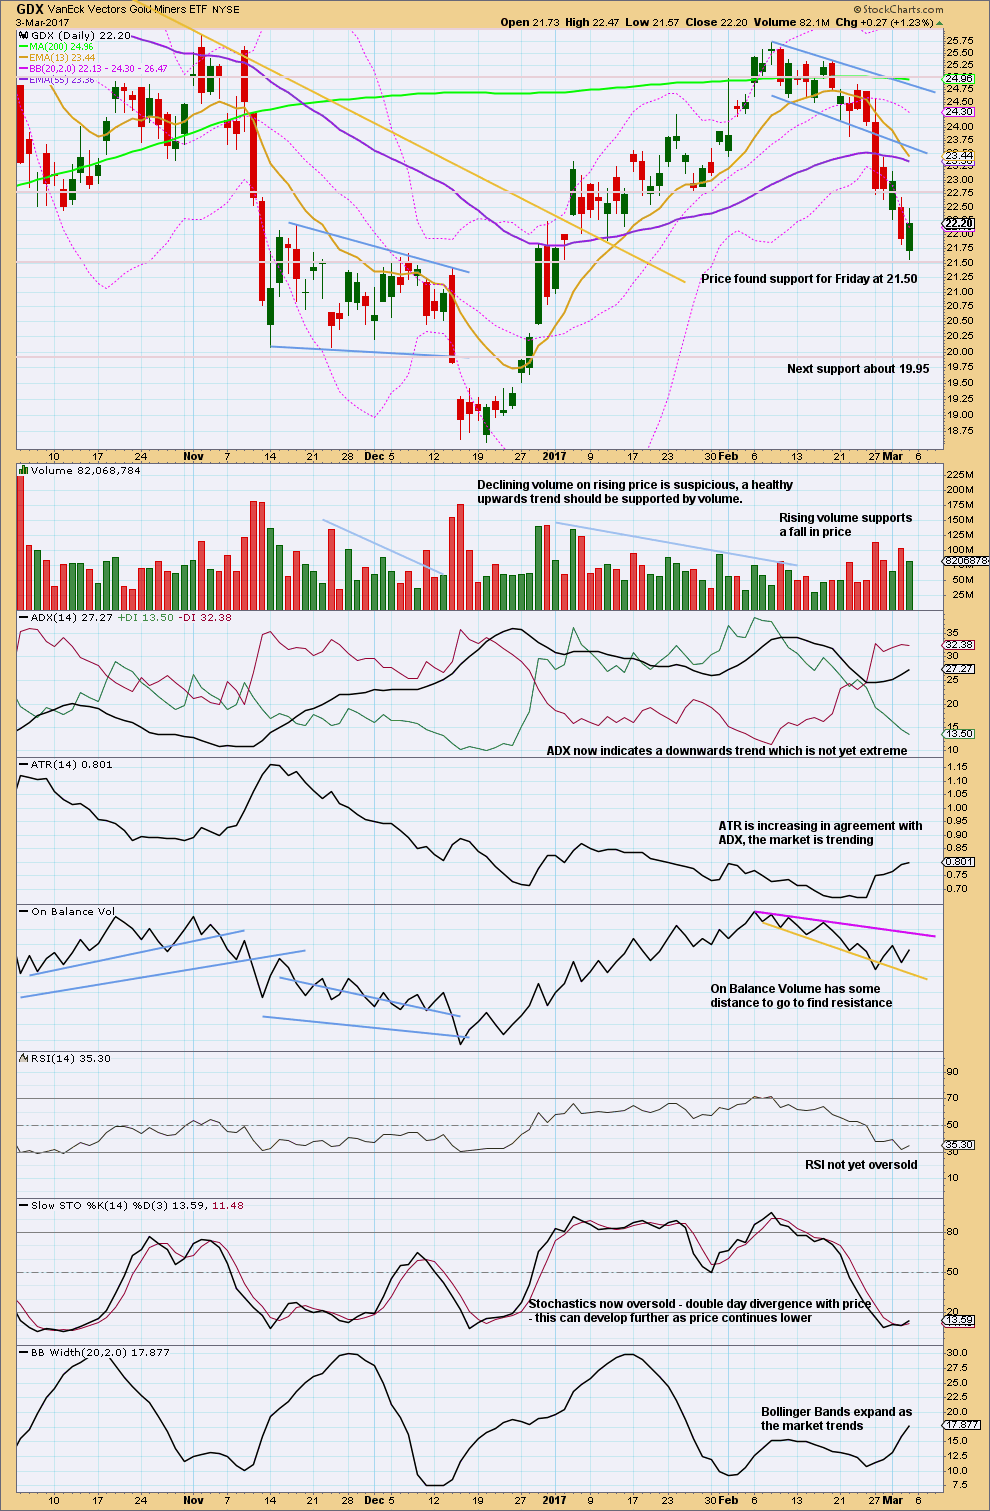
Click chart to enlarge. Chart courtesy of StockCharts.com.
The fall in price had some support from volume this week. Now Friday completes a lower low and a lower high, the definition of a downwards day, but the session closed green and the balance of volume during Friday was upwards. Upwards movement during Friday’s session shows a decline in volume, so it did not have support. This is interpreted as bearish. This looks like a counter trend bounce.
This chart looks overall very bearish. Look for possible bounces as each support line is found. Next support is about 19.95.
This analysis is published @ 12:10 a.m. EST on 4th March, 2017.
Second hourly chart updated:
This makes more sense. Downwards movement this session may be a B wave. It’s showing weakness, B waves should be very weak.
If there’s something that makes you question price movement, then it’s often a B wave.
Look out still for a bounce for a deep second wave correction.
First hourly chart updated:
The channel doesn’t look quite right. If downwards movement from this session is the start of a third wave at two degrees it should be stronger.
Today again a green candle as friday 😕
Perplexing. The miners are diving, but now at 61.8 retrace a point where they could bounce, but in order for that to happen the stock market will probably have to go down. Silver and gold commercials have been buying shorts, which was the right thing to do since silver plunged. The question is whether or not the next move down in gold will move the miners. Could have a swift move down in gold and silver overnight followed by a move down in the stock market which washes everything out. Was hoping for a larger move down in the Spx but levitation is occurring, see if it holds up again into the close, if not might be a big down day in the stock markets soon. If so, anything is possible. If this isn’t a continuation of a good bear market, might be a time to start buying some Jnug.
Yea…will be interesting to look at it all after today. 401k funds are red today, so let’s see how the rest of the week looks…:). Also looking at JNUG at this retrace, but some unknowns…so I am personally just gonna hold tight a few hours and drink some wine tonight.
Gdxj just retraced 61.8 percent of move up
How r u managing it since gold has a way’s to go for the target? I know we were thinking that miners might go flat, or possibly go up while gold drops…but what fib r u looking at if GDXJ continues to drop w/ gold?
I took profits at noon today, looking for the next position…and using as much intel as possible.
Lara…good call on the impulse!
Scaling in on Jnug calls out in June just in case the gold market bounces, might coincide with a stock market correction. Lara’s b up might occur. Jnug could still keep going down along with the miners. I think that even if if it goes down a fib .78 percent you may still make money in June, especially on a bounce. Also the miners led gold down so they might lead gold up. They might not move down as much as gold. That being said don’t forget Lara’s small position with stops rule. Also have a small short position in slv that has a shorter expiration. I’ll sell soon Best of luck.
Thanks, Dermot….good luck as well
Buying back contingent of DUST May 17 33 strike puts for limit of 0.85
Current bid/ask 0.75/1.00
Filled at 0.82…
Lara, I would be interested in seeing your analysis of BitCoin. I see it has been 2 years since your last review, and with the possible approval of the ETF for this “currency” later this month, your analysis would be timely. If you know of another crypto-currency that could be next BitCoin, that chart would be welcome too. I’d also like to have feedback from members who may have an opinion or recommendation.
Okay, will do an update. Finding data for that was a hard one, Cesar found it for me and I don’t know from where.
I’ve also had requests for DXY, IWM and USDTRY.
FYI everybody I’m not at home for the next few days. Drove down (10 hours!) from Northland to Gisborne on Sunday to visit friends, and there just happens to be rather good surf down here.
So I’ll be looking at more markets for everybody when I get home Friday.
Looking at GDX, the current leg down looks complete, so could the bottom be in for GDX?
I don’t think the bottom is in. Here’s why:
——————————————————————-
1) Gold and Silver need to move a fair amount lower (yes, sometimes the miners bottom first)
2) The Fed meeting is 1 1/2 weeks away. May be too soon for the bottom.
3) There is almost no divergence ( I know, there doesn’t need to be divergence, but it helps).
4) I added new upper and lower trend lines from the 2016 highs and lows. These converging trend lines MAY be significant. Therefore, my new target for a GDX bottom is the 2016 lower trend line which is in the low 20’s.
The arrows show the possible path, but I didn’t change the count to reflect this idea yet. This could end up being a W-X-Y for Intermediate wave 2 if this idea plays out.
https://www.tradingview.com/x/L3bRYQfm/
I second your sentiment that the bottom might not be in for GDX.
I remember what Lara had mentioned a while back that intermediate second waves are usually very deep and longer lasting than it’s intermediate first wave. And we still have not had the violent drop in gold that the miners have had, and how silver’s big drop last week are preluding.
So I’m looking for a much deeper and longer intermediate wave 2 correction… but with lots of overlapping ups and downs to really confuse us all. It already started with a false breakout to the upside… we’ll probably be getting more of that in the up coming weeks
Dreamer, I can see a slight alteration which could make another new low, just one, and maybe fit your expectations for divergence there.
Minuette (i) within minute iii looks rather like a three. Try moving the label for minuette (i) up to the prior small swing low, minuette (ii) up to that little high just after it.
Now where you have minuette (i) label that subminuette i…. follow this through and the last low which could then be labelled minute iii.
Now the count would need minute iv and v to complete minor C impulse.
GDX slight update, per Lara’s idea. Thanks Lara!
https://www.tradingview.com/x/QX17NuKw/
Nice, that looks a bit better I think Dreamer 🙂
Main count, version 1 currently has R:R of 1:10. Even if probability is circa 20-30%, that still seems quite favourable to me.
Lara: May I request minimum once a month to have zoom out daily wave count chart from bottom of 2015 as gold unfolds upward?
I keep learning and understanding EW counts. Thanks for excellent work.
Thanks.
Okay.
I have been using the current decline to get positioned in some option trades on the long side a few months out. There have also been some good short term trade set-ups for the nimble. As I indicated in the previous post, I am now expecting a pretty nasty bear raid some time in the near future and these are notorious for running stops with a vengeance. For this reason I will be approaching my stops a bit differently for the next week or so by using moving averages which are less likely to be influenced significantly by a bear raid. I am expecting for the miners ETFs, if we are in a deeper correction, that the 13 day SMA will cross below the 50 day SMA and continue lower for a bit. If we get a bounce there the correction could be over and I will be holding long positions. A little proprietary metric I have found useful in the past in trading the miners…. 🙂
That’s an excellent idea, great advice Verne. Thank you for sharing.
Cesar likes to use moving averages for support / resistance too.
I tend to use sloping trend lines more.
Some interesting developments in COMEX futures Silver trading that may be hinting at bullish prospects for the white metal. A new cohort of futures traders are holding onto their positions. These guys are not the big banks and technical traders who normally are on opposite sides of the Silver trade but new kids on the block and they now hold futures contracts totaling some 400 million ounces. So far as I know JPM is the only big bank who has been taking delivery of the metal and now have enough to cover their share of the some 800 million ounces the big banks are short. I have no doubt the big banks have their sights firmly trained on that huge long position that is not being liquidated. I am expecting at some point to see a furious bear raid to move Silver down sharply. The other banks may have to up the ante without JPM as they may not be willing to go back to being naked short after accumulating enough metal to cover their own short position. I am not sure how deep the pockets of the new cohorts are. 400 million ounces is quite a bit. If the bear raid is sharp but brief with a furious intra-day snap-back it could be the banks’ attempting to unload their short position in the face of holders of long futures contract who are refusing to budge. I suspect the raid will come overnight with a possible reversal coming the next trading day. It could possibly last a few days. I have a feeling those long positions are not going anywhere soon. The next few weeks are going to be fascinating for PMs.
Thank you very much Verne for this info.
Most welcome! ☺
One word of caution here is that the commercial silver shorts are higher than the last peak. It has already dropped 5 percent. might be a bearish flag now. Agree short term may be down, long term….up but I want to see those silver shorts in the commercial side start to cover this week. We will see what Friday holds when the commercial traders are reported.
Hopefully the miners will let us know when this route is over. When we start seeing them move up or flatline while gold is still moving down we know we are getting close.
Yeah, I think that may work too. They did lead with the turn down, so they may lead with the turn up.
Or not. Nothing is certain. But will keep an eye out for this.